USDCAD Technical Analysis! SELL!
My dear subscribers,
My technical analysis for USDCAD is below:
The price is coiling around a solid key level - 1.4067
Bias - Bearish
Technical Indicators: Pivot Points Low anticipates a potential price reversal.
Super trend shows a clear sell, giving a perfect indicators' convergence.
Goal - 1.4013
About Used Indicators:
By the very nature of the supertrend indicator, it offers firm support and resistance levels for traders to enter and exit trades. Additionally, it also provides signals for setting stop losses
Disclosure: I am part of Trade Nation's Influencer program and receive a monthly fee for using their TradingView charts in my analysis.
———————————
WISH YOU ALL LUCK
Signal

BTCUSD: A bullish channel might be formedHello Traders!
Considering the next few days, we might see a buy opportunity for the king of the Cryptos!
General long-term is bullish,
Mid-term is bearish,
we are around a zone,
a week bearish trend seen breakable.
We would trade the possible channel after reaching the activation line.
If SL hit before the activation line, we'll cancel the trade .

DASHUSDT.P - November 4, 2025DASHUSDT.P is exhibiting a strong corrective rebound within a prolonged downtrend, with price approaching the $207.29–$407.47 zone marked for short entries. The setup anticipates a potential rejection from this resistance area, targeting $48.40 for partial profit and $21.22 as the final objective. The stop loss is positioned above $603.93, defining the invalidation level. A sustained move below $48.40 would confirm renewed bearish momentum, while a breakout above $603.93 would negate the short setup.
Risk Assessment: High risk — the trade relies on rejection from major resistance after an aggressive upside move, but the wide stop zone provides flexibility against volatility.

GBPAUD: Short Trade with Entry/SL/TP
GBPAUD
- Classic bearish formation
- Our team expects pullback
SUGGESTED TRADE:
Swing Trade
Short GBPAUD
Entry - 2.0084
Sl - 2.0096
Tp - 2.0060
Our Risk - 1%
Start protection of your profits from lower levels
Disclosure: I am part of Trade Nation's Influencer program and receive a monthly fee for using their TradingView charts in my analysis.
❤️ Please, support our work with like & comment! ❤️

AUDUSD My Opinion! BUY!
My dear followers,
I analysed this chart on AUDUSD and concluded the following:
The market is trading on 0.6526 pivot level.
Bias - Bullish
Technical Indicators: Both Super Trend & Pivot HL indicate a highly probable Bullish continuation.
Target - 0.6565
About Used Indicators:
A super-trend indicator is plotted on either above or below the closing price to signal a buy or sell. The indicator changes color, based on whether or not you should be buying. If the super-trend indicator moves below the closing price, the indicator turns green, and it signals an entry point or points to buy.
Disclosure: I am part of Trade Nation's Influencer program and receive a monthly fee for using their TradingView charts in my analysis.
———————————
WISH YOU ALL LUCK

AUDJPY Set To Grow! BUY!
My dear followers,
This is my opinion on the AUDJPY next move:
The asset is approaching an important pivot point 100.66
Bias - Bullish
Safe Stop Loss - 100.57
Technical Indicators: Supper Trend generates a clear long signal while Pivot Point HL is currently determining the overall Bullish trend of the market.
Goal - 100.83
About Used Indicators:
For more efficient signals, super-trend is used in combination with other indicators like Pivot Points.
Disclosure: I am part of Trade Nation's Influencer program and receive a monthly fee for using their TradingView charts in my analysis.
———————————
WISH YOU ALL LUCK

TAOUSDT.P - November 3, 2025TAOUSDT.P is displaying a corrective rebound within a broader downtrend, with price approaching the $470.53 buy limit zone. The setup suggests a potential continuation higher from this demand area, targeting $492.79 for partial profit and $499.37 as the final objective. The stop loss is positioned below the $456.66 support, defining a clear invalidation level. A sustained move above $470.53 would confirm bullish momentum and favor a continuation toward the upper targets, while a breakdown below $456.66 would negate the setup and open room for further decline.
Risk Assessment: Moderate risk — the trade depends on a successful defense of the buy limit, but the recent bullish push adds credibility to a short-term recovery.

BTCUSDT.P - November 3, 2025BTCUSDT.P is forming a potential lower-high structure within a broader corrective phase, suggesting renewed bearish momentum. The setup plans a sell short limit order at $116,380, targeting a move down toward the profit level at $100,904, with a stop level positioned at $131,811 for risk management. The structure favors a downside continuation as long as price remains below the $116,380 resistance zone. A break above the stop region would invalidate the bearish bias and shift momentum back to buyers.
Risk Assessment: Medium risk — while the market structure supports a bearish setup, the wide range and volatility around the $110,000–$120,000 zone introduce potential fluctuations before confirmation.

ASTERUSDT.P - November 3, 2025ASTERUSDT.P is currently retracing after a sharp upward impulse, consolidating around the $1.00 area with a projected move toward the $0.9108 area. The chart outlines a buy limit order at $0.9108, anticipating a bullish reversal targeting $1.0746 for partial profit and $1.2291 as the final take-profit level. The stop-loss is placed at $0.7513, maintaining a strong risk-to-reward ratio. Confirmation of bullish continuation will depend on holding above the $0.9108 support level and a clean rejection from that zone.
Risk Assessment: Medium risk — while the setup is aligned with the broader bullish structure, the trade depends on precise entry execution near support, making timing crucial for optimal results

GOLD: Bearish Continuation & Short Signal
GOLD
- Classic bearish pattern
- Our team expects retracement
SUGGESTED TRADE:
Swing Trade
Sell GOLD
Entry - 4001.7
Stop - 4011.35
Take - 3985.2
Our Risk - 1%
Start protection of your profits from lower levels
Disclosure: I am part of Trade Nation's Influencer program and receive a monthly fee for using their TradingView charts in my analysis.
❤️ Please, support our work with like & comment! ❤️

GBPCHF Trading Opportunity! SELL!
My dear friends,
GBPCHF looks like it will make a good move, and here are the details:
The market is trading on 1.0605 pivot level.
Bias - Bearish
Technical Indicators: Supper Trend generates a clear short signal while Pivot Point HL is currently determining the overall Bearish trend of the market.
Goal - 1.0571
About Used Indicators:
Pivot points are a great way to identify areas of support and resistance, but they work best when combined with other kinds of technical analysis
Disclosure: I am part of Trade Nation's Influencer program and receive a monthly fee for using their TradingView charts in my analysis.
———————————
WISH YOU ALL LUCK

EURUSD Will Explode! BUY!
My dear friends,
Please, find my technical outlook for EURUSD below:
The instrument tests an important psychological level 1.1515
Bias - Bullish
Technical Indicators: Supper Trend gives a precise Bullish signal, while Pivot Point HL predicts price changes and potential reversals in the market.
Target - 1.1538
Recommended Stop Loss - 1.1503
About Used Indicators:
Super-trend indicator is more useful in trending markets where there are clear uptrends and downtrends in price.
Disclosure: I am part of Trade Nation's Influencer program and receive a monthly fee for using their TradingView charts in my analysis.
———————————
WISH YOU ALL LUCK

USOIL: Short Trading Opportunity
USOIL
- Classic bearish setup
- Our team expects bearish continuation
SUGGESTED TRADE:
Swing Trade
Short USOIL
Entry Point - 60.87
Stop Loss - 61.10
Take Profit - 60.44
Our Risk - 1%
Start protection of your profits from lower levels
Disclosure: I am part of Trade Nation's Influencer program and receive a monthly fee for using their TradingView charts in my analysis.
❤️ Please, support our work with like & comment! ❤️

BTCUSD The Target Is UP! BUY!
My dear subscribers,
This is my opinion on the BTCUSD next move:
The instrument tests an important psychological level 10983
Bias -Bullish
Technical Indicators: Supper Trend gives a precise Bullish signal, while Pivot Point HL predicts price changes and potential reversals in the market.
Target - 11133
About Used Indicators:
On the subsequent day, trading above the pivot point is thought to indicate ongoing bullish sentiment, while trading below the pivot point indicates bearish sentiment.
Disclosure: I am part of Trade Nation's Influencer program and receive a monthly fee for using their TradingView charts in my analysis.
———————————
WISH YOU ALL LUCK

GBPCAD What Next? SELL!
My dear subscribers,
My technical analysis for GBPCAD is below:
The price is coiling around a solid key level - 1.8425
Bias - Bearish
Technical Indicators: Pivot Points High anticipates a potential price reversal.
Super trend shows a clear sell, giving a perfect indicators' convergence.
Goal - 1.8406
My Stop Loss - 1.8436
About Used Indicators:
By the very nature of the supertrend indicator, it offers firm support and resistance levels for traders to enter and exit trades. Additionally, it also provides signals for setting stop losses
Disclosure: I am part of Trade Nation's Influencer program and receive a monthly fee for using their TradingView charts in my analysis.
———————————
WISH YOU ALL LUCK

SILVER My Opinion! SELL!
My dear friends,
Please, find my technical outlook for SILVER below:
The price is coiling around a solid key level - 48.678
Bias - Bearish
Technical Indicators: Pivot Points Low anticipates a potential price reversal.
Super trend shows a clear sell, giving a perfect indicators' convergence.
Goal - 47.933
About Used Indicators:
The pivot point itself is simply the average of the high, low and closing prices from the previous trading day.
Disclosure: I am part of Trade Nation's Influencer program and receive a monthly fee for using their TradingView charts in my analysis.
———————————
WISH YOU ALL LUCK

EURCAD Sellers In Panic! BUY!
My dear followers,
I analysed this chart on EURCAD and concluded the following:
The market is trading on 1.6164 pivot level.
Bias - Bullish
Technical Indicators: Both Super Trend & Pivot HL indicate a highly probable Bullish continuation.
Target - 1.6180
Safe Stop Loss - 1.6154
About Used Indicators:
A super-trend indicator is plotted on either above or below the closing price to signal a buy or sell. The indicator changes color, based on whether or not you should be buying. If the super-trend indicator moves below the closing price, the indicator turns green, and it signals an entry point or points to buy.
Disclosure: I am part of Trade Nation's Influencer program and receive a monthly fee for using their TradingView charts in my analysis.
———————————
WISH YOU ALL LUCK

EURUSD Massive Long! BUY!
My dear friends,
My technical analysis for EURUSD is below:
The market is trading on 1.1536 pivot level.
Bias - Bullish
Technical Indicators: Both Super Trend & Pivot HL indicate a highly probable Bullish continuation.
Target - 1.1577
About Used Indicators:
A pivot point is a technical analysis indicator, or calculations, used to determine the overall trend of the market over different time frames.
Disclosure: I am part of Trade Nation's Influencer program and receive a monthly fee for using their TradingView charts in my analysis.
———————————
WISH YOU ALL LUCK

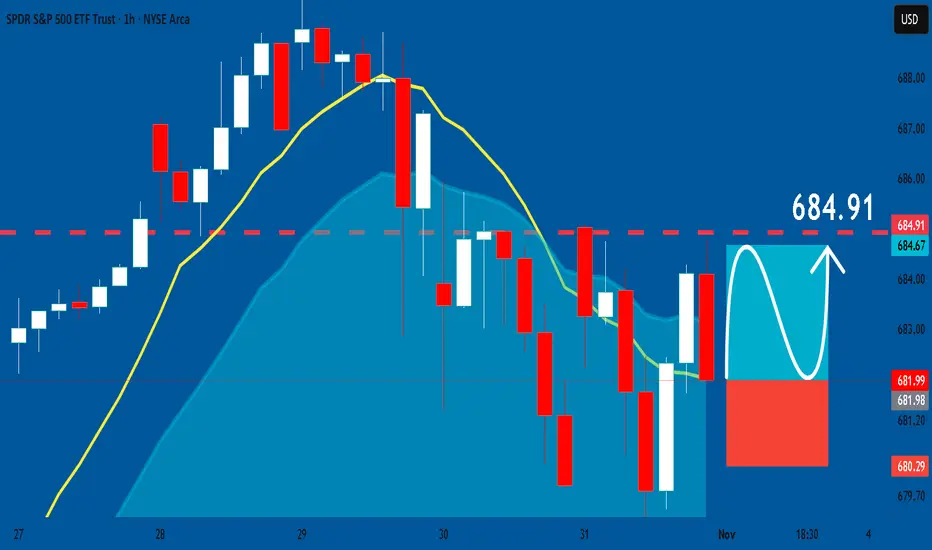
SPY: Long Signal with Entry/SL/TP
SPY
- Classic bullish pattern
- Our team expects retracement
SUGGESTED TRADE:
Swing Trade
Buy SPY
Entry - 681.99
Stop - 680.29
Take - 684.91
Our Risk - 1%
Start protection of your profits from lower levels
Disclosure: I am part of Trade Nation's Influencer program and receive a monthly fee for using their TradingView charts in my analysis.
❤️ Please, support our work with like & comment! ❤️
PENGUUSDT.P - November 1, 2025PENGUUSDT.P is showing a series of higher lows supported by an ascending trendline, indicating sustained bullish pressure. The planned long setup targets the $0.019059 profit level, with a stop placed near $0.0177738 for clear risk management. A break above the breakeven zone would confirm bullish continuation toward the upper resistance, maintaining a constructive bias while price holds above trendline support.

ETHUSDT.P - November 1, 2025ETHUSDT.P is forming a corrective pullback within an intraday bullish structure, maintaining higher lows from the recent swing base. A buy limit order is positioned near $3,850, anticipating continuation toward the $3,891 resistance target. The stop-loss is set around $3,828 to manage downside risk. A rebound from the order zone would confirm bullish momentum resumption, while sustained price action below $3,828 would invalidate the setup.

US100 Technical Analysis! BUY!
My dear friends,
US100 looks like it will make a good move, and here are the details:
The market is trading on 25826 pivot level.
Bias - Bullish
Technical Indicators: Supper Trend generates a clear long signal while Pivot Point HL is currently determining the overall Bullish trend of the market.
Goal - 25982
Recommended Stop Loss - 25749
About Used Indicators:
Pivot points are a great way to identify areas of support and resistance, but they work best when combined with other kinds of technical analysis
Disclosure: I am part of Trade Nation's Influencer program and receive a monthly fee for using their TradingView charts in my analysis.
———————————
WISH YOU ALL LUCK

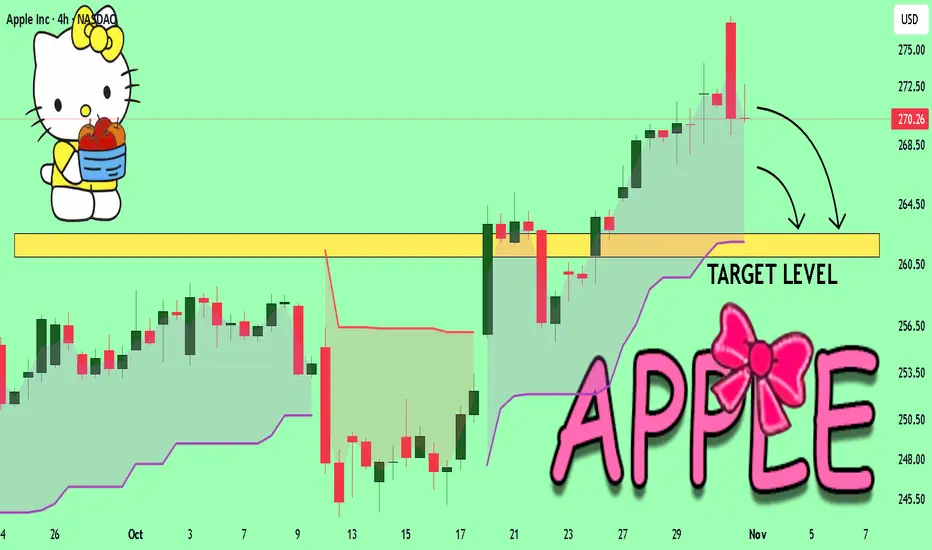
APPLE Set To Fall! SELL!
My dear subscribers,
APPLE looks like it will make a good move, and here are the details:
The market is trading on 270.26 pivot level.
Bias - Bearish
Technical Indicators: Both Super Trend & Pivot HL indicate a highly probable Bearish continuation.
Target - 262.56
About Used Indicators:
The average true range (ATR) plays an important role in 'Supertrend' as the indicator uses ATR to calculate its value. The ATR indicator signals the degree of price volatility.
Disclosure: I am part of Trade Nation's Influencer program and receive a monthly fee for using their TradingView charts in my analysis.
———————————
WISH YOU ALL LUCK