XAUUSD (2H) – Structure, Liquidity & Key Zones | SMC BreakdownMarket Structure:
XAUUSD remains in a short-term bearish structure, with repeated BOS and CHoCH points confirming controlled downside. Recent candles show consistent displacement favoring sellers.
Liquidity Grab:
Price has just taken sell-side liquidity beneath the previous swing lows. This sweep pushes the market into a discount region, a typical reaction for smart-money rebalancing.
Key Demand Zone (Reaction Area):
Price is currently testing the 4,153 – 4,182 demand zone, characterized by:
Prior accumulation block
Imbalance fill
Multiple wick rejections signaling buyer sensitivity
How price reacts here will determine the next structural leg.
Upside Imbalances & Supply Zones:
If bullish confirmation forms inside this demand, the next logical price objectives are:
4,210 – 4,230 intraday supply
4,250 – 4,260 higher-timeframe supply
These zones hold unmitigated inefficiencies from previous impulsive moves.
Outlook (Neutral / Analytical):
Although the short-term trend remains bearish, the price is positioned inside a high-value discount zone where reversals often originate. A confirmed CHoCH upward would indicate potential mitigation.
Failure of this zone, however, may lead to continued bearish expansion.
Signals

CHFJPY Is Going Down! Short!
Here is our detailed technical review for CHFJPY.
Time Frame: 4h
Current Trend: Bearish
Sentiment: Overbought (based on 7-period RSI)
Forecast: Bearish
The market is trading around a solid horizontal structure 193.700.
The above observations make me that the market will inevitably achieve 192.279 level.
P.S
Please, note that an oversold/overbought condition can last for a long time, and therefore being oversold/overbought doesn't mean a price rally will come soon, or at all.
Like and subscribe and comment my ideas if you enjoy them!

GBPCAD Will Fall! Sell!
Take a look at our analysis for GBPCAD.
Time Frame: 1h
Current Trend: Bearish
Sentiment: Overbought (based on 7-period RSI)
Forecast: Bearish
The market is testing a major horizontal structure 1.846.
Taking into consideration the structure & trend analysis, I believe that the market will reach 1.837 level soon.
P.S
The term oversold refers to a condition where an asset has traded lower in price and has the potential for a price bounce.
Overbought refers to market scenarios where the instrument is traded considerably higher than its fair value. Overvaluation is caused by market sentiments when there is positive news.
Like and subscribe and comment my ideas if you enjoy them!

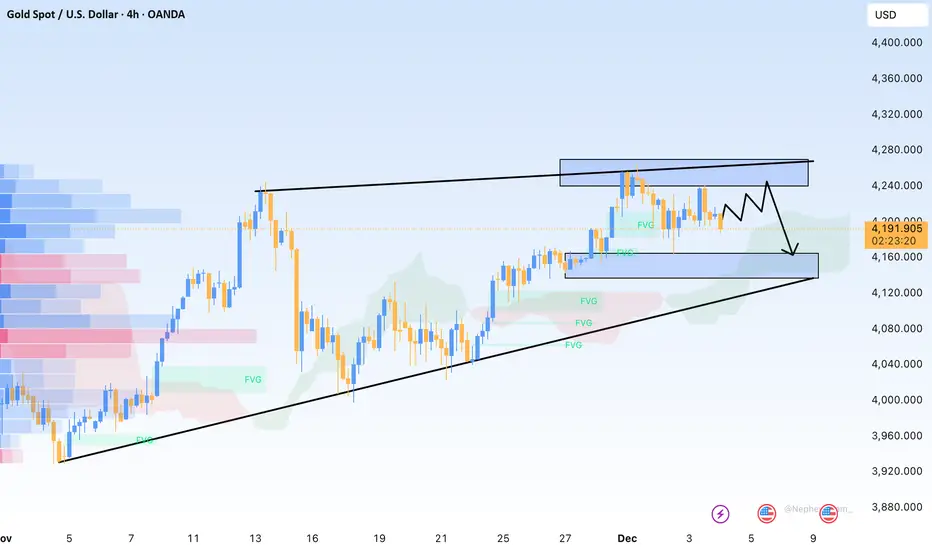
Lingrid | GOLD Ranging Market Remains in PlayOANDA:XAUUSD continues to rotate between well-defined resistance near 4260–4270 and demand around 4160–4170, confirming a sustained sideways environment. Repeated rejections from the upper boundary and controlled pullbacks suggest neither side has full control yet. The recent A-B-C decline fits a corrective move inside the broader consolidation rather than a trend reversal.
Price is now pressing into the lower range support, aligned with channel border and historical reaction zone. A structural hold here could trigger another rotation higher toward 4,212, while sellers are likely to re-engage near the upper band. Until a decisive breakout occurs, fading the range edges offers the higher-probability setups.
➡️ Primary scenario: hold above 4160 → bounce toward 4,212
⚠️ Risk scenario: clean loss of 4160 shifts focus to deeper downside and range breakdown potential
If this idea resonates with you or you have your own opinion, traders, hit the comments. I’m excited to read your thoughts!

Gold Surges Strongly but Fails to Maintain MomentumHello everyone, the recent movement of gold reflects a market heavily influenced by “news-driven support overshadowed by selling pressure.” XAUUSD made an impressive breakout to 4,237 USD/ounce — the highest level in six weeks — as safe-haven flows returned on geopolitical tensions and expectations that the Fed will continue its rate-cut cycle. But only hours later, profit-taking rushed in, sending gold down more than 30 USD and pulling the metal back to the 4,207 USD region this morning.
This weakness mainly stems from improving risk sentiment: US equities rebounded, with the S&P 500 turning green and the Nasdaq pushing higher as tech stocks led the move. Japanese markets also stabilised as bonds cooled, reducing demand for safety. And with the DXY climbing to 99.18, downward pressure on gold became even more evident — a stronger USD rarely favours the precious metal.
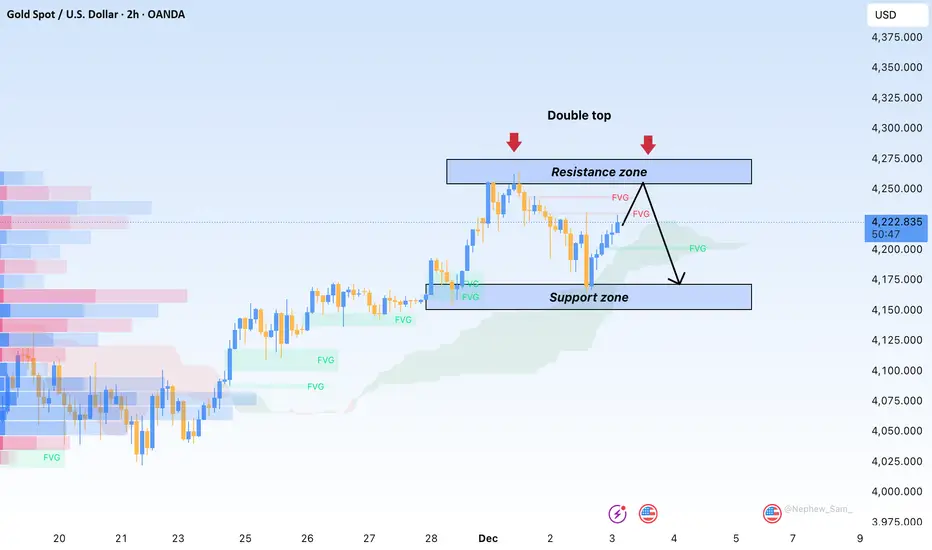
From a technical perspective, the 4,180–4,190 FVG zone helped lift price again after the sharp drop, but gold remains capped beneath the upper FVG resistance. The Ichimoku cloud on the 2H timeframe shows price approaching the Kijun–Senkou intersection — an area that historically attracts selling pressure. This keeps the current price action more aligned with a supply retest rather than the beginning of a genuine bullish trend.
In summary, gold is facing an important test. The 4,235–4,245 region remains the key barrier: a breakout could quickly extend momentum toward 4,260–4,285, while another rejection could push XAUUSD back toward 4,190 to collect liquidity before deciding on its next direction.
Gold Surges on Weak US Data but Momentum FadesHello everyone,
Last night, spot gold on the international market saw a sharp rally of several dozen dollars per ounce after the US released a series of economic reports that came in weaker than expected — particularly labour market data, which strengthened expectations that the Fed may accelerate its rate-cutting path. This is generally positive for gold, as lower interest rates reduce the opportunity cost of holding non-yielding assets.
However, shortly after the breakout, the market witnessed a large wave of profit-taking from institutional investors, causing gold to reverse and drop sharply.
The downside pressure did not come solely from profit-taking; it was also reinforced by a US economic backdrop showing mixed and increasingly unstable signals: weak employment data, slowing growth prospects, and rising expectations of imminent Fed rate cuts. These factors have left capital flows uncertain — torn between holding gold for safety or shifting toward risk assets as US equities recover slightly.
From my perspective, gold is now standing at a critical crossroads:
Weak US data could support another upward leg.
A dovish Fed remains a strong underlying foundation.
But persistent profit-taking may prolong the short-term correction.
Gold’s next move will depend heavily on upcoming US economic releases this week and how the market reacts to shifting expectations around the Fed’s monetary policy.
Wishing everyone a clear-headed and successful trading day ahead!
Gold: Bullish Fundamentals, but Technicals Still Blocking the BOHello everyone, gold continues to gain support from macro data after the ADP report showed a surprise loss of 32,000 private-sector jobs, strengthening expectations of a 0.25% Fed rate cut in the December meeting. This normally benefits gold as USD and yields cool down.
However, the chart still refuses to confirm any breakout. Price remains compressed inside 4,195–4,205 with low volume, sitting right on the Ichimoku cloud. Overhead resistance/FVG 4,215–4,225 and support at 4,180 keep price locked in a tight 4,180–4,225 range.
Ahead of today’s PCE data, gold is likely to stay boxed in until the market receives a stronger catalyst from PCE or the Fed.

Sell Zone Ahead for NZDUSDAfter reaching a low just under the 0.56 figure — just above the 2025 lows — OANDA:NZDUSD finally found support and began reversing to the upside. The pair then broke above the falling-wedge resistance, confirming short-term bullish momentum.
At the time of writing the price is 0.5782, and is approaching the 0.5850 major resistance zone.
Given:
- the significance of this resistance level,
- the prevailing long-term bearish trend,
- and the broader fundamental landscape,
I believe 0.5850 offers an attractive sell zone for a longer-term swing trade.
A rejection from this area could send the pair back toward the lows.

GOLD MARKET ANALYSIS AND COMMENTARY - [Dec 08 - Dec 12]At the beginning of this week, international OANDA:XAUUSD prices fell from 4,264 USD/oz to 4,164 USD/oz, then recovered to 4,259 USD/oz, before declining again and closing the week at 4,198 USD/oz.
International gold prices continue to rise, hovering around 4,200 USD/oz as U.S. inflation remains relatively stable and data shows the country’s labor market is clearly slowing, reigniting expectations of interest rate cuts ahead of the upcoming Federal Reserve meeting. According to CME’s FedWatch tool, the market is once again pricing in nearly a 90% probability that the Fed will continue cutting interest rates at next week’s meeting.
According to many experts, an interest rate cut by the Fed at the upcoming meeting may not significantly affect gold prices next week, as this has already been priced into gold during recent trading sessions. However, if the Fed signals more rate cuts in 2026 compared to the guidance given at its September meeting, it could provide a stronger boost for gold prices.
Besides pressure from lower interest rates, the U.S. is also facing a large budget deficit and massive public debt, meaning it will have to inject a considerable amount of money into the economy. This not only carries the risk of driving inflation higher but also poses potential instability for the U.S. economy in particular and the global economy in general.
Overall, the future trajectory of gold prices will depend on whether the Fed continues to ease monetary policy, or whether macroeconomic conditions—such as weaker growth or rising geopolitical risks—emerge. To reach a new all-time high, gold prices will require a combination of more aggressive Fed rate cuts, continued weakening of the U.S. dollar, stronger safe-haven demand, and especially more robust gold buying from central banks.
In addition to the Fed’s monetary policy meeting, the Reserve Bank of Australia, the Bank of Canada, and the Swiss National Bank will also announce their interest rate decisions. The market expects all three central banks to keep interest rates unchanged.
📌Technically, gold is showing signs of sideways movement with a narrowing range on the H4 chart, the resistance level is established around the 4,264 mark, breaking through this level will create momentum for gold prices to find the 4,380 mark. In case gold prices trade below the 4,200 mark, next week the price may only fluctuate in the range of 4,100-4,265 USD/oz.
SELL XAUUSD PRICE 4222 - 4220⚡️
↠↠ Stop Loss 4226
BUY XAUUSD PRICE 4168 - 4170⚡️
↠↠ Stop Loss 4164

Gold Shows Cracks: Is the 4180 Support About to Give In?Yesterday, Gold stayed between the boundaries of the 4180–4250 range.
Although the session started with a bullish tone, buyers failed twice: first, to push price toward the upper resistance, and later, after touching support, to reclaim the 4200 zone overnight.
This inability to regain control is a clear sign of weakness.
Key Question
Has Gold finished its consolidation?
Why a continuation lower is likely?
- The market has been distributing for more than a week inside this 4180–4250 corridor.
- Failed bullish attempts reveal vanishing demand.
- Support at 4180 has become increasingly vulnerable.
If support breaks with momentum, we could see downside acceleration toward the 4100 zone.
Trading Plan
For now, the bias is bearish as long as the price stays below 4220.
Only:
- A move above 4220 would shift Gold back into a range-trading environment.
- And stabilization above 4250 would bring bulls back into the game.

BTCUSDT.P - December 9, 2025Price is compressing under a descending trendline after a prior upswing, with the market holding above a key support band around 86,000–87,000 that defines the proposed long entry area. A clean breakout and acceptance above the descending trendline and overhead resistance near 94,500 would signal bullish trend continuation toward the 105,000–106,000 profit zone. Failure to hold the 86,000–87,000 support and a decisive break below would invalidate the long bias and open downside risk toward the lower support cluster around 77,000–78,000.

Gold Supported by the Fed but Still Trapped Near 4,200 USDGold opened around 4,209 USD/ounce — about 10 USD higher than last weekend — mainly thanks to continued weakness in the US Dollar as the DXY broke below 99 and slipped to 98.9. At the same time, markets are broadly aligned with expectations that the Fed will cut another 0.25% at the 10 December meeting, creating a favourable backdrop for gold as both yields and USD remain depressed. From a macro perspective, gold is clearly being “supported,” but on the 2-hour chart this still looks like a rebound within the broader 4,200 consolidation box — not yet enough to confirm a new bullish leg.
Structurally, the medium-term trend remains upward, with gold forming higher lows since late November. However, what stands out is the inability of recent highs in the 4,245–4,250 region to surpass previous peaks. This signals weakening buying pressure as price approaches the upper range, locking the market inside the 4,185–4,230 zone — essentially a tight tug-of-war between buyers and sellers. While the macro trend remains bullish, the short-term structure is leaning toward a sideways–corrective mode, reflecting a market waiting for PCE data and the upcoming Fed meeting.

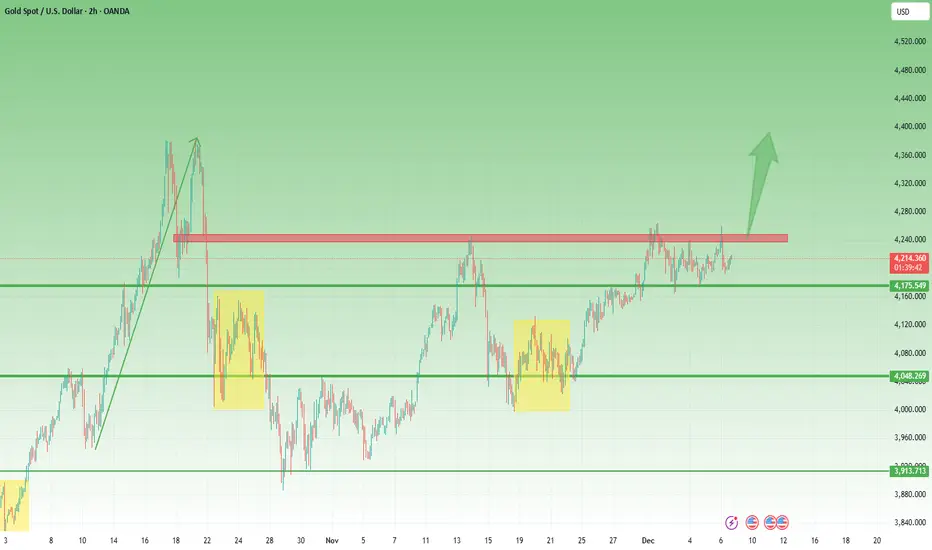
XAUUSD: The Calm Before the BreakoutOANDA:XAUUSD Over the past few sessions the price has shown remarkable strength, yet the market has recently slowed and slipped into a sideways phase. This type of behavior is common after a strong rally and does not necessarily indicate weakness. It is more of a natural pause, allowing buyers to regroup while maintaining control of the overall trend.
The decisive moment will come if the price breaks convincingly above the upper boundary of this consolidation. That would confirm that bullish momentum is returning and that the market is preparing to move toward new highs.
This is the scenario I am watching: a calm accumulation phase, a temporary slowdown, and then a renewed move higher once consolidation has run its course. At this stage, the breakout appears less like a possibility and more like something that is gradually taking shape.

WTI DEMAND LEVEL BELOW|LONG|
✅WTI OIL is retracing sharply toward a demand zone after drawing sell-side liquidity beneath short-term lows, setting up an ICT-style bullish reaction point. If demand holds, price is poised to rebalance upward into the inefficiency near the target zone. Time Frame 2H.
LONG🚀
✅Like and subscribe to never miss a new idea!✅

NVIDIA This is how it can reach $100 and the Supports involved.NVIDIA Corporation (NVDA) had a strong red 1M candle last month, the first one after a rally of 7 straight green months. This is not the first time we present you this 12-year Channel Up, in fact we used this in late October to give a sell signal.
The reason is that Nvidia almost reached the top of that pattern, a technical Higher High, successive if you count the late 2024 one. Such Double Tops have been previously consistent with the start of strong corrections (Bearish Legs) which in both cases (2018 and 2022) bottomed on the 1W MA200 (orange trend-line).
The key element that we added on the chart this time is the (green) Support Zone, which stemmed every time from the last consolidation (blue circle) before the Top.
It is no surprise that this time it also falls on the 1W MA200 and a potential contact with the price towards Q3 2026 and beyond. Even then, it will still be above the 0.382 Fibonacci retracement level as in December 2018 and quite close to the bottom of the Channel Up for the first time since October 2022.
Our long-term Target and thus next long-term Buy Signal, remains $100.
---
** Please LIKE 👍, FOLLOW ✅, SHARE 🙌 and COMMENT ✍ if you enjoy this idea! Also share your ideas and charts in the comments section below! This is best way to keep it relevant, support us, keep the content here free and allow the idea to reach as many people as possible. **
---
💸💸💸💸💸💸
👇 👇 👇 👇 👇 👇

GBPJPY WILL KEEP GROWING|LONG|
✅GBPJPY has broken cleanly above the demand zone after sweeping internal sell-side liquidity, showing strong displacement and an ICT-style shift in order-flow toward higher buy-side objectives. Price is now drawing toward the next liquidity pocket above. Time Frame 3H.
LONG🚀
✅Like and subscribe to never miss a new idea!✅

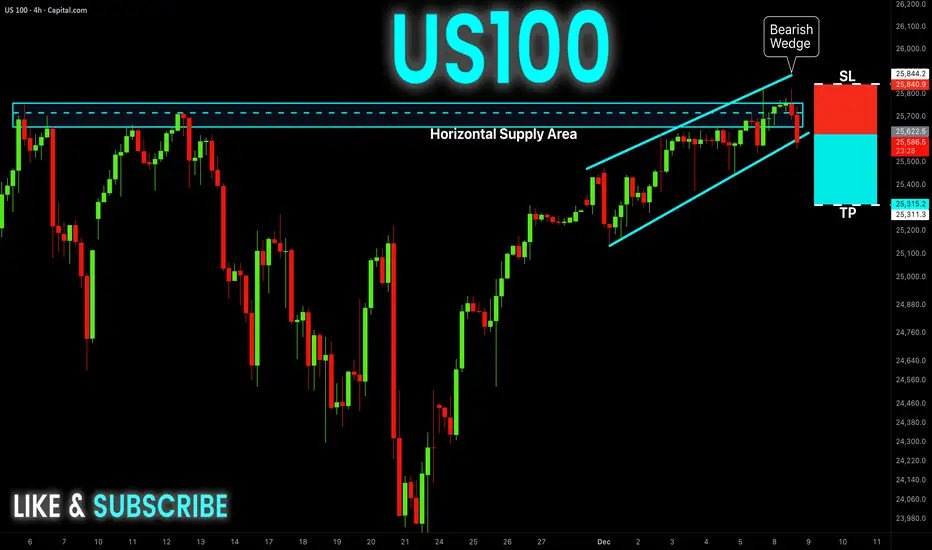
US100 Free Signal! Sell!
Hello,Traders!
US100 has rejected a major supply zone while breaking down from a bearish wedge, sweeping buy-side liquidity before shifting order-flow bearish. This SMC structure signals distribution at premium and a move toward discount levels below.
--------------------
Stop Loss: 25840
Take Profit: 25315
Entry: 25622
Time Frame: 4H
--------------------
Sell!
Comment and subscribe to help us grow!
Check out other forecasts below too!
Disclosure: I am part of Trade Nation's Influencer program and receive a monthly fee for using their TradingView charts in my analysis.
XAUUSD 4H MA50 break signals lower prices.Gold (XAUUSD) has been trading within a Channel Up in the past 1.5 month. Within this pattern, every time the 4H MA50 (blue trend-line) broke downwards, the price tested the Higher Lows trend-line.
As a result, we expect Gold to reach 4115 next, which will be an interesting cluster as marginally below will be the Support Zone o the 4H MA200 (orange trend-line) and more importantly the 1D MA50 (red trend-line). That will most likely decide the long-term trend.
---
** Please LIKE 👍, FOLLOW ✅, SHARE 🙌 and COMMENT ✍ if you enjoy this idea! Also share your ideas and charts in the comments section below! This is best way to keep it relevant, support us, keep the content here free and allow the idea to reach as many people as possible. **
---
💸💸💸💸💸💸
👇 👇 👇 👇 👇 👇

CRUDE OIL Bearish Breakout! Sell!
Hello,Traders!
CRUDE OIL has broken beneath the rising trendline and retested a supply cluster, confirming an SMC bearish shift as buy-side liquidity was swept before displacement pushed price lower. A continuation toward the target discount zone remains likely. Time Frame 2H.
Sell!
Comment and subscribe to help us grow!
Check out other forecasts below too!
Disclosure: I am part of Trade Nation's Influencer program and receive a monthly fee for using their TradingView charts in my analysis.

GBPCHF FREE SIGNAL|SHORT|
✅GBPCHF price has tapped into a higher-timeframe supply zone after running buy-side liquidity above recent swing highs, creating an ICT bearish rejection that shifts order-flow toward discount levels and favors a corrective move lower.
—————————
Entry: 1.0754
Stop Loss: 1.0782
Take Profit: 1.0710
Time Frame: 6H
—————————
SHORT🔥
✅Like and subscribe to never miss a new idea!✅

EURUSD Channel Up starting its new Bearish Leg.The EURUSD pair has been trading within a 1-month Channel Up and has already completed two straight red 1D candles. Last time this happened, the pattern had technically started its previous Bearish Leg.
Since there is a high degree of symmetry between the structural Legs of this pattern, we expect the current one to repeat the former -1.40% decline and target 1.15250.
---
** Please LIKE 👍, FOLLOW ✅, SHARE 🙌 and COMMENT ✍ if you enjoy this idea! Also share your ideas and charts in the comments section below! This is best way to keep it relevant, support us, keep the content here free and allow the idea to reach as many people as possible. **
---
💸💸💸💸💸💸
👇 👇 👇 👇 👇 👇

EUR-AUD Free Signal! Sell!
Hello,Traders!
EURAUD has broken out beneath the horizontal supply area after distributing at premium, sweeping buy-side liquidity and shifting order-flow decisively bearish. This SMC breakout favors continuation lower toward the next discount zone.
--------------------
Stop Loss: 1.7602
Take Profit: 1.7510
Entry: 1.7559
Time Frame: 6H
--------------------
Sell!
Comment and subscribe to help us grow!
Check out other forecasts below too!
Disclosure: I am part of Trade Nation's Influencer program and receive a monthly fee for using their TradingView charts in my analysis.

4250–4180: The Box Controlling GoldDespite a week filled with major fundamental releases, gold spent the entire period trapped inside a 4250–4180 range.
Even Friday’s strong early rally into 4250 failed to hold, with the daily close producing a sharp sell-off that left traders without a clear directional bias.
Today’s Asian session opened with renewed buying interest, lifting price back toward 4220, the midpoint of the range. But without a decisive breakout, the medium-term direction remains unclear.
Technically, both the medium-term and long-term trends are still bullish. However, as long as price remains locked inside this range, taking trades carries elevated risk.
What I want to see next:
Bullish scenario:
A fresh attempt to break above resistance, followed by either a clean breakout or a tight consolidation right below it — a classic pressure-building structure.
Bearish scenario:
A breakdown below 4175–4180, which could open the door for a move back toward 4100 or even lower.
Until we get clarity, I remain on the sidelines.