AUDCHF CLOSING THE GAP|SHORT|
✅AUDCHF After engineering liquidity below the previous low, price is now retracing into the imbalance created during the impulsive move up. The market is likely to close the fair value gap and resume bearish order flow. Time Frame 4H.
SHORT🔥
✅Like and subscribe to never miss a new idea!✅
Signals

EUR-GBP Risky Long! Buy!
Hello,Traders!
EURGBP tapped into a demand level after clearing sell-side liquidity. The market structure shows a clean displacement to the upside, signaling bullish order flow as price seeks to rebalance inefficiency above. Time Frame 3H.
Buy!
Comment and subscribe to help us grow!
Check out other forecasts below too!
Disclosure: I am part of Trade Nation's Influencer program and receive a monthly fee for using their TradingView charts in my analysis.

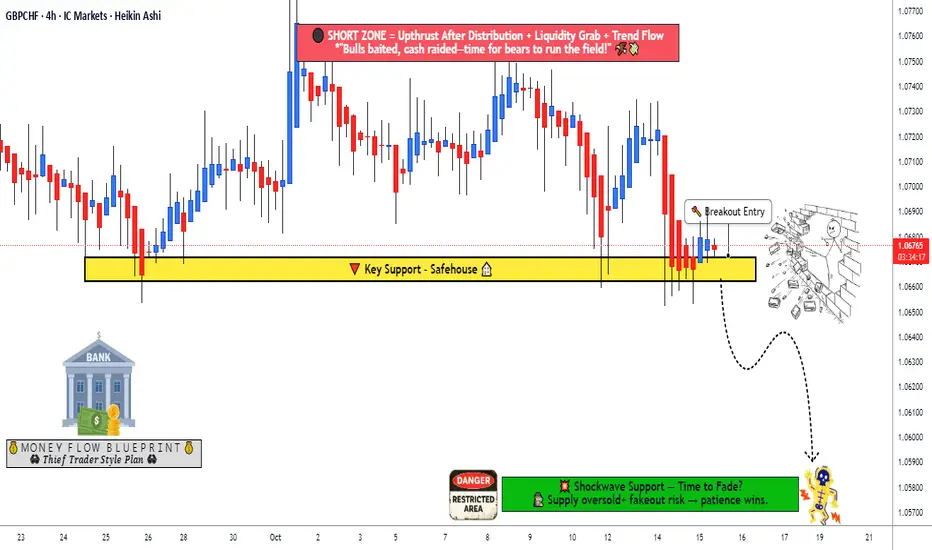
GBP/CHF Breakdown: Is the Support Zone About to Fail?🎯 GBP/CHF: The Swiss Heist Setup | Bears Loading Up 🐻
📊 Market Overview
Pair: GBP/CHF (British Pound vs Swiss Franc)
Trading Style: Swing/Day Trade
Bias: Bearish 🔴
Current Level: Watching 1.06600 support zone
🎪 The Setup (AKA "The Swiss Bank Job")
📍 Entry Zone: 1.06600
Wait for a clean support zone breakout before entering. No jumping the gun—let the market show its hand first! 🃏
🛑 Stop Loss: 1.07100
Disclaimer: This is MY stop loss placement. You're the captain of your own ship! 🚢 Adjust according to your risk tolerance and account size. Trade at your own risk.
🎯 Target: 1.05800
This level features strong support confluence + potential oversold conditions + liquidity traps. Consider taking profits in stages rather than going all-in for the full ride. Lock in gains and protect your capital! 💰
🔍 Technical Analysis Breakdown
Why Bearish?
Support zone at 1.06600 showing weakness
Looking for breakout confirmation before entry
Target area at 1.05800 offers strong support confluence
Potential oversold bounce zone ahead—don't get caught in the trap!
Risk Management Notes:
This is a high-probability setup, but the market always has the final say
Use proper position sizing (never risk more than 1-2% per trade)
Consider partial profit-taking at intermediate levels
Trail your stop loss as price moves in your favor
💱 Related Pairs to Watch (Correlation Play)
Keep an eye on these correlated instruments:
🇬🇧 GBP Pairs:
GBP/USD - If Cable is weak, it strengthens the GBP/CHF bear case
EUR/GBP - Watch for Euro strength against Pound
🇨🇭 CHF Pairs:
USD/CHF - Swiss Franc strength indicator
EUR/CHF - Measures CHF demand vs Euro
📈 Risk-On/Risk-Off Indicators:
SPX500 (
SPX
) - S&P 500 Index: Risk sentiment gauge
VIX (
VIX
) - Volatility Index: Fear gauge (high VIX = CHF strength)
Gold (
XAUUSD
) - Safe haven correlation with CHF
💡 Correlation Note: CHF is a safe-haven currency. During risk-off events, CHF typically strengthens. Watch US Dollar strength via DXY (
DXY
) as it can influence GBP/CHF direction.
⚡ Key Points & Strategy
✅ Wait for breakout confirmation below 1.06600
✅ Enter with proper risk management (stop loss at 1.07100)
✅ Target 1.05800 but be ready for partial exits
✅ Monitor CHF safe-haven flows and GBP weakness
✅ Watch for reversal signs near target zone
🎬 The Fine Print
⚠️ DISCLAIMER: This is a "thief-style" trading strategy shared purely for educational and entertainment purposes. This is NOT financial advice. Trading forex carries substantial risk of loss and is not suitable for all investors. Past performance is not indicative of future results. Always conduct your own analysis and trade at your own risk. The stop loss and take profit levels mentioned are based on MY personal risk management—you should adjust these according to YOUR risk tolerance, account size, and trading plan.
✨ If you find value in my analysis, a 👍 and 🚀 boost is much appreciated — it helps me share more setups with the community!
#GBPCHF #ForexTrading #TechnicalAnalysis #SwingTrading #DayTrading #BearishSetup #ForexSignals #PriceAction #SupportAndResistance #RiskManagement #CHF #GBP #SafeHaven #ForexStrategy #TradingIdeas #ForexCommunity
Remember: The market is the ultimate teacher. Trade smart, stay disciplined, and protect your capital! 🎓💪
Lingrid | SUIUSDT Bearish Trend Shorting OpportunityBINANCE:SUIUSDT is rebounding from the channel’s lower boundary after forming a solid bottom near the support level. The structure still respects a broad descending channel while holding above a minor range base. A break above 2.71 would confirm short-term continuation toward mid-range resistance as buyers regain momentum. Price action suggests a corrective rebound phase within the prevailing bearish macro channel.
⚠️ Risks:
Failure to hold the current support zone may renew downside pressure.
Strong USD data or hawkish Fed comments could cap recovery momentum.
Channel resistance near 2.7 remains a potential rejection point before breakout confirmation.
If this idea resonates with you or you have your own opinion, traders, hit the comments. I’m excited to read your thoughts!

ETHUSD: Next Move Is Up! Long!
My dear friends,
Today we will analyse ETHUSD together☺️
The market is at an inflection zone and price has now reached an area around 4,063.2 where previous reversals or breakouts have occurred.And a price reaction that we are seeing on multiple timeframes here could signal the next move up so we can enter on confirmation, and target the next key level of 4,103.7.Stop-loss is recommended beyond the inflection zone.
❤️Sending you lots of Love and Hugs❤️

BTCUSD: Strong Bearish Sentiment! Short!
My dear friends,
Today we will analyse BTCUSD together☺️
The price is near a wide key level
and the pair is approaching a significant decision level of 113,501.80 Therefore, a strong bearish reaction here could determine the next move down.We will watch for a confirmation candle, and then target the next key level of 113,086.16.Recommend Stop-loss is beyond the current level.
❤️Sending you lots of Love and Hugs❤️

NZD-CHF Local Short! Sell!
Hello,Traders!
NZDCHF tapped into a horizontal supply area, showing signs of rejection after a liquidity grab above previous highs. Smart Money likely distributing before a move toward the next target zone.Time Frame 3H.
Sell!
Comment and subscribe to help us grow!
Check out other forecasts below too!
Disclosure: I am part of Trade Nation's Influencer program and receive a monthly fee for using their TradingView charts in my analysis.

NZDJPY GROWTH AHEAD|LONG|
✅NZDJPY has reacted from a clean demand level after engineering sell-side liquidity beneath equal lows. Market structure shifted bullish with displacement confirming a potential continuation phase. Time Frame 5H.
LONG🚀
✅Like and subscribe to never miss a new idea!✅

TRUMPUSDT.P - October 24, 2025Based on the chart's current upward trendline and consolidation near $5.911, a long entry targeting the $6.111 resistance is suggested. This setup carries significant risk, plan your trades accordingly.

SOLUSDT.P - October 26, 2025Based on the 4-hour chart, the price appears to be consolidating within a triangle after a sharp decline. A long bias is supported by the potential for a breakout above the upper trendline.

NZDCHF MOVE DOWN AHEAD|SHORT|
✅NZDCHF is retracing toward a premium supply level where institutional order flow likely shifts bearish. The market engineered buy-side liquidity to mitigate imbalance before continuation lower toward the next draw on liquidity. Time Frame 5H
SHORT🔥
✅Like and subscribe to never miss a new idea!✅

NZD-JPY Will Go Up! Buy!
Hello,Traders!
NZDJPY respected the horizontal demand area, confirming bullish order flow with a clean break of structure. Liquidity beneath the last swing low has been taken, suggesting continuation higher toward the next target level.Time Frame: 3H
Buy!
Comment and subscribe to help us grow!
Check out other forecasts below too!
Disclosure: I am part of Trade Nation's Influencer program and receive a monthly fee for using their TradingView charts in my analysis.

CADJPY FREE SIGNAL|SHORT|
✅CADJPY has tapped into a premium supply zone after sweeping liquidity above previous highs. Smart money shows distribution signs with bearish displacement underway — targeting inefficiency below.
—————————
Entry: 109.230
Stop Loss: 109.610
Take Profit: 108.600
Time Frame: 2H
—————————
SHORT🔥
✅Like and subscribe to never miss a new idea!✅

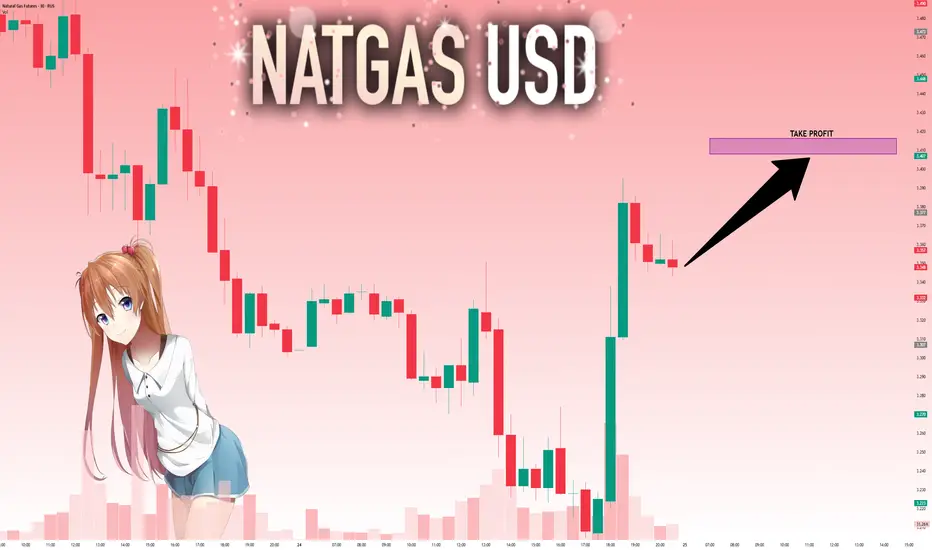
NG1!: Next Move Is Up! Long!
My dear friends,
Today we will analyse NG1! together☺️
The market is at an inflection zone and price has now reached an area around 3.348 where previous reversals or breakouts have occurred.And a price reaction that we are seeing on multiple timeframes here could signal the next move up so we can enter on confirmation, and target the next key level of 3.408.Stop-loss is recommended beyond the inflection zone.
❤️Sending you lots of Love and Hugs❤️
NI225: Target Is Up! Long!
My dear friends,
Today we will analyse NI225 together☺️
The price is near a wide key level
and the pair is approaching a significant decision level of 49,299.59 Therefore, a strong bullish reaction here could determine the next move up.We will watch for a confirmation candle, and then target the next key level of 49,674.26.Recommend Stop-loss is beyond the current level.
❤️Sending you lots of Love and Hugs❤️

GODSUSDT.P - October 25, 2025GODSUSDT.P is displaying early bullish momentum with potential upside toward the 0.1221 resistance, indicating a long bias. However, this is a high-risk setup as the token shows very volatile movement—it’s advisable to take partial profit and move the stop level to breakeven once price reaches the 0.11070 area.

XRPUSDT.P - October 25, 2025XRPUSDT is showing bullish momentum with a potential continuation toward the 3.1327 resistance zone, making this a medium-risk long setup. Move the stop level to 2.7152, and while it’s recommended to take full profit at 3.1327 for a better RRR, traders may choose to take partial profit and move the stop to breakeven or simply adjust the stop to breakeven within that range.

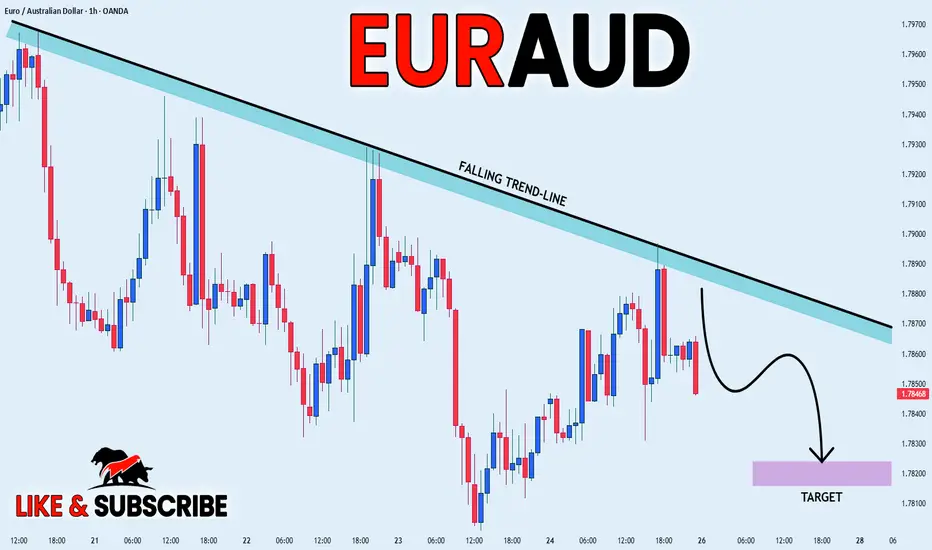
EURAUD WILL GO DOWN|SHORT|
✅EURAUD is respecting the falling trendline, showing rejection from premium levels. Liquidity has been collected above the recent swing, suggesting smart money may aim for the downside to rebalance inefficiency toward the target zone. Time Frame 2H.
SHORT🔥
✅Like and subscribe to never miss a new idea!✅
EUR-CHF Free Signal! Sell!
Hello,Traders!
EURCHF SMC based signal. Price tapped into a key supply zone, showing clear rejection with wicks and momentum shift to the downside. Expecting a short-term retracement toward the target zone below.
-------------------
Stop Loss: 0.9259
Take Profit: 0.9243
Entry: 0.9252
Time Frame: 3H
-------------------
Sell!
Comment and subscribe to help us grow!
Check out other forecasts below too!
Disclosure: I am part of Trade Nation's Influencer program and receive a monthly fee for using their TradingView charts in my analysis.

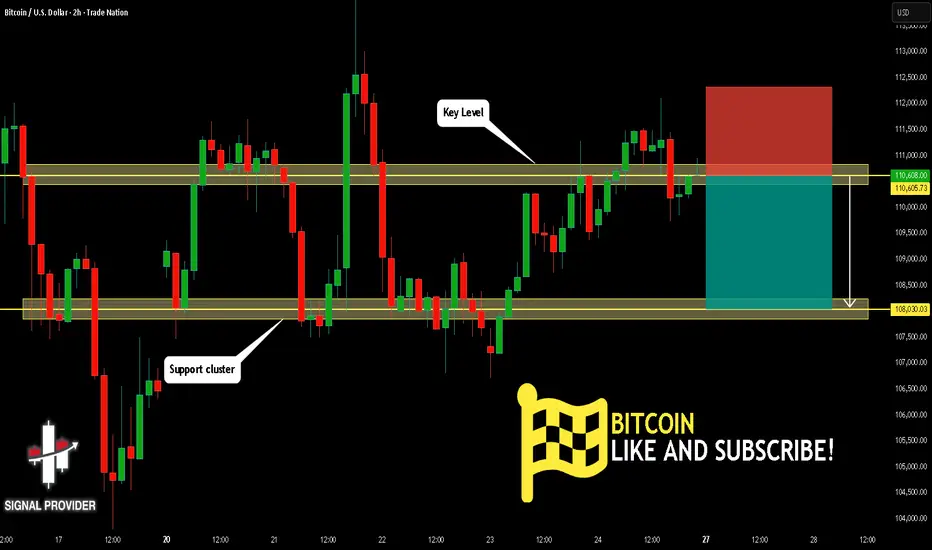
BITCOIN Will Go Lower! Sell!
Here is our detailed technical review for BITCOIN.
Time Frame: 2h
Current Trend: Bearish
Sentiment: Overbought (based on 7-period RSI)
Forecast: Bearish
The market is testing a major horizontal structure 110,605.73.
Taking into consideration the structure & trend analysis, I believe that the market will reach 108,030.03 level soon.
P.S
We determine oversold/overbought condition with RSI indicator.
When it drops below 30 - the market is considered to be oversold.
When it bounces above 70 - the market is considered to be overbought.
Like and subscribe and comment my ideas if you enjoy them!
CADJPY Will Go Up! Buy!
Take a look at our analysis for CADJPY.
Time Frame: 1D
Current Trend: Bullish
Sentiment: Oversold (based on 7-period RSI)
Forecast: Bullish
The market is approaching a key horizontal level 109.219.
Considering the today's price action, probabilities will be high to see a movement to 111.127.
P.S
Overbought describes a period of time where there has been a significant and consistent upward move in price over a period of time without much pullback.
Like and subscribe and comment my ideas if you enjoy them!

GBPJPY Will Move Higher! Long!
Please, check our technical outlook for GBPJPY.
Time Frame: 1D
Current Trend: Bullish
Sentiment: Oversold (based on 7-period RSI)
Forecast: Bullish
The market is approaching a significant support area 203.425.
The underlined horizontal cluster clearly indicates a highly probable bullish movement with target 206.227 level.
P.S
Please, note that an oversold/overbought condition can last for a long time, and therefore being oversold/overbought doesn't mean a price rally will come soon, or at all.
Like and subscribe and comment my ideas if you enjoy them!

EUR/USD: Technical Rebound in Progress — Watch 1.1550🔹 COT (Commitment of Traders)
Euro (EUR)
Non-commercial longs: 252,472 (−789)
Non-commercial shorts: 138,127 (+2,625)
→ Institutions are reducing long exposure and adding shorts, suggesting a loss of bullish momentum on the euro.
US Dollar Index (DXY)
Non-commercial longs: 14,032 (+1,541)
Non-commercial shorts: 24,376 (−1,009)
→ Institutions are adding longs and cutting shorts, reflecting growing confidence in the USD.
Institutional flows confirm a bearish bias on EUR/USD, with strengthening USD sentiment and mild euro weakness.
🔹 FX Sentiment (Retail Positioning)
50% short / 50% long
Market sentiment is perfectly balanced — a neutral retail positioning indicating no clear contrarian signal, consistent with a possible short-term consolidation phase.
🔹 Seasonality
Historically, October tends to be neutral to slightly negative for EUR/USD (−0.2% to −0.5% on 10–20-year averages).
Shorter cycles (2–5 years) show minor positive returns, suggesting that any rebound may be temporary within a broader bearish structure.
Slight downside bias, with potential for short-term corrective upside.
🔹 Price Action
EUR/USD recently reacted from the 1.1530–1.1550 demand zone, showing signs of short-term accumulation.
The descending channel has been broken to the upside, and price is now retesting the previous mid-range support (1.1600–1.1620).
RSI remains neutral but shows a gradual bullish divergence building at the lows.
🎯 Main Scenario:
If 1.1600–1.1620 holds as support, a short-term bullish leg toward 1.1710–1.1780 (former supply area) is possible.
Invalidation: daily close below 1.1550, which would reopen downside toward 1.1500.
