EURUSD CORRECTION AHEAD|SHORT|
✅EURUSD retraced into a premium supply level after a clear bearish displacement, mitigating an order block and collecting liquidity above short-term highs. Expect continuation toward the downside. Time Frame 3H.
SHORT🔥
✅Like and subscribe to never miss a new idea!✅
Signals

GOLD Local Short! Sell!
Hello,Traders!
GOLD tapped into a premium supply zone, engineering liquidity above equal highs before showing bearish displacement. Expect a continuation move toward the downside imbalance. Time Frame 5H.
Sell!
Comment and subscribe to help us grow!
Check out other forecasts below too!
Disclosure: I am part of Trade Nation's Influencer program and receive a monthly fee for using their TradingView charts in my analysis.

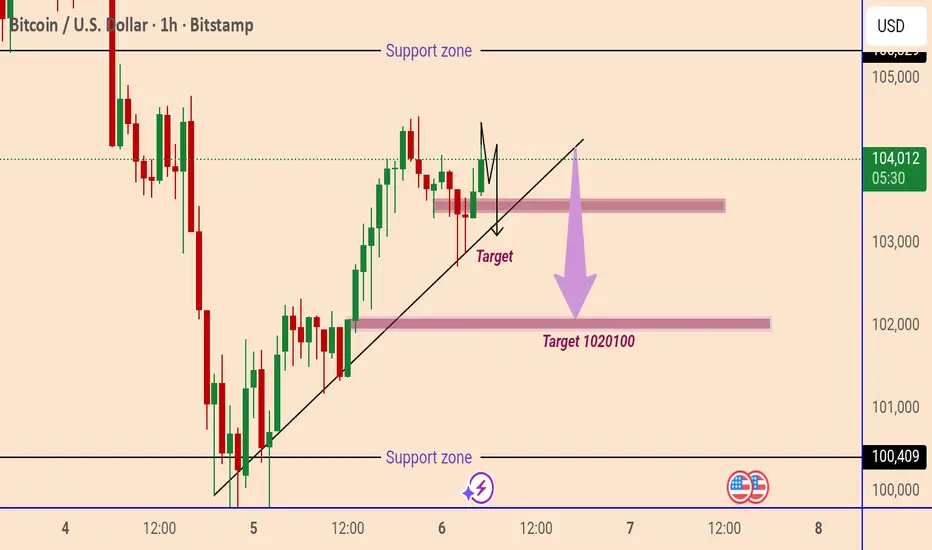
Bitcoin Trendline Breakdown SetupBitcoin (BTC/USD) is trading around $104,010, showing a mild bullish correction. However, the chart suggests a potential downward move if price breaks below the trendline support. The next targets are around $103,000 and $102,000–$102,100, with a major support zone near $100,400.
MICROSOFT may fall to $450 if this Support breaks.Microsoft (MSFT) has been trading within a 4-year Channel Up since the November 22 2021 High. Last week it got rejected exactly on its July 28 2025 Resistance (which was a Higher High for the Channel Up) and formed a Double Top, which continues to decline this week as well.
With its 1W RSI also displaying a Bearish Divergence (since the July High) similar to past sell alerts within this Channel Up, it is possible for the stock to correct to at least $450, which represents the 0.5 Fibonacci level where the previous July 2024 - March 2025 correction found Support. That was just above the 1W MA200 (orange trend-line), which also priced the bottom of the October 31 2022 Low but that correction was -38.69%, considerably stronger that -26.54%, which is also plausible if 2026 is a Bear Cycle.
The level that has confirmed those two correction Sell Signals within this Channel Up has been the 1D MA150 (red trend-line). On both occasions, Microsoft closed a 1W candle below the 1D MA150 and confirmed the correction, something that hasn't happened at any other time during these 4 years.
-------------------------------------------------------------------------------
** Please LIKE 👍, FOLLOW ✅, SHARE 🙌 and COMMENT ✍ if you enjoy this idea! Also share your ideas and charts in the comments section below! This is best way to keep it relevant, support us, keep the content here free and allow the idea to reach as many people as possible. **
-------------------------------------------------------------------------------
💸💸💸💸💸💸
👇 👇 👇 👇 👇 👇

USDCHF Perhaps the best buy opportunity in the market!The USDCHF pair is staging a strong bullish reversal following last week's 1W candle closing above the 1D MA100 (red trend-line). The reason is that every time in the past 3 years (since November 07 2022) the price broke and closed a week above that level, the pair rallied towards the 1W MA200 (orange trend-line).
This time is doing so also at the back of a huge 1W RSI Bullish Divergence of Higher Lows against the prices Lower Lows since April 2025.
We estimate that contact with the 1W MA200 can be achieved around $0.8800 and that is our long-term Target for USDCHF.
-------------------------------------------------------------------------------
** Please LIKE 👍, FOLLOW ✅, SHARE 🙌 and COMMENT ✍ if you enjoy this idea! Also share your ideas and charts in the comments section below! This is best way to keep it relevant, support us, keep the content here free and allow the idea to reach as many people as possible. **
-------------------------------------------------------------------------------
💸💸💸💸💸💸
👇 👇 👇 👇 👇 👇

BITCOIN Will Go Lower! Sell!
Please, check our technical outlook for BITCOIN.
Time Frame: 5h
Current Trend: Bearish
Sentiment: Overbought (based on 7-period RSI)
Forecast: Bearish
The market is trading around a solid horizontal structure 102,798.30.
The above observations make me that the market will inevitably achieve 97,930.04 level.
P.S
Overbought describes a period of time where there has been a significant and consistent upward move in price over a period of time without much pullback.
Like and subscribe and comment my ideas if you enjoy them!

EURUSD Will Go Down! Short!
Here is our detailed technical review for EURUSD.
Time Frame: 1h
Current Trend: Bearish
Sentiment: Overbought (based on 7-period RSI)
Forecast: Bearish
The market is testing a major horizontal structure 1.151.
Taking into consideration the structure & trend analysis, I believe that the market will reach 1.149 level soon.
P.S
Please, note that an oversold/overbought condition can last for a long time, and therefore being oversold/overbought doesn't mean a price rally will come soon, or at all.
Like and subscribe and comment my ideas if you enjoy them!

GBPJPY Will Move Lower! Sell!
Take a look at our analysis for GBPJPY.
Time Frame: 1D
Current Trend: Bearish
Sentiment: Overbought (based on 7-period RSI)
Forecast: Bearish
The market is approaching a key horizontal level 201.166.
Considering the today's price action, probabilities will be high to see a movement to 197.887.
P.S
The term oversold refers to a condition where an asset has traded lower in price and has the potential for a price bounce.
Overbought refers to market scenarios where the instrument is traded considerably higher than its fair value. Overvaluation is caused by market sentiments when there is positive news.
Like and subscribe and comment my ideas if you enjoy them!

GBPCHF Is Bullish! Long!
Please, check our technical outlook for GBPCHF.
Time Frame: 1h
Current Trend: Bullish
Sentiment: Oversold (based on 7-period RSI)
Forecast: Bullish
The market is approaching a significant support area 1.058.
The underlined horizontal cluster clearly indicates a highly probable bullish movement with target 1.061 level.
P.S
We determine oversold/overbought condition with RSI indicator.
When it drops below 30 - the market is considered to be oversold.
When it bounces above 70 - the market is considered to be overbought.
Like and subscribe and comment my ideas if you enjoy them!

ETHEREUM hit its 1W MA50. Can this save the Bull market?Ethereum (ETHUSD) just hit its 1W MA50 (blue trend-line) for the first time in 4 months since it broke above it on the week of July 07 2025. This pattern looks very similar to the 1W tests after the March 11 2025 and November 08 2021 Highs (latter as also a Cycle Top).
In both cases the 1W MA50 failed to hold as a Support (did also the same on the Jan 13 2025 test) and the price declined further completing -48% and -52% total drops respectively.
As a result, there are high probabilities currently for ETH to extend its decline by at least -48%, in which case it may reach $2600.
Based on the 1W RSI, the most probably level for a bounce is the 38.50 (RSI) level, which is the Symmetrical Support that initiated the rebounds of September 02 2024 and January 24 2022. The September 18 2023 and November 07 2022 Lows also came very close to it and rebounded.
-------------------------------------------------------------------------------
** Please LIKE 👍, FOLLOW ✅, SHARE 🙌 and COMMENT ✍ if you enjoy this idea! Also share your ideas and charts in the comments section below! This is best way to keep it relevant, support us, keep the content here free and allow the idea to reach as many people as possible. **
-------------------------------------------------------------------------------
💸💸💸💸💸💸
👇 👇 👇 👇 👇 👇

GOLD Is Very Bullish! Buy!
Here is our detailed technical review for GOLD.
Time Frame: 1h
Current Trend: Bullish
Sentiment: Oversold (based on 7-period RSI)
Forecast: Bullish
The market is on a crucial zone of demand 3,965.68.
The oversold market condition in a combination with key structure gives us a relatively strong bullish signal with goal 3,993.60 level.
P.S
Overbought describes a period of time where there has been a significant and consistent upward move in price over a period of time without much pullback.
Like and subscribe and comment my ideas if you enjoy them!

A Bearish XAUUSD Setup You Can’t Afford to MissOANDA:XAUUSD has dropped sharply, reflecting the complete dominance of sellers who continue to push the market lower with strong bearish momentum.
After the decline, the price paused and then began to rise slowly, forming a familiar wedge pattern, a classic signal of trend continuation. Buyers attempted to regain control, but the buying pressure was weak, and every rally was quickly met with renewed selling.
Eventually, the price broke below the pattern with significant pressure and is now retesting the breakout area. This confirms that the market remains bearish, with limited chances of a meaningful reversal. If the price continues to break below this zone, further declines are likely to follow.
I anticipate the next bearish wave could reach around 3,885, aligning with the broader downtrend.
This analysis is for educational purposes only and does not constitute trading advice or financial recommendation.

106K Then 94K BTCMorning folks,
So, our suggestions were not in vain. As usual on a ruins of H&S we've got the butterfly and 105K lows has been broken. BTC could drop more, but now it is technically oversold.
We suggest upside bounce, at least to 106K resistance area where we consider another short entry attempt. Downside potential targets are 94-96K and then 80K if situation turns on worst scenario. But we will know it only by November close.

Lingrid | ZECUSDT Short-Term Pullback After Bull TrapBINANCE:ZECUSDT is pressing into the 520–525 resistance band after a strong run within the upward channel, where liquidity above prior highs could invite a quick wick. Price action shows a steady sequence of higher highs/higher lows riding the rising trendline, but fake break setup may occur. If price holds above 498–502 after any sweep, a continuation toward 523–530 remains in play; a rejection and close back below 498 would open a rotation toward 475–460. Momentum stays bullish short-term, yet proximity to a major supply cluster argues for fade-risk before continuation.
⚠️ Risks:
Broad crypto pullback or BTC dominance spike rotating capital out of mid-caps.
Loss of the 498–500 trendline cluster, invalidating the local higher-low structure.
Negative macro headlines or hot U.S. inflation prints dampening risk appetite.
If this idea resonates with you or you have your own opinion, traders, hit the comments. I’m excited to read your thoughts!

GOLD rises despite strong ADP jobs dataOANDA:XAUUSD prices rose more than 1% on Wednesday to $3,978.92 an ounce, despite better-than-expected U.S. private-sector jobs data, reflecting cautious investor sentiment amid high stock market valuations and uncertainty surrounding President Donald Trump’s tariff policies, which are reshaping the global economic landscape.
The ADP employment report showed that the private sector added 42,000 jobs in October, well above the forecast of 28,000, reinforcing the view that the US labor market remains strong and therefore the Fed can delay rate cuts. However, the rise in real yields has not been enough to dampen demand for havens, as investors view gold as a hedge against a potential correction in risk assets.
Christian Borjon Valencia (FXStreet) said gold prices were supported by dovish comments from several Fed officials. Meanwhile, Jim Wyckoff (Kitco Metals) said “safe haven demand is back” as investors “are increasingly concerned about the AI stock bubble and the overvaluation of the US market.”
Financial markets are in a wait-and-see mode as the US Supreme Court holds a hearing on the legality of tariffs imposed by President Trump under the International Emergency Economic Powers Act. An adverse ruling could result in the government having to repay more than $100 billion in tariffs and limit the White House’s ability to direct trade policy, potentially sending shockwaves through the dollar and commodity markets.
Conservative justices, including Chief Justice John Roberts and Neil Gorsuch, have questioned whether the president has the authority to unilaterally impose a “tax on Americans” without congressional approval. A decision against Trump could weaken his central “economic weapon” and drive money into risk-free assets like gold.
On the political prediction market Kalshi, the likelihood of the court backing Trump has fallen from nearly 50% to just about 30%, reflecting growing skepticism about the sustainability of the tariff strategy.
These factors combine to suggest that OANDA:XAUUSD is consolidating its position in a transitional period between monetary policy and political uncertainty, a period in which the Fed is cautious, Washington faces regulatory risks and its power structure is challenged.
Technical Analysis OANDA:XAUUSD
Gold prices are entering a narrow consolidation phase around the $3,940–$3,980/ounce range, after a correction from the $4,380 peak. The daily chart shows that the short-term downtrend channel structure is still maintained, but the downside momentum has weakened significantly. The $3,896 (0.5 Fib) zone continues to act as a key support, while the $3,972–$4,055 resistance zone (0.382 Fib and MA20) is the decisive threshold for the next trend.
The RSI is slowly recovering from the neutral zone and is showing signs of converging with the moving MA, implying that selling pressure is drying up and the market may form a short-term bottom. If the price breaks out decisively at $3,972, the current accumulation pattern could be completed, opening a recovery cycle towards $4,128, the 0.236 Fib mark of the previous decline.
The conditions for a new bull run lie in gold prices remaining stable above the $3,900 support zone, combined with improved cash flows and expectations of the Fed shifting to a more dovish stance in December. In that case, the current consolidation zone could become the basis for a new rally, rather than just a technical pullback.
SELL XAUUSD PRICE 4022 - 4020⚡️
↠↠ Stop Loss 4026
→Take Profit 1 4014
↨
→Take Profit 2 4008
BUY XAUUSD PRICE 3948 - 3950⚡️
↠↠ Stop Loss 3944
→Take Profit 1 3956
↨
→Take Profit 2 3962

XRPUSDT.P - November 6, 2025XRPUSDT.P is showing a short-term bullish recovery, holding above the ascending trendline after rebounding from the $2.2266–$2.0655 support zone. Price is currently testing near $2.2745, with upside potential toward the $2.3126 partial profit level and $2.3640 profit target.
A clean break above $2.3126 would confirm continuation toward higher resistance, while a drop below $2.2266 would invalidate the setup and suggest renewed bearish pressure.
Risk Assessment: Moderate — momentum is improving with trendline support intact, but confirmation above $2.3126 is needed to sustain the bullish move.

BTCUDST.P - November 5, 2025BTCUSDT is currently consolidating within a tight range; a scalp setup is identified with a long entry above 101,859 targeting 104,420, and a short entry below 98,888 targeting 97,056, depending on which breakout confirms first.

Gold Price Breakdown Setup Toward 3960 SupportGold price is trading near 3982, forming higher highs along a trend line. A potential breakdown below the trend line could trigger a move toward 3960 and 3929 support zones.

NZDCAD WILL FALL|SHORT|
✅NZDCAD has pulled back into a premium supply zone after a displacement leg that broke structure. Liquidity above internal highs has likely been swept—expect a move toward the next imbalance. Time Frame 3H.
SHORT🔥
✅Like and subscribe to never miss a new idea!✅

GBP-AUD Will Keep Falling! Sell!
Hello,Traders!
GBPAUD is forming a clear bearish wedge, showing distribution inside a premium zone. Once liquidity above internal highs is swept, expect a displacement toward the downside. Time Frame 4H.
Sell!
Comment and subscribe to help us grow!
Check out other forecasts below too!
Disclosure: I am part of Trade Nation's Influencer program and receive a monthly fee for using their TradingView charts in my analysis.

SILVER FREE SIGNAL|SHORT|
✅SILVER Price is reacting from the supply level after a strong retracement, confirming sellers’ presence. Expect a move toward the $47.80 target area.
—————————
Entry: $48.20
Stop Loss: $48.45
Take Profit: $47.80
Time Frame: 2H
—————————
SHORT🔥
✅Like and subscribe to never miss a new idea!✅

US100 Free Signal! Sell!
Hello,Traders!
US100 is expected to soon retest the horizontal supply area before continuing its bearish move toward the target zone.
---------------------
Stop Loss: 25,877$
Take Profit: 25,607$
Entry: 25,728$
Time Frame: 2H
---------------------
Sell!
Comment and subscribe to help us grow!
Check out other forecasts below too!
Disclosure: I am part of Trade Nation's Influencer program and receive a monthly fee for using their TradingView charts in my analysis.

WTI OIL 4H Channel Down aiming for a Lower Low.WTI Oil (USOIL) is extending the 1D MA50 (red trend-line) rejection of October 24 and has formed a short-term Channel Down. We are currently on its second Bearish Leg following a new rejection this time on the 4H MA200 (orange trend-line).
With the first Bearish Leg declining by -4.72%, we expect the current one to replicate this drop and target $58.60.
-------------------------------------------------------------------------------
** Please LIKE 👍, FOLLOW ✅, SHARE 🙌 and COMMENT ✍ if you enjoy this idea! Also share your ideas and charts in the comments section below! This is best way to keep it relevant, support us, keep the content here free and allow the idea to reach as many people as possible. **
-------------------------------------------------------------------------------
💸💸💸💸💸💸
👇 👇 👇 👇 👇 👇
