Lingrid | LINKUSDT Follow Through Pattern FormingBINANCE:LINKUSDT price action shows continued rejection from the descending trendline inside a well-defined downward channel. The structure remains bearish, with lower highs forming under resistance near $18.00. As long as this rejection holds, price could revisit the support area toward $15.00 before potential stabilization. Overall momentum aligns with a continuation of the broader downtrend.
⚠️ Risks:
Unexpected dovish shift in Fed tone boosting overall crypto sentiment
Strong BTC recovery above $120K improving altcoin structure
Short-term liquidity spikes causing false breakouts above $18.00
If this idea resonates with you or you have your own opinion, traders, hit the comments. I’m excited to read your thoughts!
Signals

PENGUUSDT.P - November 1, 2025PENGUUSDT.P is showing a series of higher lows supported by an ascending trendline, indicating sustained bullish pressure. The planned long setup targets the $0.019059 profit level, with a stop placed near $0.0177738 for clear risk management. A break above the breakeven zone would confirm bullish continuation toward the upper resistance, maintaining a constructive bias while price holds above trendline support.

ETHUSDT.P - November 1, 2025ETHUSDT.P is forming a corrective pullback within an intraday bullish structure, maintaining higher lows from the recent swing base. A buy limit order is positioned near $3,850, anticipating continuation toward the $3,891 resistance target. The stop-loss is set around $3,828 to manage downside risk. A rebound from the order zone would confirm bullish momentum resumption, while sustained price action below $3,828 would invalidate the setup.

EUR-AUD Bullish Bias! Buy!
Hello,Traders!
EURAUD Price has tapped into a clean horizontal demand area after an extended bearish leg. Smart money shows absorption of sell-side liquidity, hinting at a potential short-term bullish move toward the target.
-------------------
Stop Loss: 1.7580
Take Profit: 1.7660
Entry Level: 1.7624
Time Frame: 4H
-------------------
Buy!
Comment and subscribe to help us grow!
Check out other forecasts below too!
Disclosure: I am part of Trade Nation's Influencer program and receive a monthly fee for using their TradingView charts in my analysis.

GBPCAD FREE SIGNAL|LONG|
✅GBPCAD :a clear double-bottom formation confirms the exhaustion of sellers after the extended downtrend. Buyers are reclaiming structure, hinting at a potential bullish reversal toward the target zone.
—————————
Entry: 1.8413
Stop Loss: 1.8359
Take Profit: 1.8496
Time Frame: 1H
—————————
LONG🚀
✅Like and subscribe to never miss a new idea!✅

AUD-NZD Free Signal! Sell!
Hello,Traders!
AUDNZD Price is reacting from a clean horizontal supply zone where previous liquidity was taken. Smart money is now showing rejection signs — expecting a short move toward the downside target zone.
-------------------
Stop Loss: 1.1447
Take Profit: 1.1416
Entry: 1.1431
Time Frame: 4H
-------------------
Sell!
Comment and subscribe to help us grow!
Check out other forecasts below too!
Disclosure: I am part of Trade Nation's Influencer program and receive a monthly fee for using their TradingView charts in my analysis.

NZDUSD FREE SIGNAL|LONG|
✅NZDUSD bounced strongly from the defined demand level, confirming bullish order flow. The pair may continue climbing toward the target zone as liquidity above recent highs gets cleared.
—————————
Entry: 0.5725
Stop Loss: 0.5709
Take Profit: 0.5744
Time Frame: 2H
—————————
LONG🚀
✅Like and subscribe to never miss a new idea!✅

GBPUSD Will Move Higher! Long!
Here is our detailed technical review for GBPUSD.
Time Frame: 1D
Current Trend: Bullish
Sentiment: Oversold (based on 7-period RSI)
Forecast: Bullish
The market is testing a major horizontal structure 1.315.
Taking into consideration the structure & trend analysis, I believe that the market will reach 1.335 level soon.
P.S
We determine oversold/overbought condition with RSI indicator.
When it drops below 30 - the market is considered to be oversold.
When it bounces above 70 - the market is considered to be overbought.
Like and subscribe and comment my ideas if you enjoy them!

EUR/USD – Bears in Control but Demand Zone Could Spark a Rebound🔹 EUR/USD – Weekly Outlook (1–7 November 2025)
Bears remain in control, but a key demand zone is now in play.
The euro continues to trade under pressure as macro divergences between the U.S. and Eurozone persist.
In the U.S., the latest data confirmed a clear cooldown in growth and inflation, with Core PCE slowing to 2.6% YoY and GDP Q3 printing 2.2% vs. 3.0% expected. This fueled market expectations for a Fed rate cut in Q1 2026, yet Chair Powell reiterated that “progress on inflation remains incomplete,” keeping a neutral–hawkish tone. The U.S. dollar therefore preserved its defensive bid, supported by ongoing safe-haven demand amid geopolitical tension and weaker European data.
Across the Eurozone, inflation continues to decelerate (headline 2.5%, core 2.8%), while PMIs remain below 50, indicating a stagnant industrial sector. Market participants now expect the ECB to lean more dovish into early 2026, potentially preparing the ground for a rate cut once disinflation stabilizes. This narrative has weighed on the euro, pushing EUR/USD back below 1.16.
COT (Commitment of Traders)
COT data remain frozen due to the CFTC shutdown, with the last update dated September 23.
At that time, non-commercials held a strong net long on EUR (+114K), reflecting broad bearishness on the USD. However, the latest price action clearly suggests a partial unwinding of long exposure, consistent with the recent downside retracement.
⚠️ These figures are now outdated and must be interpreted with caution — institutional flows may have shifted significantly since late September.
Retail Sentiment
📊 59% long / 41% short → contrarian bearish bias.
Retail traders remain predominantly long, implying a higher probability of continued downside in the short term, especially while macro data favor the dollar.
Seasonality
Seasonal statistics for November are mildly positive over 10–20Y composites, but recent 5-year data suggest a sluggish start to the month, often followed by a technical rebound in the second half.
📅 Seasonal conclusion: short-term weakness likely persists into mid-November, with recovery potential toward month-end once markets price in softer U.S. CPI or dovish Fed expectations.
Technical Outlook
EUR/USD continues to move within a descending channel since late August.
After a clean rejection from the 1.1700–1.1750 supply zone, the pair broke recent lows and is now consolidating within the 1.1530–1.1550 demand area, aligned with the summer support base.
Key technical levels:
Resistance: 1.1650–1.1700
Immediate support: 1.1530–1.1500
Next demand zone: 1.1380–1.1420
RSI: below 50, yet showing early signs of bullish divergence, hinting at a potential rebound if 1.15 holds.
🎯 Primary Scenario:
Price may extend the corrective leg toward 1.1450–1.1420, where a structural swing low could form. From there, any USD weakness following U.S. CPI data could fuel a technical rebound targeting 1.1650–1.1700.
⚙️ Invalidation: Daily close above 1.1730, which would break the descending structure and shift the bias neutral-to-bullish.
Summary
Macro: Euro pressured by softer inflation and weak PMI; USD supported by cautious Fed and geopolitical flows.
Sentiment: Retail still long — contrarian signal for more downside.
Technical: Channel intact; demand zone at 1.1530–1.1500 under test.
Outlook: Expect another leg lower before possible late-month rebound.

GBPUSD Will Fall! Short!
Take a look at our analysis for GBPUSD.
Time Frame: 9h
Current Trend: Bearish
Sentiment: Overbought (based on 7-period RSI)
Forecast: Bearish
The price is testing a key resistance 1.331.
Taking into consideration the current market trend & overbought RSI, chances will be high to see a bearish movement to the downside at least to 1.320 level.
P.S
Please, note that an oversold/overbought condition can last for a long time, and therefore being oversold/overbought doesn't mean a price rally will come soon, or at all.
Like and subscribe and comment my ideas if you enjoy them!

EURGBP Will Go Up From Support! Long!
Please, check our technical outlook for EURGBP.
Time Frame: 6h
Current Trend: Bullish
Sentiment: Oversold (based on 7-period RSI)
Forecast: Bullish
The market is trading around a solid horizontal structure 0.873.
The above observations make me that the market will inevitably achieve 0.876 level.
P.S
The term oversold refers to a condition where an asset has traded lower in price and has the potential for a price bounce.
Overbought refers to market scenarios where the instrument is traded considerably higher than its fair value. Overvaluation is caused by market sentiments when there is positive news.
Like and subscribe and comment my ideas if you enjoy them!

USDJPY Will Go Higher! Long!
Take a look at our analysis for USDJPY.
Time Frame: 9h
Current Trend: Bullish
Sentiment: Oversold (based on 7-period RSI)
Forecast: Bullish
The price is testing a key support 152.055.
Current market trend & oversold RSI makes me think that buyers will push the price. I will anticipate a bullish movement at least to 153.795 level.
P.S
We determine oversold/overbought condition with RSI indicator.
When it drops below 30 - the market is considered to be oversold.
When it bounces above 70 - the market is considered to be overbought.
Like and subscribe and comment my ideas if you enjoy them!

AUD/USD – Waiting for the Pullback Before the Next Bullish Leg?After rebounding strongly from October lows, AUD/USD is testing the 0.6580–0.6620 supply zone while staying above the key support area at 0.6520–0.6550.
On the macro side, the RBA remains data-dependent after pausing its rate cuts, citing sticky services inflation and resilient labor markets. Meanwhile, the USD has been capped by softer growth data and growing expectations for further Fed easing into early 2026 — a mix that keeps AUD/USD in recovery mode, at least short term.
COT positioning (last valid as of September 23, due to the CFTC shutdown) still reflected heavy speculative shorts on the Aussie — a structure that supported the recent bullish correction but is now outdated.
Retail sentiment shows 77% of traders short, suggesting a strong contrarian upside bias, consistent with the technical picture.
Seasonality data points to a mildly positive bias in October–November, typically followed by neutral behavior in December.
Technical structure:
Price has broken out of the descending channel and is building a short-term higher-low structure.
Support (demand zone): 0.6520–0.6550
Resistance (supply zone): 0.6580–0.6620 → breakout could extend toward 0.6680–0.6720
RSI: mid-range, indicating room for another impulse higher.
🎯 Trading Plan
Base scenario: Look for a pullback into 0.6520–0.6550 to rejoin the bullish leg targeting 0.6680–0.6720.
Alternative: A rejection from 0.6600–0.6620 could trigger a short-term correction toward 0.6500 before buyers return.
Invalidation: Daily close below 0.6475 (loss of structure).
⚙️ Bias: Short-term bullish, medium-term neutral-to-bullish.
🕒 Focus: RBA tone, Chinese PMIs, and U.S. ISM/labor data — all key for the next leg of AUD/USD.

USD/CAD: Short-Term Correction 🔹 COT (Commitment of Traders)
(Last update: September 23, 2025 – data not refreshed due to the U.S. government shutdown)
USD Index (ICE Futures)
Non-commercial longs: 14,032 (+1,541)
Non-commercial shorts: 24,376 (−1,009)
→ Institutional traders were closing shorts and adding longs, signaling early signs of bullish bias on the USD before the shutdown halted updates.
Canadian Dollar (CME Futures)
Non-commercial longs: 18,035 (−2,940)
Non-commercial shorts: 132,841 (+4,689)
→ Heavy short build-up on CAD alongside long reduction — a bearish institutional sentiment for the Canadian Dollar.
Even with outdated data, the COT positioning remains USD bullish / CAD bearish, supporting a medium-term upside bias on USD/CAD.
🔹 FX Sentiment (Retail Positioning)
56% short / 44% long
📌 Retail traders are slightly net short, providing a contrarian bullish signal for USD/CAD — aligning with institutional positioning.
🔹 Seasonality
Historically, October shows mild positive bias for USD/CAD on long-term averages (15–20 years), but the 5-year tendency is slightly negative.
Neutral-to-mildly bullish for late October, with stronger USD seasonality emerging in November–December.
🔹 Price Action
The pair remains within a rising parallel channel from July lows, recently rejecting the upper boundary near 1.4100 and showing early signs of structural fatigue.
Price is now consolidating between 1.4000–1.3900, with bearish momentum slowly building up.
Technical Levels:
Resistance: 1.4050–1.4100
Support zone 1: 1.3900
Support zone 2 (major): 1.3700
RSI: showing divergence with lower highs, signaling potential corrective leg ahead.
🎯 Main Scenario:
A short-term retracement toward 1.3850–1.3800 remains likely if 1.3900 breaks, while the broader bullish trend remains intact unless price closes below 1.3700.
Bias for now → Short-term corrective, medium-term bullish.
Invalidation: daily close below 1.3700 (trendline + demand break).

GOLD Short-Term Pullback 🔹 COT (Commitment of Traders)
(Last update: September 23, 2025 – data not refreshed due to the CFTC shutdown)
Gold (COMEX)
Non-commercial longs: 332,808 (+6,030)
Non-commercial shorts: 66,059 (+5,691)
→ The latest available data (outdated) showed an increase in both positions, with a stronger rise on the long side — indicating institutional accumulation in late September ahead of the October rally.
Although outdated, the COT report still reflects a mildly bullish structure, but no longer captures the current market dynamics after recent volatility.
🔹 FX Sentiment (Retail Positioning)
58% long / 42% short
📌 Retail traders remain moderately long on gold. This supports a short-term contrarian bearish bias, aligning with the ongoing corrective move in price.
🔹 Seasonality
Historically, October and November tend to be statistically bullish months for gold, with average gains between +2% and +4% over 10–20-year periods.
📌 Seasonal conclusion: the context remains bullish on a seasonal basis, with potential for recovery once the current correction stabilizes.
🔹 Price Action
After the strong bullish impulse that pushed XAU/USD into the 4,350–4,400 area, price entered a phase of consolidation/distribution.
Current structure shows:
Key resistance: 4,250–4,300
Main demand zone: 3,950–3,900
RSI remains neutral but continues to lose momentum, consistent with a possible minor bearish leg before a new bullish wave.
🎯 Main Scenario:
Expecting a continuation of the corrective phase toward 3,950–3,900, aligning with the daily demand area and a likely institutional reaccumulation zone.
From there, a potential bullish resumption could emerge within November’s seasonal strength.
⚙️ Invalidation: daily close below 3,850, which would compromise the medium-term bullish structure.

VIRTUALUSDT.P - November 1, 2025VIRTUALUSDT.P is exhibiting a corrective rally into key resistance, with two short limit orders positioned near the $2.442 and $4.265 levels. The setup anticipates a potential fakeout before resuming downside momentum toward the $0.2629 profit target. Stops are placed at $4.625 and $7.424 to manage risk. Price remains within a broader bearish framework, and rejection from resistance zones would confirm the continuation of the downtrend.

TRUMPUSDT.P - November 1, 2025TRUMPUSDT.P is showing a strong bullish reversal from a higher low structure, supported by a breakout and sustained momentum. The long setup targets the $11.219 profit level, with a stop positioned at $5.355 for clear risk control. A move beyond the $9.000 zone would validate bullish continuation, prompting a shift of the stop to breakeven. Price action remains constructive while holding above the ascending support trendline.

XAUUSD Breaks Out and Continues Its Bullish RallyOANDA:XAUUSD The market is still in a strong downtrend, yet the bearish momentum is gradually losing strength as a double bottom pattern begins to form, a classic signal that sellers are running out of steam.
After the second bottom took shape, buyers stepped in with growing confidence, and the price is now testing the neckline, confirming a structural shift toward a potential bullish reversal.
At this point, all eyes are fixed on the neckline. If a breakout above this level occurs, it will confirm the pattern and open the path for buyers to push the price higher toward 4,135.

NZD-USD Long From Demand Area! Buy!
Hello,Traders!
NZDUSD tapped into a horizontal demand area with strong rejection wicks. Expecting a short-term bullish reaction toward the next liquidity pocket at the target level.Time Frame 2H.
Buy!
Comment and subscribe to help us grow!
Check out other forecasts below too!
Disclosure: I am part of Trade Nation's Influencer program and receive a monthly fee for using their TradingView charts in my analysis.

EURUSD BEARISH BIAS|SHORT|
✅EURUSD broke structure below the supply level, confirming bearish order flow. After a minor pullback into imbalance, more downside is expected as price seeks liquidity resting below recent lows. Time Frame 3H.
SHORT🔥
✅Like and subscribe to never miss a new idea!✅

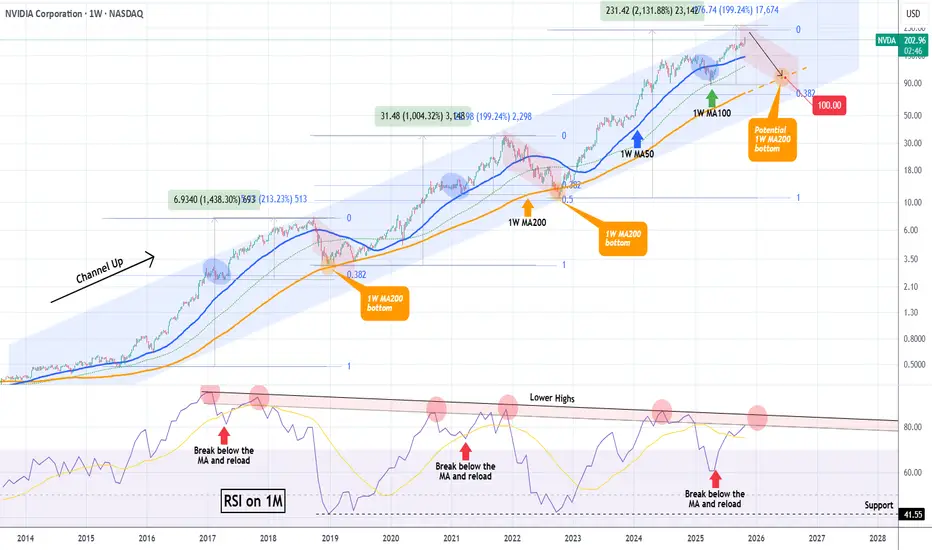
NVIDIA hit $5 Trillion but the end of the rally may be near.NVIDIA Corporation (NVDA) broke this week the $5 Trillion market cap barrier, becoming the first company to do so. In the meantime, it is extending the rally that started on the April 07 Low on the 1W MA100 (green trend-line), following the end of the Tariff War.
This rally has been nothing more than a part of the larger technical Bullish Leg inside the 10-year Channel Up that NVIDIA has been trading in. Within this pattern, the price has had rather asymmetric Bullish Legs in terms of rise % but has always been rejected at the top of the Channel Up and corrected back to the 1W MA200 (orange trend-line).
Following the mid-Bullish Leg corrections to the 1W MA50 (blue trend-line), the final rallies of the Bullish Legs before their Tops have been around +200%. Then their corrections/ Bearish Legs have always hit the 1W MA200 (as mentioned), with one time bottoming just above the 0.382 Fibonacci retracement level and the other below it (0.5 Fib).
We previously had NVIDIA's top at around $240, which is slightly below this expected +200% rise from the 1W MA100 bottom. As a result, we project that a potential contact with the 1W MA200 for the 2026 Bearish Leg can be achieved around $100, which is above the 0.382 Fib, similar to 2018.
Note that a very reliable Top indicator has also been the 1M RSI and its 9-year Lower Highs Zone. Every time the RSI entered the Zone and then broke below its MA (yellow trend-line) and rebounded, the next hit was the Bullish Leg's Top. Right now the 1M RSI is about to enter this Zone for the second time, indicating that we may be approaching the end of this long-term rally.
-------------------------------------------------------------------------------
** Please LIKE 👍, FOLLOW ✅, SHARE 🙌 and COMMENT ✍ if you enjoy this idea! Also share your ideas and charts in the comments section below! This is best way to keep it relevant, support us, keep the content here free and allow the idea to reach as many people as possible. **
-------------------------------------------------------------------------------
💸💸💸💸💸💸
👇 👇 👇 👇 👇 👇
RUSSELL 25-year Channel Up giving a Sell Signal soon.Russell 2000 (RUT) has been trading within a 25-year Channel Up since the March 2000 High, which was the Top of the A.I. Bubble. Since then it only broke once during the 2008 Housing Crisis. Once recovered, it has used all standard macro levels of Support as short, medium and long-term buy entries respectively, with those being the 1M MA50 (blue trend-line), the 1M MA100 (green trend-line) and the 1M MA200 (orange trend-line).
The April 2025 rebound, which is the market's most recent rally, took place right on the 1M MA100. The index is however approaching the 0.236 Fibonacci level of the Channel Up, which since the 2000 High, has provided almost all rejection points, being the strongest Sell Signal (exception 2021, which was the mega-pump recovery following the March 2020 COVID flash crash).
As you can see, the market has historically started a correction on the 2nd test/ rejection on the 0.236 Fib. Out of those 3 corrections, two of them took place after the index broke above the 0.236 Fib and one just below it. All however have pulled-back to at least the 0.382 (blue) Fib. The key here however is to determine the exact High so that you can draw the 0.382 Fib retracement.
The only condition that most likely won't be fulfilled (as it happened on all previous cases), is that the 1M RSI most likely won't break above the 70.00 overbought level before the correction happens. So there's question mark there.
As for our Target, we expect at least 2230 (Fib 0.382) to get hit around mid 2026.
-------------------------------------------------------------------------------
** Please LIKE 👍, FOLLOW ✅, SHARE 🙌 and COMMENT ✍ if you enjoy this idea! Also share your ideas and charts in the comments section below! This is best way to keep it relevant, support us, keep the content here free and allow the idea to reach as many people as possible. **
-------------------------------------------------------------------------------
💸💸💸💸💸💸
👇 👇 👇 👇 👇 👇

AUDNZD FREE SIGNAL|SHORT|
✅AUDNZD is reacting from a clear supply level, showing early rejection wicks and loss of momentum. A short-term bearish leg is expected toward the nearest imbalance before potential continuation.
—————————
Entry: 1.1433
Stop Loss: 1.1445
Take Profit: 1.1410
Time Frame: 3H
—————————
SHORT🔥
✅Like and subscribe to never miss a new idea!✅
