USDJPY Had its 1st 1D Golden Cross since Dec 2024.The USDJPY pair has been trading within a Channel Up pattern since the April 22 2025 market bottom and just last week, it formed the first 1D Golden Cross since December 16 2024. As you can see, all three 1D Golden Crosses since June 2023 have been strong Buy Signals.
All have been formed within Channel Up patterns that formed Higher Highs just after the crosses. The target of the current Channel Up is 154.000, which represents a +6.06% rise, similar to both previous Bullish Legs of this pattern. The uptrend is so far restricted by the presence of the Lower Highs trend-line that started back on the July 03 2024 market Top.
This time however we may see this break as the 1W RSI has already broken above its own Lower Highs trend-line, signaling an early bullish warning. As a result, if the July 2024 Lower Highs trend-line breaks, we expect the pair to eye the upper Resistance at 159.000.
-------------------------------------------------------------------------------
** Please LIKE 👍, FOLLOW ✅, SHARE 🙌 and COMMENT ✍ if you enjoy this idea! Also share your ideas and charts in the comments section below! This is best way to keep it relevant, support us, keep the content here free and allow the idea to reach as many people as possible. **
-------------------------------------------------------------------------------
💸💸💸💸💸💸
👇 👇 👇 👇 👇 👇
Signals

GBP-USD Free Signal! Buy!
Hello,Traders!
GBPUSD Price has tapped into a strong horizontal demand area after a corrective drop, showing potential for a bullish rebound. If this zone continues to hold, we may see buyers driving price toward the next short-term target.
-------------------
Stop Loss: 1.3361$
Take Profit: 1.3391$
Entry: 1.3375$
Time Frame: 3H
-------------------
Buy!
Comment and subscribe to help us grow!
Check out other forecasts below too!
Disclosure: I am part of Trade Nation's Influencer program and receive a monthly fee for using their TradingView charts in my analysis.

EUR-USD Bearish Breakout! Sell!
Hello,Traders!
EURUSD Price has broken below the horizontal supply area and is now forming a bearish continuation setup. A possible retracement toward the previous zone may attract more sellers, targeting deeper liquidity levels below 1.1580. Time Frame 5H.
Sell!
Comment and subscribe to help us grow!
Check out other forecasts below too!
Disclosure: I am part of Trade Nation's Influencer program and receive a monthly fee for using their TradingView charts in my analysis.

GOLD FREE SIGNAL|LONG|
✅XAUUSD Price has reached the key demand zone where institutional buyers are likely accumulating. The market structure suggests a potential rebound toward 4,160$, with momentum favoring a bullish continuation after this reaction zone holds. Time Frame 2H.
—————————
Entry: 4,115$
Stop Loss: 4,079$
Take Profit: 4,160$
Time Frame: 2H
—————————
LONG🚀
✅Like and subscribe to never miss a new idea!✅

TESLA New Bullish Leg to $600 has started.Last time we took a look at Tesla (TSLA) more than a month ago (September 11, see chart below), we gave a massive buy signal that worked out instantly, as we saw the resemblances between the recent Triangle accumulation pattern and that of late 2024, setting a $600 long-term Target:
This time we take a better look at the Channel Up that has emerged. Technically it looks like a Bearish Leg (red Channel Down) has ended and with the 1D MA50 (blue trend-line) holding, a new Bullish Leg has been initiated.
The previous Bullish Leg, which by the way started after a 1D MA100 (green trend-line) hold, rose by +59.26%. This puts the next Higher High technically above our $600 long-term Target.
Notice also how the 1D MACD is about to form a new Bullish Cross, with all previous ones being a strong Buy Signal. At the same time, the 1D RSI found support and bounced on its 5-month Higher Lows trend-line.
-------------------------------------------------------------------------------
** Please LIKE 👍, FOLLOW ✅, SHARE 🙌 and COMMENT ✍ if you enjoy this idea! Also share your ideas and charts in the comments section below! This is best way to keep it relevant, support us, keep the content here free and allow the idea to reach as many people as possible. **
-------------------------------------------------------------------------------
💸💸💸💸💸💸
👇 👇 👇 👇 👇 👇

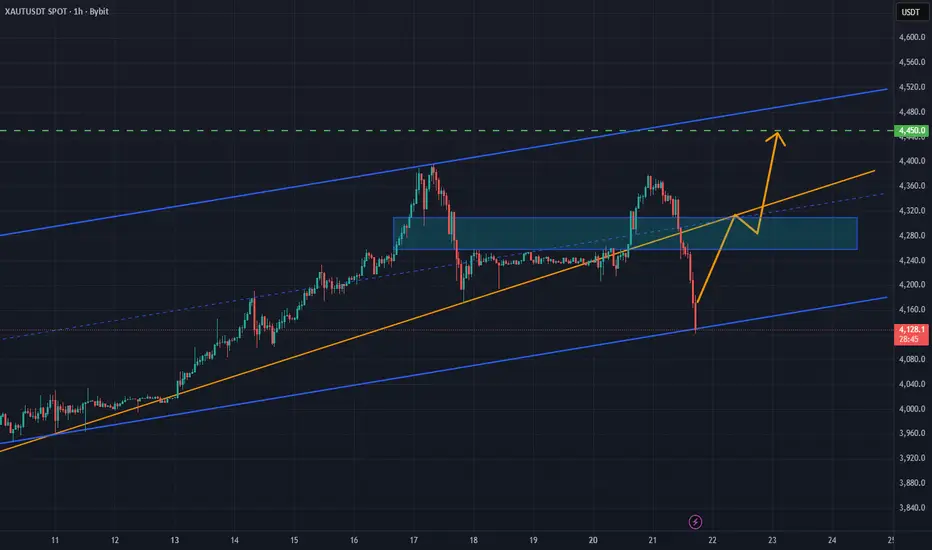
XAU/USD: Bullish Channel Structure Builds Toward Breakout ZoneXAU/USD continues to follow a bullish structure within an upward channel, forming impulse legs followed by measured pullbacks. The third test of the $4,380 resistance increases the likelihood of a breakout toward $4,450.
As long as price holds above the $4,250–$4,270 support zone, buyers remain in control. Momentum stays constructive, backed by higher lows and repeated rebounds from the trendline base.
S&P500 Both short and long term bullish targets intact.The S&P500 index (SPX) continues to trade within its 5-month Channel Up and last Friday's pull-back to its 1D MA50 (red trend-line) again is another testament to it as it rebounded exactly on its bottom, making yet another Higher Low.
As we've shown on our previous analysis its short-term Target is the 1.382 Fibonacci extension at 6850. Ahead of a massive 1D MACD Bullish Cross however, we can see (after another short pull-back) the index extending much higher to its 2.5 Fibonacci extension (orange) at 7150 before a larger correction takes place.
-------------------------------------------------------------------------------
** Please LIKE 👍, FOLLOW ✅, SHARE 🙌 and COMMENT ✍ if you enjoy this idea! Also share your ideas and charts in the comments section below! This is best way to keep it relevant, support us, keep the content here free and allow the idea to reach as many people as possible. **
-------------------------------------------------------------------------------
💸💸💸💸💸💸
👇 👇 👇 👇 👇 👇

GOLD Will Go Up From Support! Long!
Here is our detailed technical review for GOLD.
Time Frame: 15m
Current Trend: Bullish
Sentiment: Oversold (based on 7-period RSI)
Forecast: Bullish
The market is on a crucial zone of demand 4,269.79.
The oversold market condition in a combination with key structure gives us a relatively strong bullish signal with goal 4,298.66 level.
P.S
The term oversold refers to a condition where an asset has traded lower in price and has the potential for a price bounce.
Overbought refers to market scenarios where the instrument is traded considerably higher than its fair value. Overvaluation is caused by market sentiments when there is positive news.
Like and subscribe and comment my ideas if you enjoy them!

AUDUSD Will Go Higher! Buy!
Take a look at our analysis for AUDUSD.
Time Frame: 9h
Current Trend: Bullish
Sentiment: Oversold (based on 7-period RSI)
Forecast: Bullish
The price is testing a key support 0.648.
Current market trend & oversold RSI makes me think that buyers will push the price. I will anticipate a bullish movement at least to 0.655 level.
P.S
We determine oversold/overbought condition with RSI indicator.
When it drops below 30 - the market is considered to be oversold.
When it bounces above 70 - the market is considered to be overbought.
Like and subscribe and comment my ideas if you enjoy them!

GBPJPY Will Go Up! Long!
Please, check our technical outlook for GBPJPY.
Time Frame: 12h
Current Trend: Bullish
Sentiment: Oversold (based on 7-period RSI)
Forecast: Bullish
The market is trading around a solid horizontal structure 203.120.
The above observations make me that the market will inevitably achieve 206.243 level.
P.S
Overbought describes a period of time where there has been a significant and consistent upward move in price over a period of time without much pullback.
Like and subscribe and comment my ideas if you enjoy them!

NZDCAD Will Move Lower! Sell!
Here is our detailed technical review for NZDCAD.
Time Frame: 9h
Current Trend: Bearish
Sentiment: Overbought (based on 7-period RSI)
Forecast: Bearish
The market is testing a major horizontal structure 0.803.
Taking into consideration the structure & trend analysis, I believe that the market will reach 0.794 level soon.
P.S
Please, note that an oversold/overbought condition can last for a long time, and therefore being oversold/overbought doesn't mean a price rally will come soon, or at all.
Like and subscribe and comment my ideas if you enjoy them!

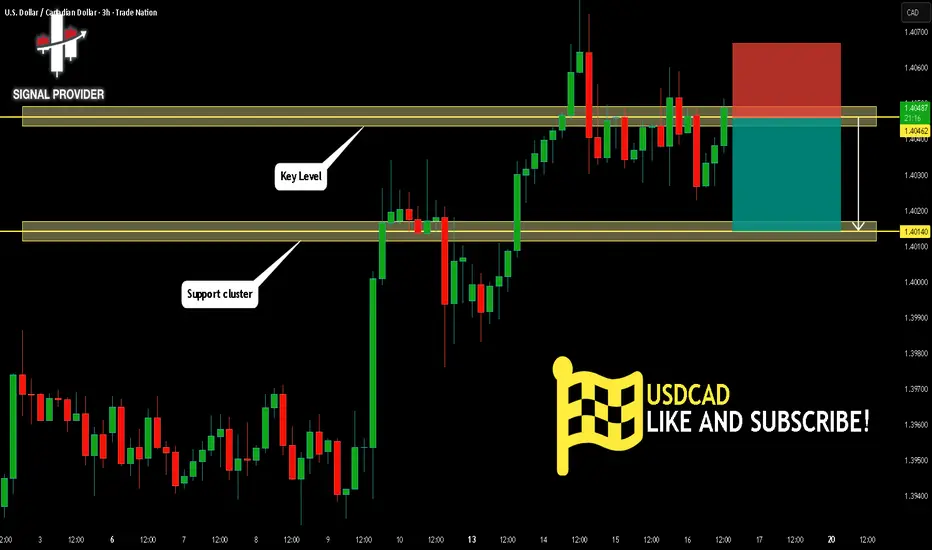
USDCAD Will Go Lower! Short!
Here is our detailed technical review for USDCAD.
Time Frame: 3h
Current Trend: Bearish
Sentiment: Overbought (based on 7-period RSI)
Forecast: Bearish
The market is on a crucial zone of supply 1.404.
The above-mentioned technicals clearly indicate the dominance of sellers on the market. I recommend shorting the instrument, aiming at 1.401 level.
P.S
Overbought describes a period of time where there has been a significant and consistent upward move in price over a period of time without much pullback.
Like and subscribe and comment my ideas if you enjoy them!
BITCOIN The NIGHTMARE chart you don't want to see right nowBitcoin (BTCUSD) is on the verge of establishing an LMACD Bearish Cross on the 1M time-frame, which for better reliability needs to close the current 1M candle (October) to confirm it.
** The nightmare LMACD Bearish Cross **
As the title says, this is a 'nightmare' development for the market, certainly not something that the majority of investors want to see right now, as this Bearish Cross has had disastrous effects every time it took place at the end of the 4-year Cycle.
First of all, let's not allow being overlooked the fact that the 1M LMACD is also reversing right before a test of its multi-year Lower Highs trend-line. That line priced all previous Cycle Tops.
** Is this a Cycle Top? Best-worst case scenarios**
Back to he Bearish Cross, it has always been formed around Cycle Tops as well. More specifically, the one that was formed after January 2014, was already on the 3rd month after the Cycle Top. The one that was formed after February 2018, was on the 4th month of the Bear Cycle. More recently, the one that was formed on August 2021 was 3 months before the Cycle Top. Interestingly enough, that was a peculiar Cycle with an (almost) Double Top, which was no surprise that the LMACD got rejected on its Lower Highs trend-line much earlier on the April 2021 Top.
As a result, the best case scenario based on this model for BTC is to have another 3 months of Bull, especially if it gets aided by favorable news (Trade deal, rate cuts, adoption). The more likely however historically, especially if October closes in red in 10 days, is that Bitcoin has entered a new Bear Cycle and this MACD Bearish Cross comes to confirm it.
** How low can it go?? **
What's even worse is that, if we've already seen the Top, the market tends to decline on average by more than -80% historically, with the last Bear Cycle suffering losses of almost -78% (the softest Cycle of all). It was also the only one that closed a month (numerous 1M candles actually) below the 1M MA50 (blue trend-line) unlike the first two, which used that as a Support/ Cycle Bottom. As a result, the best case scenario if a new Bear Cycle has already started is to place a bottom on its 1M MA50 around $60000 - 65000 and the worst to decline by -78% around $30000 (or a little worse).
Again, not the kind of technical analysis most want to be seeing right now..
** The positive look **
For conclusion, we should always keep in mind that the fundamental scenery/ environment changes with every Cycle in a more favorable way, e.g this Cycle we had much stronger institutional adoption, even national treasuries and more importantly we saw the introduction of the Bitcoin ETF by Blackrock which was a game changer in capital inflows. You don't see often such investment bank giants 'allowing' one of their products to tank by -80%.
But what do you think? Are we already in a Bear Cycle or there are some more months left in the Bull's tank? Feel free to let us know in the comments section below!
-------------------------------------------------------------------------------
** Please LIKE 👍, FOLLOW ✅, SHARE 🙌 and COMMENT ✍ if you enjoy this idea! Also share your ideas and charts in the comments section below! This is best way to keep it relevant, support us, keep the content here free and allow the idea to reach as many people as possible. **
-------------------------------------------------------------------------------
💸💸💸💸💸💸
👇 👇 👇 👇 👇 👇

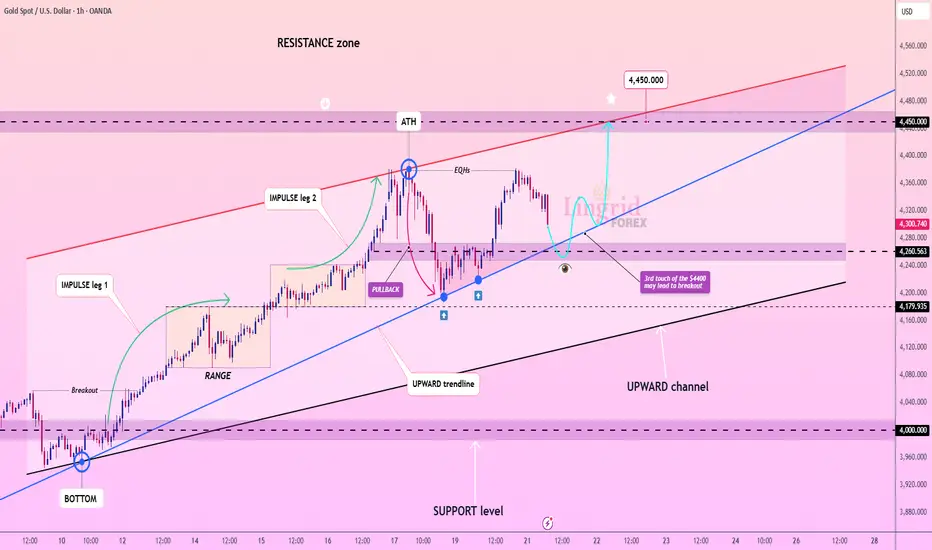
Lingrid | GOLD Trend Continuation Pattern FormingOANDA:XAUUSD is maintaining its bullish structure within an upward channel, where the price continues to create impulsive legs followed by controlled pullbacks. The third touch of the $4,380 resistance area suggests an increasing probability of a breakout continuation toward $4,450. As long as the $4,250–$4,270 support region holds, buyers remain in control of the broader trend. Momentum remains constructive, supported by higher lows and consistent rebounds from the trendline base.
⚠️ Risks:
Failure to hold $4,240 could invalidate the bullish setup.
Strong CPI data may cap gold’s upside.
A sudden drop in inflation expectations could weaken safe-haven demand.
If this idea resonates with you or you have your own opinion, traders, hit the comments. I’m excited to read your thoughts!
Lingrid | USDCAD Contraction Leading to Bullish BreakoutFX:USDCAD continues to respect its upward channel, consolidating after multiple tests of the ascending trendline that define the current bullish structure. The confluence near 1.4036 aligns with dynamic support, suggesting buyers may soon attempt another push toward the 1.4100 resistance. A sustained move above this level could extend momentum toward the upper boundary of the channel. The overall compression phase indicates market preparation for a breakout continuation.
⚠️ Risks:
A breakdown below 1.4030 may invalidate the bullish scenario.
Strong CPI data or oil price rally could pressure USD and reverse gains.
Broader risk sentiment shifts may limit upside potential.
If this idea resonates with you or you have your own opinion, traders, hit the comments. I’m excited to read your thoughts!

Gold Setup You Can’t IgnoreHey everyone, Erik here !
Gold is quietly preparing for its next move. After a strong rally, price didn’t collapse as many expected. Instead, it’s been building a smooth accumulation structure — the classic Cup and Handle that often signals continuation in a healthy uptrend.
This setup tells a deeper story about market psychology. Sellers are running out of strength, while buyers keep absorbing every pullback with patience and confidence. Momentum is quietly shifting, and pressure beneath the surface is growing.
If a clean breakout confirms this formation, gold could enter its next bullish leg. A move toward 4500 looks not just possible, but reasonable based on the current market structure.
Until that confirmation comes, patience remains the key. Waiting for a clear breakout with strong volume helps filter out false signals and keeps you aligned with the dominant trend.

Gold setup: The retracement that could spark the next rallyOANDA:XAUUSD continues to trade confidently within a well-defined ascending channel, maintaining a clear and healthy bullish structure. After testing the upper boundary, the price pulled back to the mid-zone, where a strong rejection candle appeared, confirming that buyers are still defending key levels with conviction and keeping the upward momentum alive.
This kind of market behavior often signals renewed strength before the next move higher. If the bullish momentum holds, the price could break above the upper boundary of the channel and push toward new highs. Given the current technical setup and positive sentiment across the market, a move toward 4,500 seems both realistic and consistent with the ongoing trend.
Even so, caution remains important. A daily close below the lower boundary of the channel would weaken the bullish structure and could trigger a short-term correction before the trend resumes.
From a broader perspective, the bullish outlook for gold continues to be supported by geopolitical tensions, global uncertainty over interest rate policies, and the weakening US dollar. With central banks maintaining strong demand for gold as a hedge against economic instability, the precious metal remains one of the most attractive safe-haven assets in today’s volatile market.

Lingrid | LINKUSDT Bearish Continuation Short OpportunityBINANCE:LINKUSDT has been moving inside a well-defined downward channel, consistently forming lower highs and lower lows in line with bearish structure. The recent rejection from the downward trendline confirms continued pressure from sellers near $18.50 resistance. Unless price breaks and sustains above this area, the broader momentum favors a move toward the $15.00 support level. Current structure implies that each rally attempt remains corrective within a larger downtrend.
⚠️ Risks:
A sudden BTC recovery could invalidate the bearish setup.
Failure to hold below $18.50 may trigger a short squeeze.
Softer macro sentiment or lower volatility could delay breakdown momentum.
If this idea resonates with you or you have your own opinion, traders, hit the comments. I’m excited to read your thoughts!

Gold Bull Market Outlook And Targets: 5000 USD/7500 USDGold Bull Markets Long Term Overview and 2025 Market Update
________________________________________
🌊 Five-Wave Roadmap — Targets & Timing
• Wave 1 (2016–2020): From ~$1,050–1,200 to the COVID-era spike; established secular up-trend.
• Wave 2 (2020–2022): Consolidation/corrective pullback (~–20%).
• Wave 3 (2023–2025/26): Power leg to ATHs (current). Room to extend toward $4,200–$4,500 on flow surges before pausing.
• Wave 4 (2026, base case): Re-accumulation/consolidation ~12 months; likely range-bound –10% to –15% from the Wave-3 peak as institutional buying digests gains.
• Wave 5 (2027–2030/32): Final thrust to the cycle’s terminal zone:
– First objective: $5,000–$5,500 (consistent with 2026 Street “bull wave” scenarios).
– Terminal extension: $7,500–$8,000 by 2030–2032 (our desk’s stretch path if real yields stay muted, official-sector demand persists, and private capital rotation broadens).
Why Wave-4 can last ~12 months: prior secular bulls often paused for a full year near major breakouts while flows “change hands.” Expect lower realized vol, fading retail FOMO, and steady official accumulation to define the tape.
📈 Top 10 Stats of the Current Bull 2025
1. Price & ATHs: Spot ~$3.75–$3.79k; fresh ATH $3,790.82 on Sep 23, 2025.
2. 2025 YTD: Roughly +40–43% YTD
3. Central Banks: 1,045 t added in 2024 (later revised to ~1,086 t as lagged data came in). H1/Q1’25 tracking remained elevated.
4. ETF Flows: Back-to-back strong quarters; Q2’25 total demand 1,249 t, value US$132bn (+45% y/y) with ETFs instrumental.
5. Gold vs Equities: Gold ≈+40% vs S&P 500 ≈+13% total return YTD.
6. Jewelry Demand: Tonnage softened as prices surged; value at records (2024 down y/y; weakness persisted into H1’25).
7. Gold–Silver Ratio: ~85–88 (silver torque improving as it pushes into the mid-$40s).
8. Macro Link: Safe-haven bid + expected policy easing keep real-yield headwinds contained.
9. Technical: Confirmed 13-yr cup-and-handle breakout (Mar ’24) underpinning trend.
10. Street Forecasts: GS baseline $4,000 by mid-’26; bulled-up houses (HSBC/BofA) flag $4.9–$5.0k potential into 2026 if private/ETF rotation persists.
• This cycle is different: record central-bank buying + renewed ETF inflows + lower real rates = powerful tailwind.
• Price: Gold notched fresh ATHs this month (up to $3,790.82). 2025 is shaping up as the strongest year since the late 1970s.
• Relative: Gold is crushing equities YTD (≈+40% vs S&P 500 ≈+13% total return).
• Setup: A 13-year “cup-and-handle” breakout in 2024 kick-started the move.
• Outlook: Street base cases cluster near $4,000 by mid-’26; several houses now publish $4,900–$5,000 stretch targets into 2026 as flows accelerate.
________________________________________
🏆 Historic Gold Bull Markets — Timeline & Stats
1. 1968–1980 “Super Bull”
• Start/End: ~$35 → $850 (Jan 1980)
• Gain: ~2,330%
• Drivers: End of Bretton Woods, oil shocks, double-digit inflation, geopolitical stress.
• Drawdown: ~–45% (1974–1976) before the final blow-off run.
2. 1999–2011/12
• Start/Peak: ~$252 (1999) → ~$1,920 (2011–12)
• Gain: ~650%
• Drivers: Commodities supercycle, EM demand, USD weakness, GFC safe-haven bid.
3. 2016/2018–Present (The “CB-Led” Cycle)
• Start Zone: $1,050–$1,200 → New ATH $3,790 (Sep 2025)
• Gain: ~215–260% (depending on 2016 vs 2018 anchor)
• Drivers: Record central-bank accumulation, sticky inflation/low real rates, geopolitics; 2024 13-yr base breakout.
________________________________________
📊 At-A-Glance Comparison (Updated 2025)
Metric | 1968–80 Super Bull | 1999–2012 | 2016/18–2025 Current
🚀 Total Gain | ~2,330% | ~650% | ~215–260% (so far)
⏲️ Duration | 12 yrs | 13 yrs | 7–9 yrs (ongoing)
💔 Max Drawdown | ~–45% (’74–’76) | ~–30% (’08) | ~–20% (2022)
🏦 Main Buyer | Retail/Europe | Funds/EM | Central Banks
🏛️ Pattern | Secular parabolic | Cyclical ramps | 13-yr base → breakout (’24)
Notes: current-cycle characteristics validated by WGC demand trends & the 2024 technical breakout.
________________________________________
________________________________________
________________________________________
🔄 What Makes This Bull Different 2025 Edition
• 🏦 Central-Bank Dominance — Third consecutive 1k+ tonne year in 2024; 2025 is still tracking strong on a run-rate basis. This “sticky” demand is from price-insensitive reserve managers.
• ⚡ Faster Recoveries — Drawdowns are shallower/shorter vs the 1970s analog, consistent with a structural rather than speculative buyer base.
• 📈 Coexisting With Risk Assets — ATHs with equities positive YTD = macro hedge + diversification bid, not just “panic buying.”
• 📐 Structural Breakout — 13-yr base cleared in 2024; market now in multi-year price discovery.
________________________________________
🎯 Strategy Ideas 2025 & Beyond
• Buy/Hold on Dips: Stagger entries (DCA) into physical (allocated), ETFs (e.g., GLD/IAU), and quality miners/royalties.
• Prefer Physical/Allocated where counterparty risk matters; use ETFs for liquidity and tactical tilts.
Satellite/Leverage
• Silver & GSR Mean-Reversion: With GSR ~85–88, silver historically offers torque in up-legs. Pair with high-quality silver miners.
• Factor Tilt in Miners: Prioritize low AISC, strong balance sheets, reserve growth, rule-of-law jurisdictions; emphasize free-cash-flow yield and disciplined capex.
Risk-Management
• Define max drawdown per sleeve; pre-plan trims near parabolic extensions or if macro invalidates (e.g., real-yield spike).
• Use options overlays (collars on miners; long-dated calls on physical proxies) to shape payoff in Wave-3 late innings and Wave-4 digestion.
________________________________________
🧪 Reality Check: What Could Invalidate the Bull?
• Real yields + USD rip higher (sustained) → compress gold’s opportunity cost.
• Official-sector buying stalls (policy or FX-reserve shifts) → removes the anchor bid.
• Growth re-acceleration + faster-than-expected disinflation → weaker safe-haven + fewer rate cuts.
• Technical break: a persistent move below ~$3,600–3,700 would question Wave-3 extension and pull forward Wave-4.
________________________________________
🧭 Quick Reference Tables
🧾 Summary: Historic vs Current
Feature | 1968–80 | 1999–2012 | 2016/18–2025
Total Gain | ~2,330% | ~650% | ~215–260%
Duration | 12 yrs | 13 yrs | 7–9 yrs (ongoing)
Correction | ~–45% | ~–30% | ~–20% (’22)
Main Buyer | Retail/Europe | Funds/EM | Central Banks
Pattern | Parabolic | Cyclical | Cup & Handle → Secular
🧩 “If-This-Then-That” Playbook
• If real yields fall & CB buying persists → Ride trend / add on consolidations.
• If USD + real yields jump → Trim beta, keep core hedge.
• If GSR stays >80 with silver momentum → Overweight silver sleeve for torque.
________________________________________
🔚 Key Takeaways Updated
• Twin pillars: relentless official-sector demand + 2024 structural breakout.
• Base case: Street ~$3.7–4.0k by mid-’26 with upside to $4.5–5.0k on accelerated private/ETF rotation.
• Roadmap: Extend Wave-3 → Wave-4 re-accumulation (~12 months) → Wave-5 to $5,000–$5,500, then $7,500–$8,000 by 2030–2032 under favorable macro/flow dynamics.
• Operating stance: keep core, add on dips/sideways phases, manage beta and drawdowns proactively.

Gold Analysis – Volatility Rules the GameYesterday marked another strong bullish session for Gold, as the price completely erased Friday’s losses, confirming that buyers are far from done. Regardless of how high the market has already climbed, momentum remains firmly on the bullish side.
Technically, Gold managed to reclaim and break above the 4285–4300 resistance zone, which triggered a sharp acceleration toward the recent all-time high around 4380.
At the time of writing, the market is undergoing a normal retracement, which is a healthy technical reaction after such an aggressive move. The 4300 area has now turned into key short-term support, and as long as bulls defend this level, the probability of a new ATH remains high.
From a trading perspective, however, volatility has reached extreme levels. This type of price action often favors large players with fundamental reasons rather than discretionary traders. For that reason, I prefer to stay on the sidelines today, waiting for volatility to stabilize before engaging again.

GOLD surges on political uncertainty and Fed easing expectationsOANDA:XAUUSD climbed to a fresh record high in the first trading session of the week, as expectations of an extended rate-cutting cycle by the Federal Reserve (Fed) and a wave of safe-haven assets continued to strengthen the rally.
Spot gold ended the session on Monday (October 20) up 2.47%, equivalent to $104.81, at $4,355.72/ounce, its biggest one-day gain since July. The recovery came after a correction last weekend, when the yield on the 10-year US Treasury bond fell two basis points to 3.991%, dragging the USD down. The US real yield, a measure reflecting the opportunity cost of holding gold, also fell to 1.723%.
The rally suggests the market is “repositioning expectations” as the Fed is expected to maintain its easy policy for the rest of the year. Investors now see a 96% chance of another 50 basis point cut by the end of 2025, according to CME FedWatch data.
In addition to monetary policy factors, the political picture in Washington has also contributed to the demand for gold. The US government entered the 20th day of a partial shutdown, with Congress still unable to reach a budget deal. This situation has delayed important economic data, including the September Consumer Price Index (CPI), clouding the economic picture ahead of the Fed’s policy meeting next week.
Global geopolitical risks continue to play a central role. Fighting between Israel and Hamas in the Gaza Strip has flared up again, threatening to unravel the recently signed ceasefire. Meanwhile, US-China trade talks are set to resume in Malaysia as the November 10 trade war truce deadline approaches. US President Donald Trump is expected to increase pressure on Beijing to cut fentanyl exports and resume soybean imports.
Personally, I believe that the combination of political, interest rate and global trade concerns is pushing gold back to the center of the international financial market. Gold prices could approach $4,500/ounce in the short term, and the possibility of reaching $5,000/ounce next year if political tensions continue to escalate.
With a gain of more than 62% since the beginning of the year, gold is currently the best performing asset among major commodities. The main drivers are strong central bank buying, the trend of de-dollarization of foreign exchange reserves and capital flows into Western gold ETFs.
Amid widespread political uncertainty and a dovish US monetary policy, gold appears to be resuming its historic role as not just a safe haven, but a measure of global confidence in the current financial system.
Technical Analysis OANDA:XAUUSD
Gold's medium-term uptrend remains strong within the uptrend channel, despite a short-term correction around the historical peak of $4,379/ounce. The candle on October 21 showed slight technical selling pressure after a long rally, but the price structure is still above the 21-day moving average (MA21) and has not broken the main uptrend channel.
The Fibonacci correction zones show that the important support levels are located at:
• 4,289 – 4,213 USD/ounce (Fibo 0.236–0.382): the nearest support zone, where buying pressure can return.
• 4,161 USD (Fibo 0.5): the balance level, which also coincides with the previous short-term bottom.
• 4,110 USD (Fibo 0.618): the important support level to preserve the medium-term uptrend.
The RSI is still above 70, reflecting the market in the overbought zone but there is no clear bearish divergence signal. This shows that there is a possibility of a short-term technical correction, but there is not enough sign for a trend reversal.
Overall, the main uptrend is still dominant, with the next target at 4,454 - 4,527 USD/ounce (Fibo extension zone 0.618 - 0.786).
If the price breaks through the 4,110 USD area, the bullish pattern will be temporarily invalidated, then we should observe the reaction around MA21 (~3,940 USD).
Comment: Gold is still in the "trend stability phase" with corrections considered as opportunities for re-accumulation, not reversal signals. Short-term investors should take advantage of technical recovery to optimize entry points, while closely controlling the risk zone below 4,110 USD.
SELL XAUUSD PRICE 4452 - 4450⚡️
↠↠ Stop Loss 4456
→Take Profit 1 4444
↨
→Take Profit 2 4438
BUY XAUUSD PRICE 4300 - 4302⚡️
↠↠ Stop Loss 4296
→Take Profit 1 4308
↨
→Take Profit 2 4314

GOLD leveled off after its strongest rally since 1979OANDA:XAUUSD Falls After Trump's 'Softening' Comments on China
Gold Spot gold fell nearly 2% on Friday (October 17), ending a long rally after hitting a new record, as a stronger US dollar and President Donald Trump's soft remarks dampened demand for safe-haven assets.
Spot gold ended the session at $4,250.91 an ounce, down 1.74%, after peaking at $4,379.94 earlier in the session. The US dollar index rose 0.2%, making gold more expensive for foreign investors. Earlier, gold recorded its biggest weekly gain since the Lehman Brothers crisis in 2008.
Trump Calms Trade Tensions, Gold Loses Safe-haven Momentum
Speaking at the White House, Trump admitted that 100% tariffs on Chinese goods were “unsustainable” and confirmed plans to meet President Xi Jinping in the near future. The comments quickly changed market sentiment, easing expectations of an escalation in the trade conflict and pulling safe-haven demand away from gold.
FXStreet commented: “Gold prices fell about 2% from a historic peak as Trump eased his tone with Beijing. The recovery in risk sentiment kept the dollar strong and gold under pressure.”
The yield on the 10-year US Treasury note rose 3 basis points to 4.01%, while real yields rose nearly 2.5 basis points to 1.72%, further pressuring non-yielding assets like gold.
Medium-term outlook remains positive
Despite the short-term correction, gold prices have risen more than 64% year-to-date, boosted by expectations that the Federal Reserve will begin a rate-cutting cycle. The market is now pricing in a 25 basis point cut at its October meeting, and another in December.
HSBC has raised its 2025 average gold price forecast by $100 to $3,455 an ounce, and expects prices to reach $5,000 by 2026.
Some fresh concerns about credit risks emerged after two regional US banks reported $50 million in bad loans, but White House Senior Advisor Kevin Hassett reassured that the banking system remains liquid and “credit conditions are generally stable.”
Goldman Sachs: Gold Price Rally “Real-Based,” Not Speculative Bubble
Gold prices continued to hit records this week, surpassing $4,300 an ounce on October 16, marking a four-session winning streak and a gain of about 65% year-to-date, the strongest since 1979. However, according to Goldman Sachs Group Inc., this is not a speculative frenzy, but reflects real demand from institutions and central banks.
“The current momentum in gold is not driven by euphoria,” Goldman Sachs said in a video conference. “Central banks continue to buy at record levels, while private investors are only gradually rebalancing their portfolios as the Fed accelerates the pace of rate cuts.”
After years of low asset allocations to gold, the market is now returning to a more reasonable balance, not a “gold bubble,” Goldman Sachs said.
Goldman Sachs raised its December 2026 gold price forecast from $4,300 to $4,900 an ounce, highlighting two key drivers: strong inflows into Western gold ETFs and sustained net buying by central banks, particularly in Asia and the Middle East.
Echoes of the 1970s: History Repeats in a New Way
Let’s compare the current cycle to the “gold rush” of the 1970s, when the US ended the Bretton Woods system, inflation soared and the oil crisis pushed the price of gold many times higher.
“Back then, budget deficits and policy uncertainty led investors to seek refuge outside the official monetary system. And now, similar factors are emerging, from US fiscal risks to geopolitical divergence, making gold continue to be a popular hedge.”
According to Goldman Sachs, the gold market is still relatively small compared to the scale of global capital flows, so each shift in capital flows greatly amplifies price fluctuations.
Technical outlook analysis of OANDA:XAUUSD
The daily chart of gold is still in a medium-long term uptrend, as shown by the price remaining above the MA21 and still in the uptrend channel despite the correction. After reaching a historical peak of 4,379, the price has dropped to around 4,250 USD/ounce, corresponding to the Fibonacci retracement level of 0.382.
• Current candlestick structure: a strong correction candle appears but has not broken the bullish structure.
• Important technical support zones:
o 4.216 – 4.160 (Fibo 0.382 – 0.5): potential short-term support zone.
o 4.110 (Fibo 0.618): stronger support, if this zone is broken, it can move into a deep correction phase.
• RSI: still above 70, showing that the market is still in the overbought zone, prone to strong short-term fluctuations but has not confirmed a reversal.
=> Conclusion of the main trend: Gold is still in the main uptrend, currently only in a technical correction phase after reaching the peak, there is no signal of a medium-term reversal.
SELL XAUUSD PRICE 4309 - 4307⚡️
↠↠ Stop Loss 4313
→Take Profit 1 4301
↨
→Take Profit 2 4295
BUY XAUUSD PRICE 4160 - 4162⚡️
↠↠ Stop Loss 4156
→Take Profit 1 4168
↨
→Take Profit 2 4174

AUDUSD FREE SIGNAL|SHORT|
✅AUDUSD price will soon enter the supply zone and may show a corrective reaction. A short-term pullback could confirm the retest, aligning with the next downside target near 0.6500. Time Frame 2H.
SHORT🔥
✅Like and subscribe to never miss a new idea!✅
