XRP Bulls Are Back, Double Bottom + Divergence Signal Uptrend
XRP , After failing to break the previous low, which acted as a strong support at $2.7280, XRP has formed a Double Bottom pattern. This is a powerful bullish signal expected to push the price higher.
The price is currently rising to test the daily descending trendline shown in the chart, with a potential target of the $3.04000 zone. The bullish move is also confirmed by a Divergence pattern on the daily chart.
Additionally, the daily RSI shows an overbought signal, which can be a sign of strong buying pressure. This movement is also supported by the overall daily uptrend illustrated in the chart.
🔔 Summary:
Key Factors Supporting an Upside Move
Double Bottom Pattern
Daily Divergence
Uptrend
Daily RSI Overbought Signal
✅ Write a comment with your favorite altcoin hit the like button, and I'll provide my analysis in the reply. Trading is simpler with the right coaching.
My analyses are personal opinions, not trade setups.
Thank you for your support, and I wish you successful trades 🌹
Signalservice

Lingrid | HBARUSDT Breaking Higher - Continuation PatentialThe price perfectly fulfilled my previous idea . BINANCE:HBARUSDT has rebounded strongly from the bottom near 0.2100 and is now pressing against the downward trendline, showing signs of recovery momentum. The breakout attempt above 0.2439 signals growing bullish pressure, with buyers targeting the resistance zone around 0.2757. If price sustains above the breakout level, a continuation rally is likely as the broader structure shifts from accumulation to trend reversal. The pattern highlights strength after prolonged consolidation, with bulls aiming to challenge overhead resistance.
💡 Risks:
Failure to hold above 0.2439 could trigger a pullback, sending price back toward 0.2104 support.
A sharp decline in Bitcoin or major altcoins could drag HBAR lower despite technical strength.
Negative crypto market sentiment or regulatory news could weigh on buying momentum and stall the breakout.
If this idea resonates with you or you have your own opinion, traders, hit the comments. I’m excited to read your thoughts!

NASDAQ | H2 Double Top | GTradingMethodHello Traders! 👋
🧐 Market Overview:
CPI is out today — and it could be the spark the NASDAQ needs. Price is stalling at the previous all-time high, and that’s where I’m watching closely.
I’ve been tracking a double top on the daily for a while now, and today the H2 chart is starting to show the same structure. That kind of multi-timeframe alignment doesn’t happen often.
📊 Trade Plan:
I’ve entered a starter short on the daily structure. If the H2 confirms, I’ll scale in with a second position.
Risk/Reward:
Entry:
Stop Loss:
Take Profit 1 (50%):
Take Profit 2 (50%):
💡 GTradingMethod Tip:
Double tops work best when paired with other signals. In my system, I look for:
- RSI negative divergence
- Lower volume on the second top
- A confirmation candle close within my entry range
This reduces false signals and adds conviction.
🙏 Thanks for reading! Do you trade double tops?
📌 Disclaimer:
This is not financial advice. This content is to track my trading journey and for educational purposes only.

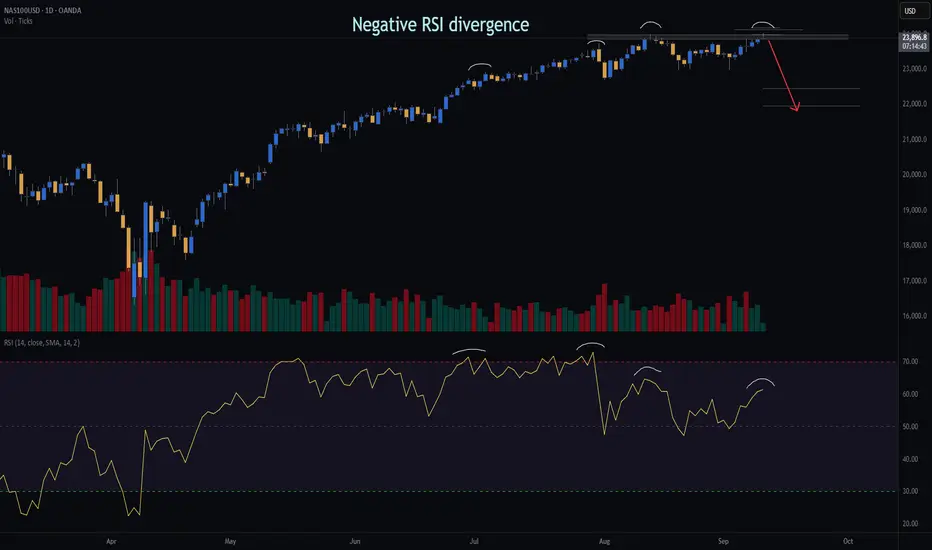
NASDAQ | Daily Double Top | GTradingMethodHello Traders 👋
🧐 Market Overview:
I’ve opened a short on the NASDAQ based on a clear double top setup that formed yesterday. Several of my key variables aligned, giving this trade a high-probability edge:
Negative RSI divergence → showing weakening buying momentum
Lower volume on the second top → indicating exhaustion
Daily candle closure within threshold → confirming structure validity
📊 Trade Plan:
RR: 9.1
Entry: 23 931
Stop Loss: 23 178
Take Profit 1 (50%): 22 453
Take Profit 2 (50%): 21 969
💡 GTradingMethod Tip:
When trading reversal patterns like double tops, I always wait for confirmation across multiple variables (momentum, volume, candle structure). This increases probability and reduces false entries.
🙏 Thanks for checking out my post!
Follow me for more setups and let me know — do you see this double top holding, or is there more upside left in the NASDAQ?
📌 Disclaimer:
This is not financial advice. This content is to track my trading journey and for educational purposes only.
COST Costco Wholesale Corporation Options Ahead of EarningsIf you haven`t bought COST before the rally:
Now analyzing the options chain of COST Costco prior to the earnings report this week,
I would consider purchasing the 970usd strike price Calls with
an expiration date of 2025-9-19,
for a premium of approximately $8.85.
If these options prove to be profitable prior to the earnings release, I would sell at least half of them.
Disclosure: I am part of Trade Nation's Influencer program and receive a monthly fee for using their TradingView charts in my analysis.

Gold Analysis – Is the Correction Over?Yesterday I maintained my bias that OANDA:XAUUSD correction could extend lower, with 3570 as the focus for the next swing low. I even sold rallies above 3640 zone with that scenario in mind.
However, after the CPI release, Gold dipped to 3620 zone but quickly recovered. That prompted me to lock in a modest 100 pips gain rather than fight the market.
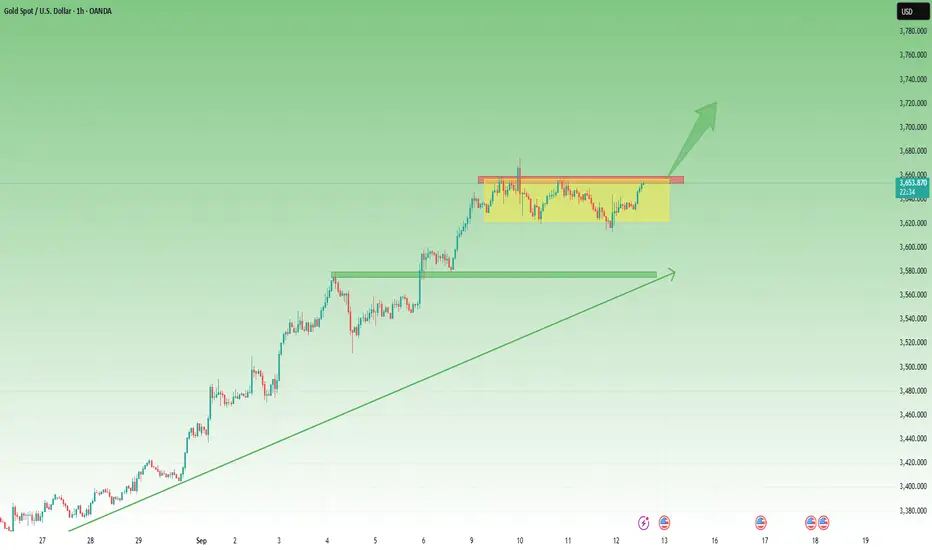
A wise move in hindsight, since Gold is now back testing the 3650+ resistance zone.
So, is the correction finished?
➡️ Most probably, yes.
Here’s why:
• Bulls are defending the 3620 zone, stepping in strongly on dips.
• The chart is shaping into a rectangle, typically a continuation pattern, which suggests consolidation before trend resumption.
• Momentum is aligning again with the broader bullish trend.
Trading Plan:
• As long as 3620 holds, my strategy shifts to buying dips instead of selling rallies.
• A break above 3660 would open the path for continuation, with 3700 as the next bullish milestone.
The market has spoken – the correction seems to be losing steam, and the trend is ready to reassert itself. 🚀
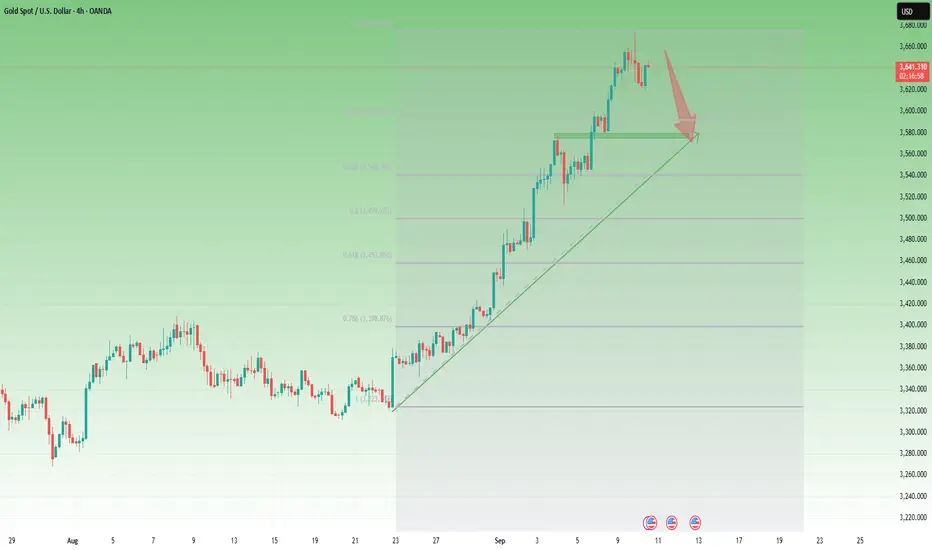
Gold | H4 Double Top | GTradingMethodHello Traders,
🧐 Market Overview:
Over the last 3 weeks, gold has rallied just under 10% — a massive move. While my longer-term outlook remains bullish, my system is currently flagging a potential short. On the 4-hour chart, a double top pattern is forming, signaling a possible pullback.
My system looks for rsi divergence, which is currently present. It also needs to see lower volume on the second top, also already confirmed.
My system has given the green light for opening a short. Now I am just waiting for a good entry point. Time to be patient and follow all my rules.
📊 Trade Plan:
Risk/Reward: 3.5
Entry: 3 664.5
Stop Loss: 3 691.4
Take Profit 1 (50%): 3 592
Take Profit 2 (50%): 3 551
💡 GTradingMethod Tip:
Trading is about probability. This means I need to take every single trade when my edge is available. It also means I need to follow my rules on every single trade.
🙏 Thanks for checking out my post!
Follow me for more setups and let me know — do you think gold will respect this double top or continue its bullish momentum?
📌 Disclaimer:
This is not financial advice. This content is to track my trading journey and for educational purposes only.

Lingrid | GOLD Correction Phase - Momentum Cooling Off ?OANDA:XAUUSD has reached the resistance zone near 3,650, stalling after a strong bullish run within the upward channel. The chart shows a clear top formation, with sellers defending this area and hinting at a potential corrective move. If gold fails to break and hold above 3,650, price could retrace toward 3,546 as the next key support. The overall structure still favors bulls in the longer term, but near-term momentum points to a pullback phase. Consolidation here may also depend on upcoming economic data.
💡 Risks:
A weaker-than-expected US CPI or labor data release could reignite strong buying and push gold beyond 3,650.
Geopolitical tensions may drive safe-haven demand, supporting further upside despite technical rejection.
A dovish Fed shift could restore bullish flows, reducing the likelihood of a sustained correction.
If this idea resonates with you or you have your own opinion, traders, hit the comments. I’m excited to read your thoughts!

Lingrid | TONUSDT Trendline Break - Correction Phase Over ?OKX:TONUSDT has formed a double-bottom structure near the 3.00 support level, signaling exhaustion of the prior bearish trend. Price action shows a potential breakout attempt from the downward trendline, with price holding above 3.10 and pressing higher. If buyers sustain momentum, an extension toward 3.335 becomes the next target, reinforcing a reversal scenario. The broader pattern suggests accumulation after prolonged selling, with bulls aiming to reclaim control. Confirmation will strengthen if price continues to close above the broken trendline.
💡 Risks:
Failure to hold above 3.10 may trigger another retest of 3.00, invalidating the breakout attempt.
Negative sentiment in the broader crypto market could stall recovery and force renewed selling.
Regulatory or liquidity concerns tied to TON could limit upside and fuel volatility despite technical signals.
If this idea resonates with you or you have your own opinion, traders, hit the comments. I’m excited to read your thoughts!

Bitcoin - The Whales are Selling at This Strong Resistance 115K$BTC Current Market Update
The coin is now facing a very strong resistance around $115K .
This presents a great short opportunity .
After carefully monitoring buy and sell orders on-chain, I noticed a strong confirmation for the short setup:
Whales and Market Makers sell orders are clustered heavily around the 115,000 resistance zone.
✅ My Personal Strategy:
Short Entry: 115,000
🎯 Target 1: 114,000
🎯 Target 2: 113,600
Please note:
This is not financial advice – I’m only sharing my personal trades.
Always do your own research before taking action.
👍 Don’t forget to like if you found this useful, and feel free to follow me for more analysis of this kind.
Best of luck 🌹

XAUUSD Bears Hold the Line at 3650 zone – Next Stop 3570?In yesterday’s analysis, I mentioned that in my view, OANDA:XAUUSD ’s correction is not yet complete and that we could be inside an unfolding ABC-type structure. I also suggested that the 3650 zone should be the main focus for bears.
Indeed, price rallied into that zone, consolidated in a small distribution phase, and then started to roll back down again.
At the time of writing, gold is trading at 3632, after retesting the 3623 recent low, which now acts as short-term support.
Looking forward, my idea remains unchanged: I expect another leg down, with 3570 as the next major target. For now, the 3650–3660 area acts as a strong ceiling, and if we look closely, one could even argue a potential double top is forming—if we discount the 3674 spike that marked the ATH.
On the other hand, a stabilization above 3660 would invalidate this bearish scenario and open the door for a new ATH. 🚀

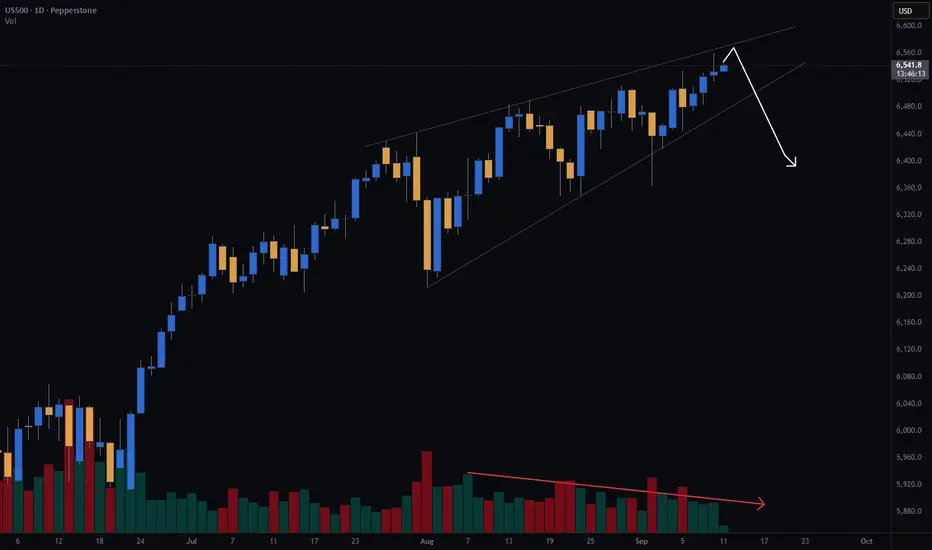
S&P500 | Daily rising wedge | GTradingMethodGood morning fellow traders,
S&P price action is tightening inside a rising wedge on the daily chart, with volume steadily dropping.
Rising wedges often signal potential reversals, but with CPI on deck, volatility could go either way.
My guess, price tests top of rising wedge, finds resistance and down we go - a long way down.
Keen to hear your thoughts on whether CPI is going to be a catalyst for a breakout or breakdown?
USDJPY: Tight Range, Big Breakout Coming – Bulls Eye 150.80In recent weeks, USDJPY has been one of the most frustrating pairs to trade.
Since early August, the pair has fluctuated inside a very narrow range between 146.70 and 148.50 — less than 1.5% of movement.
However, such tight consolidations rarely last. They usually precede strong moves, and in my opinion, this breakout is more likely to come to the upside.
Looking at the broader picture:
• The April low around 140 (which also tested September last year’s low) marked a strong structural support.
• From there, the pair began climbing in a constructive way, consistently putting in higher lows on the long-term chart.
• During the current consolidation, we’ve seen two notable bullish reactions: dips slightly below 147.70 were bought aggressively on 14 August and again just two days ago, leaving behind clean bullish pin bars on the daily chart.
Putting these pieces together, my bias is bullish. I expect the current range to eventually resolve higher, with 150.80 as the next major resistance and natural target for bulls.
That being said, the market still needs to confirm this idea:
• Upside acceleration comes with a clear break above 148.50.
• The bullish case would be invalidated by a daily close below 146.50.
As always, patience is key — range markets test our discipline, but they also prepare the ground for the next big move. 🚀

Lingrid | XRPUSDT Bullish Channel Break - Upside PotentialBINANCE:XRPUSDT has rebounded from the range zone and is now holding above the upward trendline, showing early signs of renewed bullish momentum. The structure highlights a breakout from the falling wedge pattern, suggesting potential continuation higher if buyers defend current levels. A push above 3.10 could accelerate gains toward the 3.25 resistance target, with further extension possible into the 3.37 zone. As long as the price holds above 2.90, the bias remains tilted to the upside with accumulation supporting the move.
💡 Risks:
A breakdown below 2.90 would negate the bullish setup and reopen downside toward 2.75 support.
Negative sentiment in the broader crypto market could stall the breakout and trigger renewed selling.
Regulatory pressure or legal developments tied to XRP could weigh on demand despite technical strength.
If this idea resonates with you or you have your own opinion, traders, hit the comments. I’m excited to read your thoughts!

Hellena | SPX500 (4H): LONG to resistance area of 6600.Colleagues, the main idea is still the upward movement in the impulse of the middle wave “5”.
Wave “4” is likely to take place, because the bulls need to gain strength to update the local maximum of 6512.
The most important thing here is that the target of 6600 is a round number, which is quite attractive for buyers and limit sellers.
Manage your capital correctly and competently! Only enter trades based on reliable patterns!

BTC – Base Before Break?After the ATH at 125k on 25 Aug, BTC pulled back to 107k and has been consolidating. The latest structure looks more like a base for reversal than a continuation pattern: price is back into the 113.3k zone, which coincides with resistance, and we’ve printed a sequence of higher lows—a classic pressure build under supply.
What I’m watching
• Bullish trigger: A clean break/close above 113.3k opens the path toward 120k (both a technical target and a psychological level).
• Continuation potential: If 120k is reclaimed with momentum, a 123–125k retest comes into play.
• Support: 110k is the line in the sand; below it, risk shifts to 100k zone (the correction low).
Trading plan
• Breakout: Look for acceptance above 113.5k and a successful retest to validate upside toward 120k.
• Buy-the-dip zone: If we pull back, watch 111–112k for signs of bid absorption and continuation.
Bias: I’m bullish while 110k holds. A failure below 110k would likely send us back to 107k and even 100k.

Gold Analysis – Correction Not Yet Over (IMO)Yesterday, after printing a new ATH at 3674, Gold sold off aggressively and overnight reached a low of 3620.
Now the key question: Is Gold done correcting?
👉 My answer: Not yet.
Here’s why:
1. The 550 pip drop from the top is barely scratching the surface compared to the 3500 pip rally in the last two weeks.
2. Yesterday’s daily candle is a bearish pin bar. While this pattern is weaker in strong uptrends, it can still trigger continuation.
3. Structurally, the market looks like it’s forming an ABC correction. The current rebound may be wave B, with wave C expected to target the 3570 zone.
4. Confluence supports act like magnets once corrections begin. The zone I’m watching aligns with the 23% Fibonacci retracement, which fits perfectly with the correction scenario.
📌 Trading Plan:
As long as 3675 holds, I remain bearish in the short term. The best strategy is to sell rallies against the ATH, targeting deeper retracement levels.
BNB Strong Resistance Meets Whales Sell Orders – A Good Short BNB Current Market Update
The coin is now trading at its All-Time High , facing a very strong resistance around $900 .
This presents a great short opportunity .
After carefully monitoring buy and sell orders on-chain, I noticed a strong confirmation for the short setup:
Whales and Market Makers sell orders are clustered heavily around the $888 – $890 resistance zone.
✅ My Personal Strategy:
Short Entry: Resistance zone between $888 – $890
🎯 Target 1: $876
🎯 Target 2: $873
Please note:
This is not financial advice – I’m only sharing my personal trades.
Always do your own research before taking action.
👍 Don’t forget to like if you found this useful, and feel free to follow me for more analysis of this kind.
Best of luck 🌹

S&P | 30min Double Top | GTradingMethodHello Traders 👋
🧐 Market Overview:
The S&P has been pushing into new highs, but a potential double top is forming right at diagonal resistance. This is a key level for me — the confluence of structure and resistance makes this an area worth watching closely.
If the double top holds, price might first deviate through my entry range and then retest the diagonal resistance. For me to take a short, I’ll be looking for a 30-minute candle close back within the range as confirmation.
📊 Trade Plan:
RR: 3.5
Entry:6 537.4
Stop Loss: 6 543.8
Take Profit 1 (50%): 6 515
Take Profit 2 (50%): 6 511
💡 GTradingMethod Tip:
When trading double tops, I always wait for confirmation (like a close back within range). It reduces false entries and adds probability to the trade.
🙏 Thanks for checking out my post!
Follow me for more setups and let me know — do you think this double top will hold, or will the S&P push through resistance to fresh highs?
📌 Disclaimer:
This is not financial advice. This content is to track my trading journey and for educational purposes only.

Gold | H1 Head and Shoulders | GTradingMethodHello Traders 👋
We’re finally getting a clean pattern to short Gold on.
🧐 Market Overview:
The chart is showing signs of exhaustion. We already have negative RSI divergence and decreasing volume on the right shoulder — both pointing to weakening buying momentum. I’m still waiting for confirmation before fully committing, but the setup is looking solid.
📊 Trade Plan:
Risk/Reward: 4.0
Entry: 3640.77
Stop Loss: 3652.5
Take Profit 1 (50%): 3602.4
Take Profit 2 (50%): 3581.5
💡 GTradingMethod Tip:
When trading reversal patterns like head & shoulders, volume is key. A drop in volume on the right shoulder often strengthens the case for a potential move lower.
🙏 Thanks for checking out my post!
Make sure to follow me to catch the next setup and let me know what you think — will this H&S confirm, or does Gold still have room to push higher?
📌 Disclaimer:
This is not financial advice. This content is to track my trading journey and for educational purposes only.

EURUSD – Weakness Ahead?For over a month, EURUSD has been stuck in a choppy range:
• Support: 1.1580 zone
• Resistance: just above 1.1700
As always, such tight consolidations usually precede strong moves. The question is: which way?
🔑 Factors pointing lower:
1. On the DXY, I expect a potential upside reversal – most bad news is already priced in.
2. Yesterday’s reaction to the NFP revision → USD strength, not weakness, which confirms the shift in sentiment.
3. A false break above resistance on EURUSD adds to the bearish case.
📌 Conclusion:
I expect further EURUSD weakness, with confirmation if the price breaks below 1.1650.

Lingrid | AUDUSD Major Resistance Short - Monthly LevelThe price perfectly fulfilled my previous idea . FX:AUDUSD has rallied strongly from the double-bottom formation near 0.6460 and is now testing the resistance zone around 0.6627. The market structure shows bullish momentum fueled by a breakout from the triangle pattern, lifting price toward prior highs. Price action is stalling at the upper boundary, where sellers may look to fade the move, opening potential retracement back toward 0.6550. If buyers defend that zone, another attempt at resistance could follow, but failure there may shift momentum in favor of sellers. The broader setup suggests a battle between trend continuation and near-term exhaustion.
💡 Risks:
A stronger-than-expected US PPI could boost the dollar and push AUDUSD lower.
A dovish RBA stance or weak Australian economic data may undercut recent bullish momentum.
Global risk sentiment shifts, particularly weakness in equities or commodities, could weigh on AUD demand.
If this idea resonates with you or you have your own opinion, traders, hit the comments. I’m excited to read your thoughts!

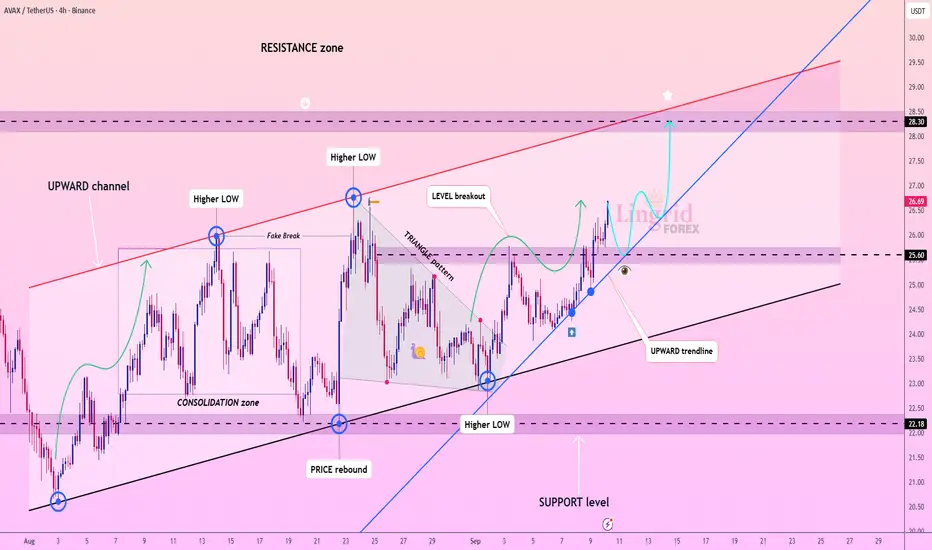
Lingrid | AVAXUSDT Upside Momentum Building. Potential SurgeBINANCE:AVAXUSDT is trending inside a well-defined upward channel, supported by higher lows and a clean breakout above the 25.50 level. The market structure shows consolidation breaks and triangle formations resolving higher, signaling continuation of bullish pressure. Current momentum suggests buyers could drive price toward the 28.30 resistance zone if the upward trendline continues to hold. Any retest of 25.60 is likely to act as a springboard for further gains within the channel. The overall setup reflects sustained bullish sentiment aiming for higher levels.
💡 Risks:
A breakdown below 25.00 could trap buyers and send price back toward 22.00 support.
Regulatory headlines targeting crypto markets may trigger sudden volatility and selling pressure.
Sharp declines in Bitcoin or Ethereum could weigh on broader altcoin sentiment and stall AVAX’s uptrend.
If this idea resonates with you or you have your own opinion, traders, hit the comments. I’m excited to read your thoughts!