Lingrid | GOLD Possible Rebound Expected from Support ZoneOANDA:XAUUSD perfectly played out my previous trading idea . The market has retraced sharply from the upper boundary of the ascending channel, driving price directly into a major confluence zone near 4,880. This area blends horizontal demand with the rising trendline support, where buyers previously stepped in aggressively. The recent selloff looks impulsive, yet the structure still preserves higher lows within the broader upward framework.
If bulls manage to stabilize above this base, a rebound toward higher levels could unfold first, with potential continuation toward 5,130 near the channel ceiling. The slope of the long-term trendline suggests that momentum might gradually rebuild if price maintains acceptance above support.
➡️ Primary scenario: hold above 4,920 → extension toward 5,130.
⚠️ Risk scenario: decisive breakdown below 4,880 may invalidate the rebound setup and expose 4,800 next.
If this idea resonates with you or you have your own opinion, traders, hit the comments. I’m excited to read your thoughts!
Signalsprovider

Lingrid | USDCHF Corrective Move Against Bearish TrendOANDA:USDCHF is climbing within a short-term pullback channel, but the broader structure remains capped by a dominant bearish trend. The recent advance appears to be a corrective bounce rather than a structural reversal, as price is approaching dynamic resistance near 0.7740. This zone aligns with the upper boundary of the larger bearish channel, where prior distribution phases developed.
If upside momentum stalls beneath that ceiling, the pair could resume its prevailing downward trajectory toward 0.7644 initially, with a potential extension toward horizontal demand and lower channel. Failure to break and sustain above the descending trendline would likely reinforce the bearish framework.
➡️ Primary scenario: rejection from 0.7740 → decline toward 0.7644.
⚠️ Risk scenario: sustained acceptance above 0.7740 may weaken the bearish outlook and expose 0.7800 next.
If this idea resonates with you or you have your own opinion, traders, hit the comments. I’m excited to read your thoughts!

Lingrid | GOLD Weakening Price Action Suggests ExhaustionOANDA:XAUUSD has been respecting the upward channel, but recent price action shows signs of exhaustion as the market approaches the upper boundary of the channel. The recent rally has failed to break through the key resistance zone, forming a lower high. This suggests that the bullish momentum is weakening, and sellers may begin to take control. A pullback is likely as the market tests support near the bottom of the channel.
If sellers step in at the resistance zone above 5,100, price could fall back toward lower levels, potentially reaching the 4,880 support area. This could lead to further downside movement if the lower support fails to hold.
➡️ Primary scenario: rejection at 5,100 → pullback to 4,880 support.
⚠️ Risk scenario: a clean breakout above channel would invalidate the bearish bias and could lead to a test of higher resistance at 5,200.

Lingrid | TONUSDT Market at Key Resistance - Potential ShortOKX:TONUSDT perfectly played out my previous trading idea . Price is testing upper boundary of a well-defined descending channel, where multiple prior reactions have emerged. The recent advance appears corrective rather, climbing into a confluence of dynamic resistance and horizontal supply near 1.40–1.42. Structure still reflects a sequence of lower highs on the broader slope, suggesting that upside attempts may be vulnerable if sellers defend this region.
If price fails to secure acceptance above the channel lid, it could rotate lower toward 1.33 first, with a deeper slide potentially extending toward lower levels. That diagonal base may act as the next liquidity pocket should bearish pressure accelerate.
➡️ Primary scenario: rejection from 1.40–1.42 → continuation toward 1.33.
⚠️ Risk scenario: sustained breakout above 1.42 could invalidate the short bias and shift momentum toward 1.48.
If this idea resonates with you or you have your own opinion, traders, hit the comments. I’m excited to read your thoughts!

Lingrid | EURUSD Bullish Continuation After ConsolidationFX:EURUSD perfectly played out my previous trading idea . The market has been consolidating after a period of compression within a downward channel. The most recent move shows a breakout from the consolidation zone, potentially indicating the start of an upward swing. The price is currently testing the support level near 1.18500, and this zone could provide an excellent entry point for a potential bullish rally.
If the price manages to maintain above the support zone and break the upper boundary of the consolidation, the next key target is around 1.19270, where a new bullish leg could unfold. The trend appears to be shifting upwards, so the breakout might lead to further price acceleration.
➡️ Primary scenario: Bounce from 1.18400 → toward level at 1.19270.
⚠️ Risk scenario: Failure to hold above 1.18400 might lead to a deeper correction, invalidating the bullish setup.
If this idea resonates with you or you have your own opinion, traders, hit the comments. I’m excited to read your thoughts!

BTCUSD Short/Sell SignalBitcoin (BTC/USD) – Tactical Short/Sell Positioning Framework
From a technical perspective, Bitcoin is currently presenting a compelling short-side opportunity as the structure unfolds. After multiple failed attempts to sustain momentum above the $110,000 handle, price action has carved out a sequence of lower highs and retests of the same horizontal zone, a classic sign of weakening bullish conviction and potential distribution at elevated levels.
The current chart reveals several critical dynamics:
1. Stop-Loss Placement (Risk Management Discipline)
A prudent protective stop (SL) I have set at $112,800, just above recent resistance. This ensures adverse upside volatility is capped while preserving favorable risk-to-reward asymmetry.
2. Initial Breakdown Trigger
Bitcoin’s repeated interactions with the 200-day moving average highlight the significance of this level as both psychological and structural support. A clean break beneath it could catalyze accelerated downside flows, inviting systematic selling and liquidations.
3. Downside Targets (Profit Objectives)
Take Profit 1 (TP1): $100,070
This marks the first tactical support level, aligning with prior consolidation and offering a conservative initial profit capture.
Take Profit 2 (TP2): $89,566
A more ambitious level, representing the mid-range support where prior accumulation took place. A breach of this zone would likely confirm a broader bearish continuation pattern.
Take Profit 3 (TP3): $76,193
The ultimate downside objective in this framework, corresponding to deep structural support. Achieving this would imply a full retracement of the bullish leg initiated earlier in the year.
4. Strategic Interpretation
This sequence of measured downside targets aligns with a tiered scaling-out methodology, ensuring that profits are progressively locked in as price declines. Such an approach maximizes capital efficiency while allowing flexibility to ride the broader bearish trend should momentum persist.
My Conclusion
The technical confluence of repeated resistance rejection, weakening market structure, and clear downside liquidity targets positions Bitcoin as a sophisticated short candidate at current levels. Risk is well-contained above $112,800, while downside projections toward $100K, $89.5K, and ultimately $76K create a compelling asymmetric opportunity.

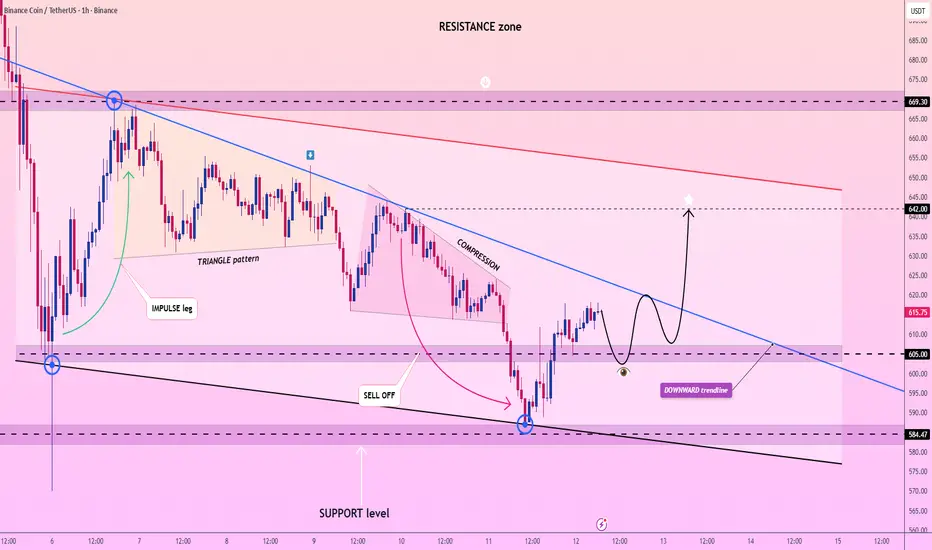
Lingrid | BNBUSDT Breakout Expected to Spark Upward MomentumBINANCE:BNBUSDT perfectly played out my previous trading idea . Price has formed a triangle pattern after an impulsive upward leg, and the market is now compressing in a tight range. Price recently tested the support zone below 600.00, rebounding sharply from it, suggesting accumulation in preparation for a breakout. The downward trendline has been a limiting factor, but the price is approaching the breakout point with a clear upward trajectory.
If the breakout occurs above the 620.00 resistance zone, expect momentum to surge toward the next key resistance at 645.00. This could mark the start of an explosive move higher, fueled by the built-up pressure during the consolidation phase.
➡️ Primary scenario: Hold above 600.00 → Targeting 642.00.
⚠️ Risk scenario: Failure to break above 620.00 might trigger another dip toward the 580.00 support.
If this idea resonates with you or you have your own opinion, traders, hit the comments. I’m excited to read your thoughts!
TTWO Buy/LongTTWO with the release of GTA VI being released this year as promised by the CEO I pray to God for all of us to see $300+ minimum when it is released however this is the PERFECT buying opportunity for all traders and investors alike who wish to see massive growth in their portfolio. I strongly recommend purchasing TTWO as the stock has plummeted 20-22% just this last month alone with a very nice W pattern structure occurring to this as well it looks like it is about to go to the sky with my target profits being posted in the chart if you would like to study, analyze, and position yourself in. I am NOT setting a stop loss for this trade simply due to the fact I strongly believe in this company as I have cherished many of their games so have all of us in the past with strong titles such as GTA, Bully, RDR, Mafia, 2K, and many many other big IPs. This is something everyone will want to profit off on. Please send me a message if you have any concerns or opinions on my stock pick analysis as I will be posting much more diversified from FX, stocks, futures, crypto, and much more trading charts in the following weeks. God bless in Jesus name I pray for all of us to profit as much as possible from this market AMEN!

TheGrove | EURJPY Sell | Idea Trading AnalysisYou can expect a reaction on Descending channel, the direction of selling from the specified Resistance LINE,
EURJPY moving higher as it tests the strong resistance level..
We expect a bearish move from the confluence zone.
Hello Traders, here is the full analysis.
I think we can soon see more fall from this range! GOOD LUCK! Great SELL opportunity EURJPY
I still did my best and this is the most likely count for me at the moment.
-------------------
Traders, if you liked this idea or if you have your own opinion about it, write in the comments. I will be glad 🤝

Lingrid | GOLD Market Compression Before Major Directional MoveOANDA:XAUUSD has transitioned out of the pullback channel after reclaiming the descending trendline and printing a higher low. Price is now compressing above the 4,900 demand band, suggesting participation remains active despite reduced volatility. The recent hesitation looks more like absorption.
If bulls continue to defend the zone above 4,900 level, price could attempt a gradual push toward the 5,230 resistance level, where prior supply and the upper structure align. A clean expansion through that level may open space toward the higher levels, completing the broader continuation leg.
➡️ Primary scenario: hold above 4,925 → advance toward 5,230.
⚠️ Risk scenario: a slip back below 4,900 could delay continuation and pull price toward 4,665 support.
If this idea resonates with you or you have your own opinion, traders, hit the comments. I’m excited to read your thoughts!

Lingrid | NZDUSD Upside Continuation After Channel BreakoutFX:NZDUSD perfectly played out my previous trading idea . The market reclaimed the broken channel boundary and is now building above the 0.6035–0.6040 support, where prior resistance flipped into demand. The earlier liquidity sweep near 0.5935 was absorbed decisively, followed by impulsive upside rotation that suggests buyers are regaining control. Price is compressing just beneath 0.6100, indicating potential energy building.
If the pair sustains acceptance above 0.6040, continuation toward 0.6100 may unfold, with further extension upward possible should momentum expand. A constructive higher-low formation above the rising trendline would reinforce the upside thesis.
➡️ Primary scenario: hold above 0.6040 → grind toward 0.6100.
⚠️ Risk scenario: failure back below 0.6030 could drag price toward 0.6000 support before buyers re-emerge.
If this idea resonates with you or you have your own opinion, traders, hit the comments. I’m excited to read your thoughts!

Lingrid | HYPEUSDT Buying Setup from Key Swap AreaKUCOIN:HYPEUSDT has retraced into the former breakout region around 28.00, where prior resistance now acts as support. The recent pullback unfolded through a contracting structure, showing fading downside pressure rather than aggressive distribution. Price is currently reacting directly from the rising trendline confluence, reinforcing the broader higher-low sequence.
If this swap zone continues to attract bids, it might initiate a recovery leg toward 34.00, where compression highs and interim supply converge. A sustained push above that level could trigger a broader expansion toward the higher resistance levels.
➡️ Primary scenario: stabilization above 28.00 → advance toward 34.00.
⚠️ Risk scenario: a decisive break beneath 28.00 may expose 25.00 support before any meaningful rebound develops.
If this idea resonates with you or you have your own opinion, traders, hit the comments. I’m excited to read your thoughts!

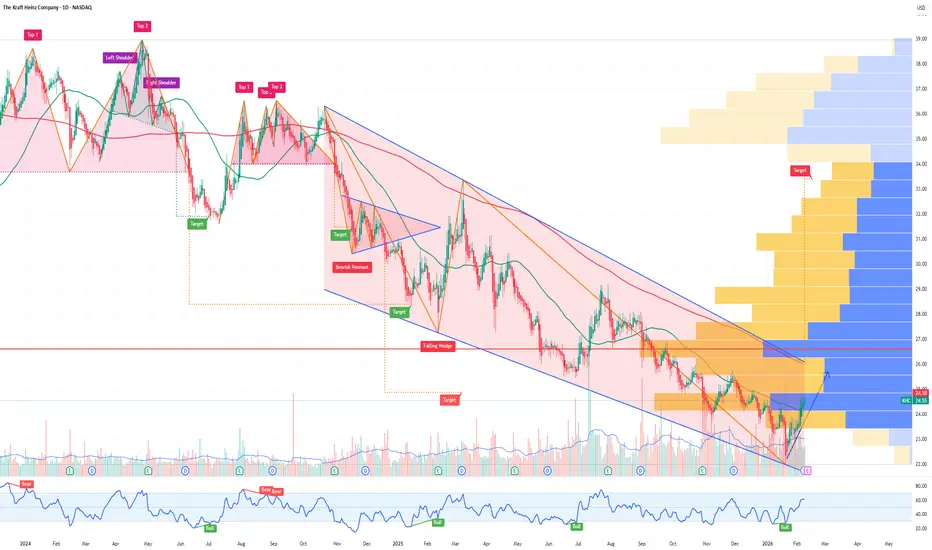
KHC The Kraft Heinz Company Options Ahead of EarningsAnalyzing the options chain and the chart patterns of KHC The Kraft Heinz Company prior to the earnings report this week,
I would consider purchasing the 25usd strike price Calls with
an expiration date of 2026-3-20,
for a premium of approximately $0.67.
If these options prove to be profitable prior to the earnings release, I would sell at least half of them.
Lingrid | GBPUSD Upside Surge Following Channel BreakoutFX:GBPUSD has pushed through the descending trendline after forming a clear base above the recent lows, signaling a potential change in control. The impulsive bounce from the bottom zone suggests buyers may be gaining confidence, while the former breakdown area near 1.363–1.365 is now acting as a reaction level. Price holding above this zone keeps the upside scenario active.
If demand continues to absorb pullbacks above 1.3637, the pair could grind higher toward the 1.375 resistance area, where the prior range ceiling and upper channel pressure converge. A sustained move through that zone might allow momentum to expand further into the upper resistance band.
➡️ Primary scenario: hold above 1.3637 → continuation toward 1.375.
⚠️ Risk scenario: rejection back below 1.3630 may trap late buyers and reopen downside toward the channel base.
If this idea resonates with you or you have your own opinion, traders, hit the comments. I’m excited to read your thoughts!

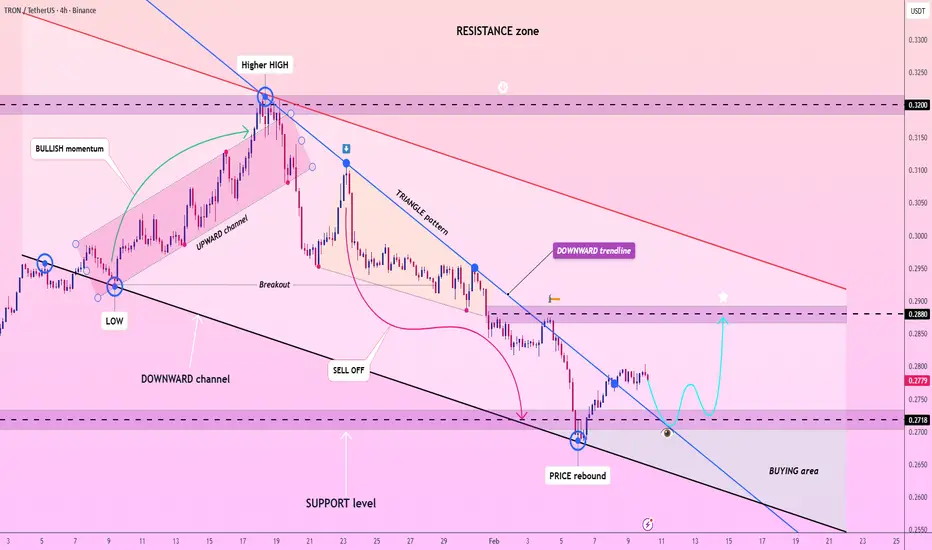
Lingrid | TRXUSDT Price Testing Major Demand SupportBINANCE:TRXUSDT is reacting from a well-defined demand zone after a prolonged decline, with price now stabilizing near the lower boundary of the descending structure. The sharp sell-off appears to have slowed, and recent candles suggest sellers may be losing follow-through as price respects the 0.27 support band. This zone could act as a base for a recovery.
If buyers continue to defend the 0.27–0.272 area, price might rotate higher toward the broken level near 0.288, where prior supply sits. A successful reclaim of that level could shift short-term momentum and open room for a broader corrective push.
➡️ Primary scenario: support holds at 0.27–0.272 → rebound toward 0.288.
⚠️ Risk scenario: failure below 0.27 may invalidate the bounce and expose deeper downside toward the channel base.
If this idea resonates with you or you have your own opinion, traders, hit the comments. I’m excited to read your thoughts!
Lingrid | GOLD Weekly Outlook: Bullish Reversal - $5K ReclaimOANDA:XAUUSD rollercoaster week—surging past $5,000 only to plunge toward $4,400—showcases extreme volatility that demands heightened caution. While long-term catalysts like geopolitical uncertainty and central bank accumulation remain strong, the market’s whipsaw action reflects exhaustion after parabolic gains. The weekly chart’s massive rejection bar and 20% swing confirm a classic blow-off top, with the $5,000 zone now acting as a psychological barrier. Traders must respect this turbulence; such violent moves often precede extended consolidation as sentiment resets.
The rising channel confirm gold’s bull structure remains unbroken, with the $5,100 resistance zone now the critical battleground. The upward trendline suggest a measured retest of this level, while the bullish weekly pinbar candle hints at upside continuation. Volume spiking on the rebound validates buyer conviction, but a decisive close above $5,100 is required to neutralize the sell-off threat. Failure here risks a deeper pullback to $4,500, whereas a breakout could ignite a run toward $5,275.
Consolidation between $4,750 and $5,275 is now the most probable near-term path, allowing the market to digest the 20% swing and rebuild institutional conviction. This phase isn’t bearish—it’s necessary after the euphoric spike, offering strategic entry points for long-term investors. Watch for a close above PWH to confirm bullish resumption, or a break below $4,700 to signal deeper risk. With the 2026 ATH resistance still intact, patience is key: gold’s fundamentals remain unshaken, but timing the bounce requires respecting the market’s current exhaustion.
If this idea resonates with you or you have your own opinion, traders, hit the comments. I’m excited to read your thoughts!

Lingrid | EURUSD Breakout from Consolidation into ExpansionFX:EURUSD has finally pushed out of a prolonged compression phase, hinting that downside pressure may be losing control. Price is now trading back above the short-term range highs, while momentum is slowly rotating upward despite the descending channel still overhead. This move could be the early stage of a trend transition rather than just another corrective bounce.
If buyers continue to defend the 1.1830–1.1800 zone, price might build acceptance above the former consolidation and press into the 1.1920–1.1950 resistance band. A successful hold above that breakout level would increase the probability of a larger expansion toward the upper channel boundary.
➡️ Primary scenario: support holds at 1.1830 → continuation toward 1.19245.
⚠️ Risk scenario: a loss of 1.1800 could invalidate the bullish attempt and drag price back toward 1.1730
If this idea resonates with you or you have your own opinion, traders, hit the comments. I’m excited to read your thoughts!

Lingrid | BTCUSDT Liquidity Grab Possible Above $70K LevelBINANCE:BTCUSDT perfectly played out my previous trading idea . The market is grinding higher inside a corrective structure after rejecting from multiple lower highs, with price now pressing into the 72,000–73,500 supply where sellers previously stepped in aggressively. The rebound from 60K looks corrective and the overlap between the red descending trendline and horizontal resistance suggests upside may be limited. This area could easily act as a liquidity sweep zone rather than a clean breakout point.
If sellers respond again around 73K, CRYPTOCAP:BTC may roll over and resume its broader bearish leg toward 65,000, where prior demand and unfinished downside liquidity sit. Failure to reclaim and hold above this resistance band would keep the larger downtrend intact and favor another distribution move lower.
➡️ Primary scenario: rejection from 73,000 → downside continuation toward 65,000.
⚠️ Risk scenario: a strong acceptance above 73,500 could invalidate the sell setup and open room for a push toward 78,000–80,000.
If this idea resonates with you or you have your own opinion, traders, hit the comments. I’m excited to read your thoughts!

Lingrid | ZECUSDT Round Number Support Zone ReachedBINANCE:ZECUSDT has stabilized near the psychological 200 zone, an area that previously triggered strong demand and now aligns with the lower boundary of the descending channel. The latest drop was met with an aggressive reaction, suggesting selling pressure may be exhausting rather than expanding. Despite the broader downtrend, price behavior around this level hints that bears could be losing control in the short term.
If buyers continue to defend the 200–210 region, it may attempt a recovery toward the former breakdown area near 315, where prior range support now sits. A sustained push through that band could shift momentum further upward and challenge the descending trendline overhead.
➡️ Primary scenario: support holds at 200–210 → rebound toward 315.
⚠️ Risk scenario: a decisive breakdown below 200 might invalidate the bullish reaction and open space toward the next lower demand zone.
If this idea resonates with you or you have your own opinion, traders, hit the comments. I’m excited to read your thoughts!

Lingrid | GOLD Bearish Move Expected from Psychological LevelOANDA:XAUUSD is facing resistance at the 5,000 level above, a significant psychological threshold that has triggered a price pullback. The market recently formed a higher low following the corrective phase, but the bearish structure remains prominent as price action appears to be consolidating below the resistance zone. The rejection from this key level, combined with the ongoing downward pressure, suggests that further declines are likely.
If the price continues to face pressure at the 5,000 mark, it may proceed lower towards the 4,600 area, a support level where a potential reversal could occur. However, until the price breaches the resistance and breaks above this key zone, the bearish trend may persist.
➡️ Primary scenario: Rejection from 5,000 → potential continuation towards 4,600.
⚠️ Risk scenario: A decisive close above 5,000 could signal a shift in trend, opening the door to a move higher towards 5,400.
If this idea resonates with you or you have your own opinion, traders, hit the comments. I’m excited to read your thoughts!

Lingrid | EURAUD Bearish Entry After Correction PhaseFX:EURAUD perfectly played out my previous trading idea . Price is encountering strong resistance in the 1.7000 zone, where the price has recently formed a lower high, signaling a potential bearish setup. After the initial impulse move and a brief consolidation phase, the market seems to be undergoing a corrective phase, with the recent price action testing key resistance levels before another possible downturn. The downward channel remains intact, and the price is showing signs of exhaustion as it approaches the resistance zone.
If the price fails to break above the 1.7000 resistance level, it is likely to resume the bearish trend, aiming for the 1.68520 level, where both support and previous lows converge. This presents an opportunity for a sell position as the market could continue its downward trajectory after the correction phase.
➡️ Primary scenario: Rejection at 1.7000 → continuation towards 1.68520.
⚠️ Risk scenario: A clean break above 1.7000 would invalidate the bearish setup and could lead to a retest of higher levels toward 1.7150 or higher.
If this idea resonates with you or you have your own opinion, traders, hit the comments. I’m excited to read your thoughts!

Lingrid | DOGEUSDT Potential Buy at August 2024 Low ZoneBINANCE:DOGEUSDT perfectly played out my previous trading idea . Price is currently showing signs of a rebound after reaching the lower support zone, with the price testing the August 2024 low. This support level, combined with the downward trendline, suggests a possible bounce back to higher levels, as the price remains within a range. The bullish momentum appears to be building, especially after the recent long-tailed bar formation.
The price could be on the verge of another upward move, with the risk/reward ratio pointing toward a favorable buying opportunity, especially around the 0.0900 levels. If it manages to hold the support and break above, a swift move toward 0.1090 may follow.
➡️ Primary scenario: Rebound from 0.0850 → continuation towards 0.1090.
⚠️ Risk scenario: A break below 0.0850 would invalidate this bullish outlook and indicate further downside toward 0.0800 or lower.
If this idea resonates with you or you have your own opinion, traders, hit the comments. I’m excited to read your thoughts!

TheGrove | USDJPY Buy | Idea Trading AnalysisEURJPY is moving on Resistance AREA..
The chart is above the support area, which has already become a reversal point twice.
We expect a decline in the channel after testing the current level and moving to resistance line
We expect a decline in the channel after testing the current level
Hello Traders, here is the full analysis.
I think we can soon see more fall from this range! GOOD LUCK! Great BUY opportunity USDJPY
I still did my best and this is the most likely count for me at the moment.
-------------------
Traders, if you liked this idea or if you have your own opinion about it, write in the comments. I will be glad ⚜️
