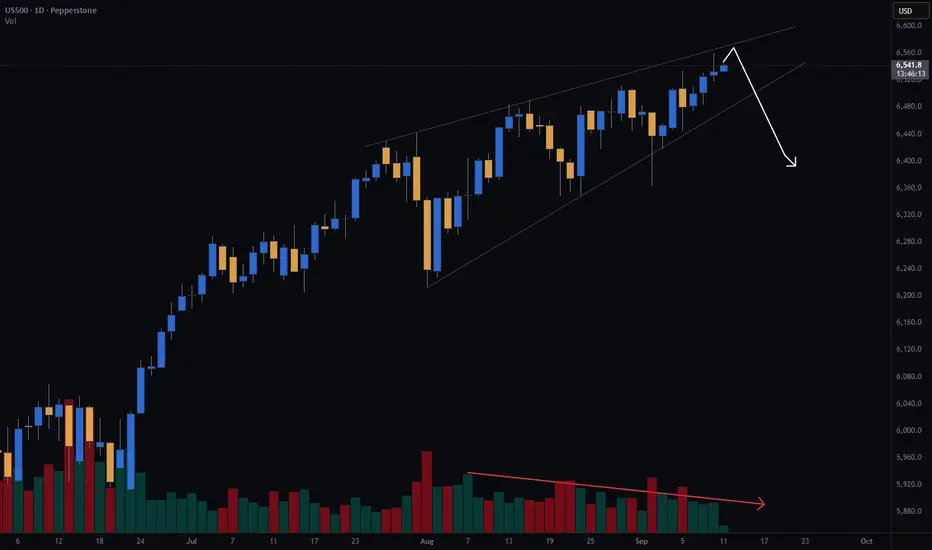
S&P500 | Daily rising wedge | GTradingMethodGood morning fellow traders,
S&P price action is tightening inside a rising wedge on the daily chart, with volume steadily dropping.
Rising wedges often signal potential reversals, but with CPI on deck, volatility could go either way.
My guess, price tests top of rising wedge, finds resistance and down we go - a long way down.
Keen to hear your thoughts on whether CPI is going to be a catalyst for a breakout or breakdown?
Signalsprovider
XAU/USD: Resistance at 3,650 Triggers Potential Pullback SetupXAU/USD has reached the 3,650 resistance zone after a strong bullish rally within its upward channel, but momentum is now stalling. A visible top formation is emerging on the chart, with sellers actively defending this level, suggesting a possible corrective move ahead.
If gold fails to break and sustain above 3,650, the price may retrace toward the next key support at 3,546. While the broader trend remains bullish, near-term momentum indicates a likely pullback phase. Upcoming economic data could also influence whether the market consolidates or corrects from current levels.

Lingrid | XRPUSDT Bullish Channel Break - Upside PotentialBINANCE:XRPUSDT has rebounded from the range zone and is now holding above the upward trendline, showing early signs of renewed bullish momentum. The structure highlights a breakout from the falling wedge pattern, suggesting potential continuation higher if buyers defend current levels. A push above 3.10 could accelerate gains toward the 3.25 resistance target, with further extension possible into the 3.37 zone. As long as the price holds above 2.90, the bias remains tilted to the upside with accumulation supporting the move.
💡 Risks:
A breakdown below 2.90 would negate the bullish setup and reopen downside toward 2.75 support.
Negative sentiment in the broader crypto market could stall the breakout and trigger renewed selling.
Regulatory pressure or legal developments tied to XRP could weigh on demand despite technical strength.
If this idea resonates with you or you have your own opinion, traders, hit the comments. I’m excited to read your thoughts!

BNB Strong Resistance Meets Whales Sell Orders – A Good Short BNB Current Market Update
The coin is now trading at its All-Time High , facing a very strong resistance around $900 .
This presents a great short opportunity .
After carefully monitoring buy and sell orders on-chain, I noticed a strong confirmation for the short setup:
Whales and Market Makers sell orders are clustered heavily around the $888 – $890 resistance zone.
✅ My Personal Strategy:
Short Entry: Resistance zone between $888 – $890
🎯 Target 1: $876
🎯 Target 2: $873
Please note:
This is not financial advice – I’m only sharing my personal trades.
Always do your own research before taking action.
👍 Don’t forget to like if you found this useful, and feel free to follow me for more analysis of this kind.
Best of luck 🌹

Gold | H2 Double Top | GTradingMethodHello Traders 👋
🧐 Market Overview:
I’ll be honest — I’m feeling a little hesitant about entering another Gold trade. The last few setups have gone against my system more than I would like. But trading is always a game of probability — clusters of losses are part of the process.
The key is staying disciplined. Over the long run, probability is in my favour, and that’s why I have to take this trade. My system is flagging a potential double top on the H2 chart, and the so far setup aligns with my rules.
Some of the variables I look for:
- Negative rsi divergence
- decreasing volume on the second top
- Need candle to close in range to take the trade
📊 Trade Plan:
Risk/Reward: 3.7
Entry: 3666
Stop Loss: 3689
Take Profit 1 (50%): 3592
Take Profit 2 (50%): 3565
💡 GTradingMethod Tip:
Even the best systems go through losing streaks. The edge comes not from avoiding them, but from executing consistently and letting probability work itself out over time.
🙏 Thanks for checking out my post!
Make sure to follow me for more setups and share your thoughts — will this H2 double top play out, or does Gold still have momentum to push higher?
📌 Disclaimer:
This is not financial advice. This content is to track my trading journey and for educational purposes only.

S&P | 30min Double Top | GTradingMethodHello Traders 👋
🧐 Market Overview:
The S&P has been pushing into new highs, but a potential double top is forming right at diagonal resistance. This is a key level for me — the confluence of structure and resistance makes this an area worth watching closely.
If the double top holds, price might first deviate through my entry range and then retest the diagonal resistance. For me to take a short, I’ll be looking for a 30-minute candle close back within the range as confirmation.
📊 Trade Plan:
RR: 3.5
Entry:6 537.4
Stop Loss: 6 543.8
Take Profit 1 (50%): 6 515
Take Profit 2 (50%): 6 511
💡 GTradingMethod Tip:
When trading double tops, I always wait for confirmation (like a close back within range). It reduces false entries and adds probability to the trade.
🙏 Thanks for checking out my post!
Follow me for more setups and let me know — do you think this double top will hold, or will the S&P push through resistance to fresh highs?
📌 Disclaimer:
This is not financial advice. This content is to track my trading journey and for educational purposes only.

BITCOIN Quick Buy Trade with the whalesBased on my analysis of on-chain data and liquidity flow, here is what I am seeing:
I've noticed a large buy order in the green zone between 110,600 and 110,500, which may push the price higher.
Additionally, there are large whale buy orders at the strong support of 110,000, with options contracts clustered there.
This will also contribute significantly to pushing the price up.
My Strategy:
✅ I will be taking a buy position if the price drops to the green zone between 110,600 and 110,500.
I will also take another buy position if the price drops to 110,000.
Targets
🎯 TP1: 112,600
🎯 TP2: 113,400
Disclaimer
This is not investment advice. I am only sharing my personal trade setups. Please always do your own research before trading.
Regards 🌹

Lingrid | AUDUSD Major Resistance Short - Monthly LevelThe price perfectly fulfilled my previous idea . FX:AUDUSD has rallied strongly from the double-bottom formation near 0.6460 and is now testing the resistance zone around 0.6627. The market structure shows bullish momentum fueled by a breakout from the triangle pattern, lifting price toward prior highs. Price action is stalling at the upper boundary, where sellers may look to fade the move, opening potential retracement back toward 0.6550. If buyers defend that zone, another attempt at resistance could follow, but failure there may shift momentum in favor of sellers. The broader setup suggests a battle between trend continuation and near-term exhaustion.
💡 Risks:
A stronger-than-expected US PPI could boost the dollar and push AUDUSD lower.
A dovish RBA stance or weak Australian economic data may undercut recent bullish momentum.
Global risk sentiment shifts, particularly weakness in equities or commodities, could weigh on AUD demand.
If this idea resonates with you or you have your own opinion, traders, hit the comments. I’m excited to read your thoughts!

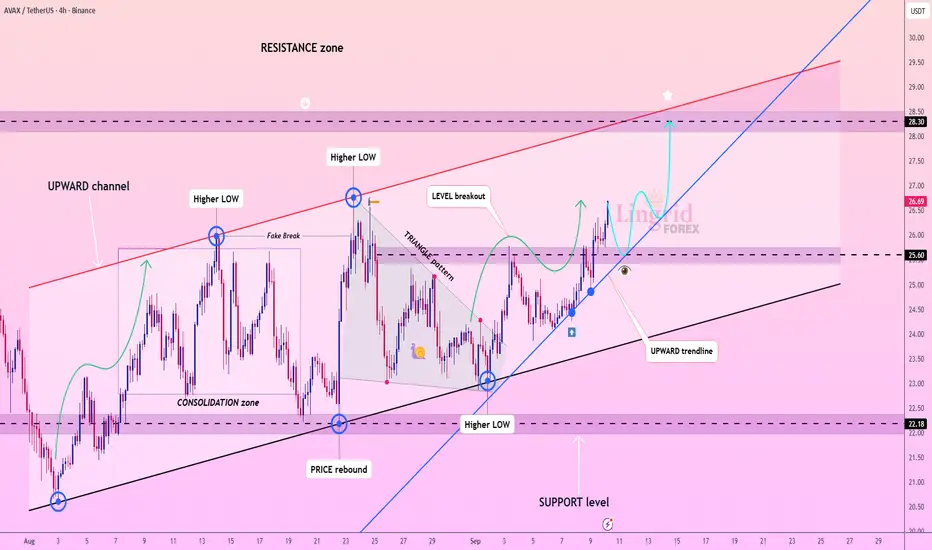
Lingrid | AVAXUSDT Upside Momentum Building. Potential SurgeBINANCE:AVAXUSDT is trending inside a well-defined upward channel, supported by higher lows and a clean breakout above the 25.50 level. The market structure shows consolidation breaks and triangle formations resolving higher, signaling continuation of bullish pressure. Current momentum suggests buyers could drive price toward the 28.30 resistance zone if the upward trendline continues to hold. Any retest of 25.60 is likely to act as a springboard for further gains within the channel. The overall setup reflects sustained bullish sentiment aiming for higher levels.
💡 Risks:
A breakdown below 25.00 could trap buyers and send price back toward 22.00 support.
Regulatory headlines targeting crypto markets may trigger sudden volatility and selling pressure.
Sharp declines in Bitcoin or Ethereum could weigh on broader altcoin sentiment and stall AVAX’s uptrend.
If this idea resonates with you or you have your own opinion, traders, hit the comments. I’m excited to read your thoughts!
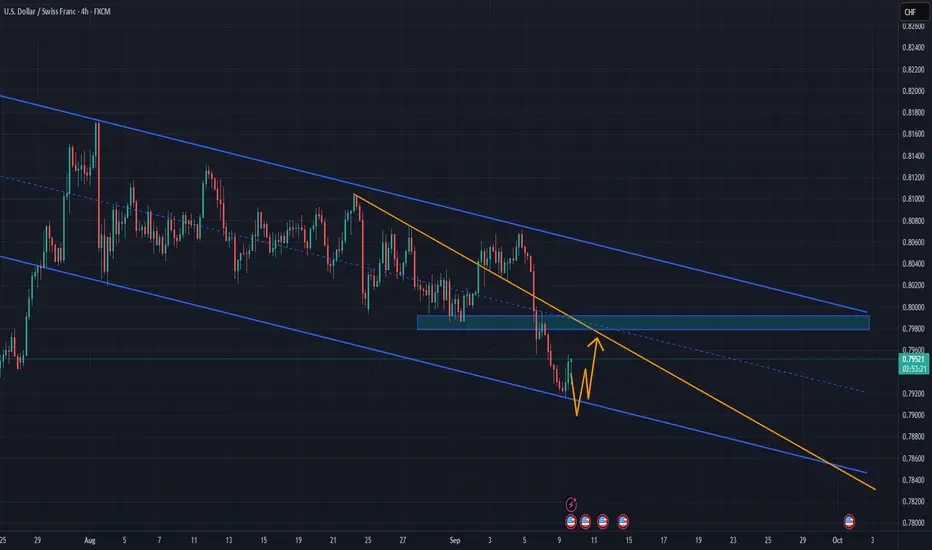
Lingrid | USDCHF Reached Demand Zone: Potential Rebound The price perfectly fulfilled my previous idea . FX:USDCHF has tested the demand zone around 0.7913 and is showing signs of holding above this key support. The structure suggests a potential rebound as price deceleration aligns with the higher probability of a corrective move toward the 0.7984 resistance. A break above the downward trendline would confirm strength and open the way toward the 0.8050 region. As long as the 0.7900 level remains defended, buyers retain the advantage with room for continuation higher.
💡 Risks:
A decisive close below 0.7900 would invalidate the demand-zone setup and trigger deeper losses.
Upcoming US data releases such as CPI or NFP may spark volatility and disrupt the bullish scenario.
Unexpected hawkish commentary from the SNB could strengthen CHF and cap upside momentum.
If this idea resonates with you or you have your own opinion, traders, hit the comments. I’m excited to read your thoughts!

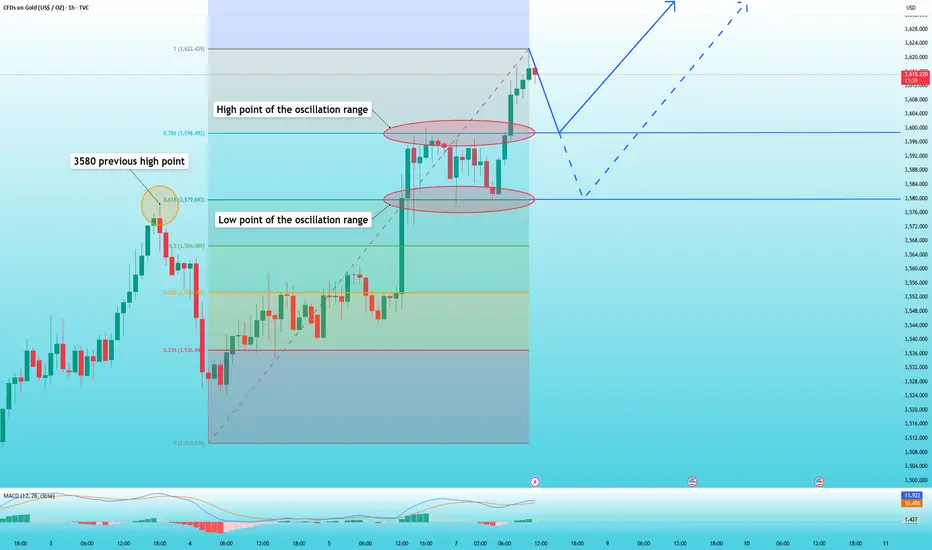
Lingrid | GOLD Price Deceleration: Short-Term Retracement The price perfectly fulfilled my previous idea . OANDA:XAUUSD has reached a fresh all-time high within the upward channel but is now showing price deceleration near the 3,660 resistance zone, suggesting exhaustion. Price action is forming smaller candles in the profit-taking area, indicating weakening bullish momentum. A rejection here could trigger a corrective move toward 3,590, with deeper downside potential toward 3,470 if sellers sustain control. The broader structure highlights a possible correction unfolding following A-B-C movement from this overextended zone.
💡 Risks:
A softer US CPI could reignite bullish flows and invalidate the sell scenario.
Renewed geopolitical tensions may increase safe-haven demand and push gold higher.
A dovish Federal Reserve shift could restore strong buying pressure and reverse any correction.
If this idea resonates with you or you have your own opinion, traders, hit the comments. I’m excited to read your thoughts!

USD/CHF: Holding Key Support with Rebound Potential BuildingUSD/CHF has tested the demand zone near 0.7913 and is beginning to show signs of stability above this key support level. The current price action reflects deceleration, which supports the likelihood of a corrective move toward the 0.7984 resistance.
A confirmed break above the downward trendline would strengthen the bullish case, potentially opening the path toward the 0.8050 region. As long as the 0.7900 level holds, buyers maintain a clear advantage, with the structure favoring a continued recovery in the near term.
XAU/USD: Momentum Slows After New All-Time High, Correction LikeXAU/USD has reached a new all-time high within its established upward channel, but is now showing signs of price deceleration near the 3,660 resistance zone—a key area where bullish momentum appears to be fading.
The formation of smaller candles in this profit-taking zone signals exhaustion, and a potential rejection at this level could trigger a correction toward 3,590, with a deeper pullback toward 3,470 possible if sellers take control.
Structurally, the market appears to be completing an A-B-C correction from this extended zone, suggesting that a broader retracement phase may be unfolding before any renewed bullish continuation.

Gold | 30min Head and Shoulders | GTradingMethodHello Traders!
There is a potential head and shoulders in the making.
🧐 Market Overview:
One of the key indicators I watch when trading double tops is negative RSI divergence. On the Gold chart, price has been printing higher highs while RSI has been putting in lower highs — a classic sign of weakening buying momentum.
It’s important to note: negative RSI divergence does not guarantee a correction. It’s simply one element within our robust trading system that helps us build higher-probability setups.
📊 Trade Plan:
Risk/Reward: 3.5
Entry: 3655.1
Stop Loss: 3664.7
Take Profit 1 (50%): 3624
Take Profit 2 (50%): 3614
💡 GTradingMethod Tip:
Always remember — divergence is a signal, not a certainty. Use it in confluence with structure, patterns, and risk management for the best results.
🙏 Thanks for checking out my post!
Make sure to follow me to catch the next idea and please share your thoughts — do you think this head and shoulders will play out, or is Gold still too strong?
📌 Disclaimer:
This is not financial advice. This content is to track my trading journey and for educational purposes only.

Gold | H1 Head and Shoulders | GTradingMethodGood morning Traders 👋
Gold... Could you please give us a head & shoulders to short? 🧐
I’m keeping a close watch here for potential shorting opportunities. An H1 head & shoulders setup would be the first prize.
After such a strong run over the past few days, surely gold owes us a relief rally at some stage...?
What do you think — are we lining up for a short, or does gold have more gas left in the tank?

Lingrid | BNBUSDT Trend Continuation Pattern Completed. BuyBINANCE:BNBUSDT is trading within a strong upward channel after rebounding from the 865 support zone, confirming bullish momentum. The chart shows a sequence of higher lows and a sustained climb along the trendline, highlighting the strength of buyers. Price is now targeting the 932 level, with potential extension toward the 970 resistance area if momentum holds. As long as the upward channel remains intact, the probability favors continuation rather than reversal. A rejection at mid-channel could still provide consolidation before the next leg higher. Broader structure suggests that bulls are preparing to challenge overhead resistance zones.
💡 Risks:
A break below 865 would invalidate the bullish channel and expose downside toward 748.
Upcoming CPI data could boost USD strength, weighing on crypto market sentiment.
A sudden shift in Fed guidance or risk-off sentiment in equities could stall the breakout attempt.
If this idea resonates with you or you have your own opinion, traders, hit the comments. I’m excited to read your thoughts!

Bitcoin’s Triple Test: 110K Options Wall, 105K Liquidity Barrier
Bitcoin is currently navigating through a volatile zone crowded with critical levels. Here’s what I’m tracking closely:
Key Levels to Watch
$110K Options Wall
A dense cluster of open options layers at this zone, signaling potential sell pressure from smart money if breached.
$105K On-Chain Liquidity Barrier
Heavy order flow and visible support orders are stacked here — failure to defend this zone may trigger a breakdown.
$95K Lifeline Support
A psychological base zone with historical significance that could act as the last line of defense for bulls.
What These Signals Mean
A firm hold above $110K could propel BTC into a new breakout phase — possibly toward $118K+.
A dip below $105K might trigger a swift pullback as liquidity dries up.
Breach under $95K could indicate a deeper correction zone, realigning market sentiment.
My View
I track liquidity dynamics and order flow activity, not just charts — these levels are where real capital meets psychology.
The question:
Are bulls strong enough to defend $110K, or are we gearing for a liquidation cascade toward $105K or lower?
✅ Write a comment with your favorite altcoin hit the like button, and I'll provide my analysis in the reply
My analyses are personal opinions, not trade setups.
Thank you for your support, and I wish you successful trades 🌹

WCT: short-term trade from a Strong Support Zone
BINANCE:WCTUSDT
In this green zone, large buy orders from whales and market makers were detected for WCT, totaling 3 million tokens.
This area also represents a very strong support level for the price.
WCT has exhausted its recent downtrend and is showing signs of being oversold on technical indicators, which signals a potential upward correction.
Entry Method:
A buy entry can be made in in the green zone where whale orders and liquidity are concentrated.
✅ Entry Zone : 0.2850 to 0.2810
Targets:
🎯 TP1: 0.2808
🎯 TP2: 0.2939
Note: If you wish, you can hold for larger targets,
but these are quick targets for those who prefer short-term trades.
Good luck and may you always be profitable!
please note :
this opportunity is not financial advice — it reflects only my personal opinion.
PLEASE always do your own research before trading
A 10-year veteran in crypto. I hunt for hidden gems and deliver concise opportunities directly. Follow for high-value insights.
Thank you 🌹

Bitcoin Quick Buy Opportunity for Quick TradersBTC,
Currently, Bitcoin is trading within a tight consolidation range, caught between a descending trendline and an ascending trendline on the 1-hour chart.
The price is forming a potential compression pattern, which often precedes a breakout.
while volume spikes indicate active demand around the green zone.
Additionally, there are visible whale buy orders and volume confirmation near the ascending trendline shown in the chart, strong enough to potentially push the price higher.
These orders are clustered around 110,650.
I will follow a strategy and enter from the same level.
My plan is as follows:
✅ Entry: Buy if price retraces to green line 110,650
🎯 Target 1: 111,250
🎯 Target 2: 111,600
Please keep monitoring this setup, as I use strategies based on observing supply and demand flows.
I will update you with any changes in entry points, targets, or shifts in order book dynamics.
Important Note:
This is not financial advice.
I am only sharing my own trades and personal analysis, which reflect my individual perspective.
Please always do your own research.
Good luck in your trades.
Best Regards 🌹

S&P500 | 100 year bullish channel | GTradingMethodHello Traders - Happy Monday!
I thought this was a very interesting perspective on S&P500.
What they don’t want you to see... 👀
The S&P has been moving inside a bullish channel for nearly 100 years (since 1925).
Right now, price is breaking out of that channel but is it fakeout?
If it’s a fakeout, the implications are huge: we could be looking at a 70% drop back to the bottom of the channel.
⚠️ Chart is on the monthly timeframe with a logarithmic scale.
What do you think — breakout or fakeout? Very keen to hear all your thoughts
#TradingLife

Gold can continue to rise if it retraces support levelGold has been hitting new highs recently, primarily driven by expectations of a Federal Reserve rate cut and risk aversion stemming from tariffs and the US economic outlook.
Last Friday, the unexpected NFP data pushed gold prices above the 3,600 mark.
Overall, we still underestimated the upward potential of gold and the impact of multiple data that are bullish for gold.
Because of the surprise of NFP data, the market is now evaluating whether the interest rate cut in September will be 25 basis points or 50 basis points, which will inevitably intensify the bullish sentiment. Therefore, in terms of strategy, we are mainly long, and the pullback support is an opportunity.
Gold re-entered the 3,600 level at the open today, trading around 3,620. Next, we will focus on two key levels: 3,600 and 3,580.
The Fibonacci retracement of the 3,510-3,622 uptrend shows that 3,600 is at 0.786, while 3,580 is at 0.618, both of which represent previous highs and support levels. Therefore, as long as it falls back to these two positions and stabilizes today, you can enter the market and go long on gold.
However, remember one thing, once it falls below 3580, don't go long.
Silver | H4 Double Top | GTradingMethod
🧐 Market Overview:
All my variables have been met.
Some of the variables I look for are as follows:
- RSI divergence
- Lower volume on top 2 (In this case JOLTS came out, which causes an exception to the volume rule)
- Attack candle closes in range
Opened a short position on Silver.
📊 Trade Plan:
Risk/Reward: 3.9
🎯 Entry: 41.29
🛑 Stop Loss: 41.67
💰 Take Profit 1 (50%): 39.93
💰 Take Profit 2 (50%): 39.34
💡 GTradingMethod Tip:
Sometimes news events (like JOLTS) can disrupt normal volume behavior. That’s why it’s key to use multiple variables together, not rely on just one signal.
🙏 Thanks for checking out my post!
Make sure to follow me to catch the next idea and please share your thoughts — I’d love to hear them.
📌 Please note:
This is not financial advice. This content is to track my trading journey and for educational purposes only.

(XAUUSD) 30-Min Chart – Liquidity Grab & Bullish SetupGold is currently trading around $3,594, after breaking out of a descending trendline (🔻➡️📈). This breakout suggests a potential shift in momentum, but price is still below a strong resistance zone around $3,595–$3,600 🧱, where sellers may still be active.
🔸 A liquidity sweep toward the $3,572.334 level (marked as "Main Sweep") is highly possible. This could be a classic move to grab stop-losses from early buyers before a bullish reversal.
🔸 There is also a Fair Value Gap (FVG) between $3,576 – $3,586, which may act as a magnet for price and a potential demand zone 📉📥.
Two bullish scenarios are likely:
1️⃣ A retest of the FVG or sweep of $3,572, followed by a bounce back up toward resistance.
2️⃣ A direct breakout above the resistance zone, confirming bullish strength and targeting higher highs 📈🚀.
📌 Summary:
Watch for a possible fakeout or liquidity sweep into the FVG/Main Sweep zone. If price holds and shows bullish intent, gold could rally toward or above the $3,600+ level. Patience and confirmation are key! 🔑📊
