Lingrid | GOLD Consolidation Period Following Retracement ?OANDA:XAUUSD is pulling back after a failed retest of the 4,380 resistance zone, showing weakness at the upper boundary of the market structure. The market forms a descending correction within a potential consolidation phase following pullback, staying below the downward trendline. Price may attempt a rebound toward upper zone of consolidation at 4,135 before another wave up if momentum remains neutral. Overall, gold reflects a temporary correction inside a broader upward trend.
⚠️ Risks:
A sustained break below 4,000 would shift short-term sentiment back to bearish.
Unexpected shifts in US inflation or bond yields could spark sell off gold.
Thin liquidity may trigger false breakouts within the consolidation range.
If this idea resonates with you or you have your own opinion, traders, hit the comments. I’m excited to read your thoughts!
Signalsprovider

Lingrid | USDJPY Weekly High Rejection - Potential Sell SignalFX:USDJPY reached the weekly high, showing bearish divergence after an extended rally inside the upward channel. Price is now hovering near the 153.000 level, where prior highs align with weakening momentum. A rejection here could trigger a pullback toward the 152.000 mid-channel support, marking the next liquidity pocket. The 153.000 area acts as the key pivot where bears may regain short-term control before a potential rebound.
⚠️ Risks:
Breakout above 153.000 would invalidate the pullback outlook and invite new buying pressure.
Broader dollar strength could lift the pair beyond resistance.
Weakening yen fundamentals might limit downside follow-through.
If this idea resonates with you or you have your own opinion, traders, hit the comments. I’m excited to read your thoughts!

Lingrid | BTCUSDT Buying Opportunity In Sideways Market OKX:TONUSDT recently rebounded from the support zone after completing a range breakout and forming an ABC corrective move near the $2.0 mark. Price structure remains compressed between the descending resistance and rising trendline, hinting at a potential bullish recovery setup. A sustained above $2.10 could signal continuation toward $2.22. The bullish scenario builds from the ongoing rebound phase within the structure break above current range zone.
⚠️ Risks:
Rejection from $2.10 may invalidate the breakout structure.
Broader crypto weakness could cap upward momentum.
Failure to sustain above the trendline may shift bias back to bearish continuation.
If this idea resonates with you or you have your own opinion, traders, hit the comments. I’m excited to read your thoughts!

ETHUSDT.P - October 24, 2025This indicator introduces a minimalist Buy/Sell signal methodology designed for clarity and power. The goal is to strip away all visual clutter—no trendlines, no Boxes, no FVGs—to focus solely on generating precise market directional signals.
It is specifically developed for stability and reliability on well-established major-cap cryptocurrencies (e.g., ETH, BTC). It is not intended for use with high-volatility, low-cap, or memecoins.
Observed Performance
The underlying logic has shown strong results on major pairs. A sample backtest on ETHUSDT.P demonstrated a focus on quality over quantity, yielding 4 clean trades over a 60-day period with a 100% win rate.
The methodology is currently for private study and application, serving as an example of how powerful, clean indicators can be developed for traders focused on large-cap stability.
This content is for educational and analytical purposes only and does not contain any promotional material, solicitation, or fundraising requests.

Lingrid | BTCUSDT Consolidation Period Following CorrectionBINANCE:BTCUSDT remains under heavy pressure after a sharp rebound from 102K met resistance near the 114K–115K zone. The market continues to respect its downward structure within the broad descending channel, suggesting sellers are still in control. A rejection around the trendline could confirm a new bearish leg toward 107.5K or even 102K if weakness accelerates. Overall momentum favors further downside as lower highs keep forming under resistance.
⚠️ Risks:
Sudden bullish breakout above 115K could invalidate the bearish channel.
Positive macro news or ETF inflows could trigger short-term recovery.
Oversold market conditions may lead to a temporary corrective bounce.
If this idea resonates with you or you have your own opinion, traders, hit the comments. I’m excited to read your thoughts!

Lingrid | XRPUSDT Bearish Pressure Continues BINANCE:XRPUSDT continues its decline within a well-defined downward channel after facing rejection near the resistance trendline. The pair remains trapped under a bearish structure marked by lower highs and lower lows. Unless it breaks above 2.50, the bias stays bearish with potential continuation toward 2.10. Overall momentum reflects sustained selling pressure as the market follows its descending trajectory.
⚠️ Risks:
A sudden shift in BTC sentiment could invalidate the bearish setup.
A breakout above 2.45 would signal a reversal toward 2.83.
Unexpected regulatory or liquidity events could distort short-term technical flows.
If this idea resonates with you or you have your own opinion, traders, hit the comments. I’m excited to read your thoughts!

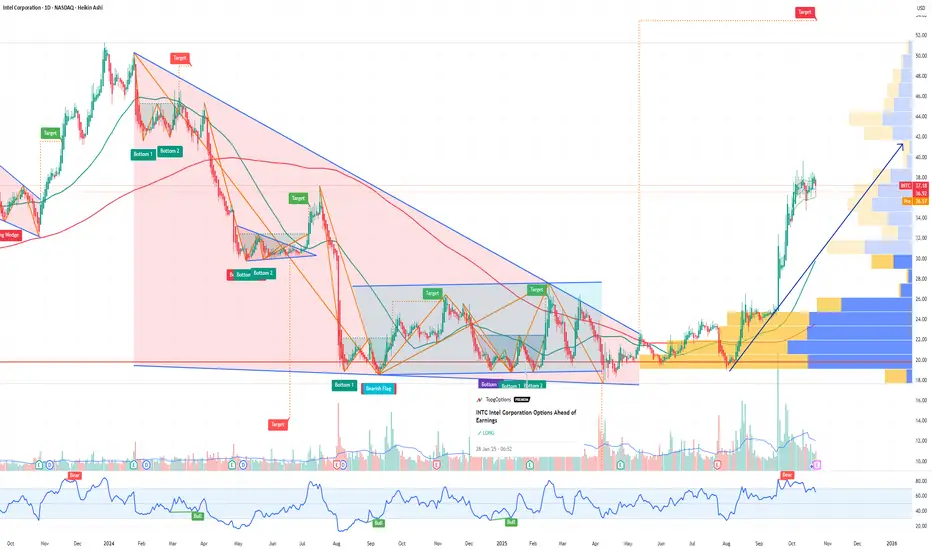
INTC Intel Corporation Options Ahead of EarningsIf you haven`t bought the dip on INTC:
Now analyzing the options chain and the chart patterns of INTC Intel Corporation prior to the earnings report this week,
I would consider purchasing the 48usd strike price Calls with
an expiration date of 2026-3-20,
for a premium of approximately $2.75.
If these options prove to be profitable prior to the earnings release, I would sell at least half of them.
PG The Procter & Gamble Company Options Ahead of EarningsIf you haven`t bought the dip on PG:
Now analyzing the options chain and the chart patterns of PG The Procter & Gamble Company prior to the earnings report this week,
I would consider purchasing the 152.50usd strike price Calls with
an expiration date of 2025-11-21,
for a premium of approximately $3.55.
If these options prove to be profitable prior to the earnings release, I would sell at least half of them.

Lingrid | GOLD Weekly Support Hold Long OpportunityOANDA:XAUUSD pulled back sharply from the resistance and printed a higher low right at the confluence of the uptrend and above previous week low 4,050. Structurally, the broader upward channel remains intact while price retested the downward trendline from above, keeping the higher-low sequence alive. If 4,000–4,050 support continues to hold, it favor a rebound toward 4,245 and, if momentum extends, a run at 4,400; a daily close back below 4,043 would defer the bounce. Broader momentum still skews bullish with successive higher lows, suggesting the recent drop is a corrective pullback within the trend rather than a top.
⚠️ Risks:
A decisive break below 4,000 that invalidates the uptrend confluence could extend losses toward 3,950–3,900.
Strong USD and higher real yields on hawkish Fed rhetoric/data may cap upside or accelerate downside.
Diminishing geopolitical risk or risk-on equity strength could sap haven demand for gold.
If this idea resonates with you or you have your own opinion, traders, hit the comments. I’m excited to read your thoughts!

Lingrid | AUDCHF Key Zone Rejection Selling OpportunityFX:AUDCHF broke above consolidation structure after rebounding from the key support level around 0.514. The price has been oscillating inside a narrow range, capped by resistance near 0.521. A failure to break above this level could resume bearish momentum toward the 0.514–0.508 support zone since the major trend is bearish on the daily timeframe. The overall tone remains cautious as the pair stays confined within a corrective channel.
⚠️ Risks:
Strong Swiss franc buying due to risk-off sentiment could accelerate the decline.
A break above 0.521 resistance would invalidate the bearish setup.
Unexpected macro data from Australia may disrupt the current technical pattern.
If this idea resonates with you or you have your own opinion, traders, hit the comments. I’m excited to read your thoughts!

Lingrid | SHIBUSDT Sideways Break Lower ExpectedBINANCE:SHIBUSDT is trading below the confluence of the descending trendline and the former support, following a clear rejection and sell-off from the 0.0000148–0.0000136 resistance band. Structurally, price remains in a downward channel with a sequence of lower highs/lows after failing out of a short upward channel. If price stays capped beneath ~0.00001100, I favor continuation lower toward the channel base and 0.00000865 support; a decisive reclaim above 0.00001136 would soften the bearish view. Broader momentum is still negative, with repeated rejections and lower lows confirming downside pressure consistent.
⚠️ Risks:
A sustained break back above 0.00001108–0.00001136 could flip the near-term structure and force a squeeze toward 0.0000125–0.0000136.
Broad crypto strength or a sharp BTC rebound can invalidate downside continuation and lift CRYPTOCAP:SHIB with beta.
Headlines or liquidity spikes around memecoins may trigger erratic wicks that pierce the channel before direction resumes.
If this idea resonates with you or you have your own opinion, traders, hit the comments. I’m excited to read your thoughts!

FCX Freeport-McMoRan Options Ahead of EarningsAnalyzing the options chain and the chart patterns of FCX Freeport-McMoRan prior to the earnings report this week,
I would consider purchasing the 45usd strike price Calls with
an expiration date of 2025-12-19,
for a premium of approximately $1.31.
If these options prove to be profitable prior to the earnings release, I would sell at least half of them.

Lingrid | GBPJPY False Channel Break Bearish SignThe price perfectly fulfilled my previous idea . FX:GBPJPY faded from the 202.6–203.0 supply, slipping back beneath the red downtrend and eyeing the mid-range support at 201.45. Structurally, price printed a lower high at the trendline, then failed a breakout from the rising trendline, keeping it inside the broader descending channel. If 202.6/203.0 isn’t reclaimed, I expect continuation toward 201.45 and potentially 200.63; a clean reclaim above 203.0 would invalidate and re-open 204.5. Broader momentum still shows lower highs within a down-channel, and the recent false break reinforces the sell-side control until higher-timeframe support changes that.
⚠️ Risks:
A sudden risk-on shift or yen weakness from BOJ headlines could fuel a squeeze back above 203.0.
UK/JP data surprises or central bank commentary may whipsaw price around the trendline.
A sharp drop in US yields could undermine JPY strength and negate the bearish setup.
If this idea resonates with you or you have your own opinion, traders, hit the comments. I’m excited to read your thoughts!

Lingrid | AVAXUSDT Pullback Sell Downside ExtensionBINANCE:AVAXUSDT is showing rejection from the confluence of the downward trendline and the $20 psychological zone, confirming sellers' control in the short term. The structure remains within a bearish channel with a lower-high formation maintaining downside pressure. Price may retest $20 before extending losses toward $17.5 if momentum weakens further. This retracement aligns with the broader descending structure visible since mid-October, keeping bias bearish for now.
⚠️ Risks:
Break above $20.5 could invalidate the current bearish setup.
Strong BTC recovery may support short-term upside correction.
Lower volatility could delay breakdown confirmation below $18.
If this idea resonates with you or you have your own opinion, traders, hit the comments. I’m excited to read your thoughts!

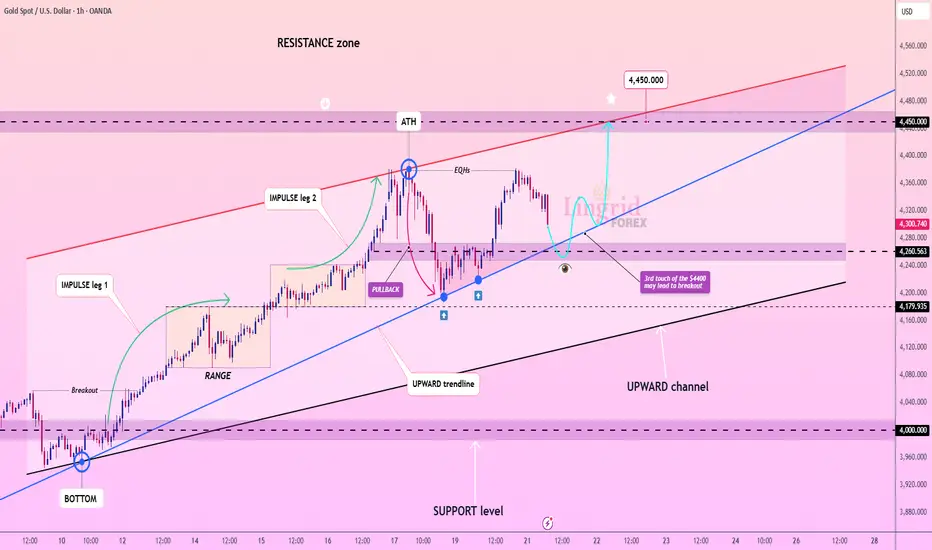
Lingrid | GOLD Trend Continuation Pattern FormingOANDA:XAUUSD is maintaining its bullish structure within an upward channel, where the price continues to create impulsive legs followed by controlled pullbacks. The third touch of the $4,380 resistance area suggests an increasing probability of a breakout continuation toward $4,450. As long as the $4,250–$4,270 support region holds, buyers remain in control of the broader trend. Momentum remains constructive, supported by higher lows and consistent rebounds from the trendline base.
⚠️ Risks:
Failure to hold $4,240 could invalidate the bullish setup.
Strong CPI data may cap gold’s upside.
A sudden drop in inflation expectations could weaken safe-haven demand.
If this idea resonates with you or you have your own opinion, traders, hit the comments. I’m excited to read your thoughts!
Lingrid | USDCAD Contraction Leading to Bullish BreakoutFX:USDCAD continues to respect its upward channel, consolidating after multiple tests of the ascending trendline that define the current bullish structure. The confluence near 1.4036 aligns with dynamic support, suggesting buyers may soon attempt another push toward the 1.4100 resistance. A sustained move above this level could extend momentum toward the upper boundary of the channel. The overall compression phase indicates market preparation for a breakout continuation.
⚠️ Risks:
A breakdown below 1.4030 may invalidate the bullish scenario.
Strong CPI data or oil price rally could pressure USD and reverse gains.
Broader risk sentiment shifts may limit upside potential.
If this idea resonates with you or you have your own opinion, traders, hit the comments. I’m excited to read your thoughts!

Lingrid | LINKUSDT Bearish Continuation Short OpportunityBINANCE:LINKUSDT has been moving inside a well-defined downward channel, consistently forming lower highs and lower lows in line with bearish structure. The recent rejection from the downward trendline confirms continued pressure from sellers near $18.50 resistance. Unless price breaks and sustains above this area, the broader momentum favors a move toward the $15.00 support level. Current structure implies that each rally attempt remains corrective within a larger downtrend.
⚠️ Risks:
A sudden BTC recovery could invalidate the bearish setup.
Failure to hold below $18.50 may trigger a short squeeze.
Softer macro sentiment or lower volatility could delay breakdown momentum.
If this idea resonates with you or you have your own opinion, traders, hit the comments. I’m excited to read your thoughts!

Lingrid | GOLD Weekly Analysis: Pullback From Record HighsThe price perfectly fulfilled my previous weekly idea . OANDA:XAUUSD market continues to navigate through considerable volatility as it pulls back from the recent spike that tested zone below the $4,400 resistance zone. After achieving a new all-time high, the metal is now experiencing natural selling pressure and technical correction, bringing some gravitational force into the equation. Despite this near-term weakness, the underlying trend structure remains constructively bullish, suggesting any substantial decline could present attractive entry opportunities for those seeking value.
The technical landscape reveals gold trading within a well-defined upward channel that has guided the rally since late September. The recent rejection from resistance has brought price action back toward the mid-channel area around $4,200, which aligns with the previous Monday high below and represents a crucial inflection, optimal entry point. The triangle pattern that formed during the consolidation phase earlier in the trend provided the springboard for the explosive breakout, and now the market may repeat this pattern, creating continuation formation.
The key support zone sits at $4,130-$4,135, and holding above this level would keep the bullish structure intact for another potential test of $4,400 and beyond toward the $4,500 projection zone. However, failure to hold could trigger deeper correction toward the lower channel boundary near $4,000 or even the stronger support at $3,730-$3,780, which would actually offer more compelling risk-reward for strategic accumulation. The coming week will clarify whether this represents healthy digestion or something more corrective in nature.
If this idea resonates with you or you have your own opinion, traders, hit the comments. I’m excited to read your thoughts!

Lingrid | EURUSD Round Number Resistance Short SetupFX:EURUSD faded from a lower high at the channel border and slipped back beneath the 1.1700 pivot inside the highlighted range. Structure shows a descending sequence within a broader downward channel, with the recent squeeze stalling just under the 1.1700 mark. While price holds below 1.1700, continuation toward 1.16175 and potentially 1.1600 is favored. Bearish momentum prevails with lower highs and repeated rejections from trend resistance.
⚠️ Risks:
A sustained reclaim and 4H close above 1.1700 would invalidate the bearish view.
US data/ECB headlines could spark volatility and squeeze price higher.
A DXY pullback or broad risk-on bid could buoy FX:EURUSD toward 1.1780.
If this idea resonates with you or you have your own opinion, traders, hit the comments. I’m excited to read your thoughts!

Lingrid | GOLD Consolidation - Breakout - Momentum TradeThe price perfectly fulfilled my previous idea . OANDA:XAUUSD recently made new all-time high inside a steep upward channel, maintaining strong bullish momentum. The structure suggests a healthy correction phase forming a short-term range above the 4,280 support zone. As long as the price remains above the upward trendline, the bullish structure remains intact with potential continuation toward 4,450 and higher. The ongoing range formation may serve as consolidation before the next impulsive breakout higher.
⚠️ Risks:
A sustained break below 4,280 could trigger a deeper correction.
Rising U.S. yields or hawkish Fed comments may weigh on gold prices.
Reduced geopolitical tension could cool safe-haven demand.
If this idea resonates with you or you have your own opinion, traders, hit the comments. I’m excited to read your thoughts!

Lingrid | EURAUD Failed Break Resistance Fade TradeThe price perfectly fulfilled my previous idea . FX:EURAUD surged strongly after rebounding from the double-bottom setup, completing an A-B-C bullish correction into the resistance area near 1.820. The structure now shows signs of exhaustion after a fake breakout above the psychological level, suggesting a potential short setup. Price remains within an upward channel but has started to lose momentum near the upper boundary. A failure to sustain above 1.8200 could confirm a pullback toward the 1.800 support zone.
⚠️ Risks:
A break and close above 1.820 could invalidate the short setup.
Unexpected AUD weakness from macro data could trigger renewed buying.
Broader risk-on sentiment may support continued bullish pressure.
If this idea resonates with you or you have your own opinion, traders, hit the comments. I’m excited to read your thoughts!

Lingrid | TONUSDT Bearish Formation Short OpportunityOKX:TONUSDT price faced resistance within the descending triangle pattern and rejected near the downward trendline, signaling continuation of its bearish structure. The pair is now hovering just above the 2.10 level, testing the lower range boundary inside the upward channel. A confirmed break below 2.10 could open the way toward 2.00 psychological support as sellers regain control. The overall pattern indicates persistent pressure with a potential retest of deeper support before any sustained recovery attempt.
⚠️ Risks:
A bullish reversal in BTC or broader crypto sentiment could invalidate the bearish setup.
Failure to break below 2.10 may trigger a temporary short squeeze.
Positive macro or regulatory news could shift momentum upward prematurely.
If this idea resonates with you or you have your own opinion, traders, hit the comments. I’m excited to read your thoughts!

Lingrid | GOLD Channel Breakout Bullish Extension ActiveThe price perfectly fulfilled my previous idea . OANDA:XAUUSD continues its bullish structure within the ascending channel, forming a new A-B-C movement after a clean breakout above the compression zone. Price is consolidating just above the previous breakout level near 4200, setting a potential base for the next impulsive leg higher. A sustained move above 4200 could trigger a push toward 4290, marking a retest of the resistance zone. Momentum remains strong, supported by higher highs and channel integrity, suggesting continuation of the broader uptrend.
⚠️ Risks:
Failure to hold above 4100 may trigger a deeper retest toward 4060.
Strong USD recovery or hawkish Fed remarks could pressure gold prices.
A sudden shift in global risk sentiment could limit bullish continuation.
If this idea resonates with you or you have your own opinion, traders, hit the comments. I’m excited to read your thoughts!
