Fed Sparks a New Metals Rally: Can Hold Their Momentum?The latest Federal Reserve meeting injected fresh energy into precious metals, pushing gold higher and driving silver decisively above the $60 level.
The catalyst was the Fed’s unexpectedly dovish tone, signaling that inflation is easing faster than anticipated and that rate cuts may arrive sooner or at a steeper pace than previously projected.
Lower interest rates typically weaken the U.S. dollar and reduce bond yields—both of which create ideal conditions for commodities, especially gold and silver, to rally.
Silver outperformed dramatically, boosted by:
Strong industrial demand (EVs, solar, electronics)
A weaker dollar environment
Short-covering after breaking multi-year resistance
Investors rotating from overbought crypto and equities into hard assets
Gold is now approaching its all-time highs, while silver’s breakout above $60 marks one of its strongest moves in over a decade.
Key levels to watch:
Gold support: $3,900 – $4,000
Gold resistance: $4400
Silver support: $55 – $58
Silver resistance: $65 (major psychological level)
If the Fed confirms further easing in its next statements, the metals market may enter a new phase of structural bullish momentum. However, any hotter-than-expected inflation data could trigger a short-term correction.
Silver

XAGUSDXAGUSD's trend is still bullish, but if the price fails to break through $64, a short-term pullback is possible. Consider selling in the red zone.
🔥Trading futures, forex, CFDs and stocks carries a risk of loss.
Please consider carefully whether such trading is suitable for you.
>>GooD Luck 😊
❤️ Like and subscribe to never miss a new idea!

Silver uptrend continuation breakout support at 6288The Silver remains in a bullish trend, with recent price action showing signs of a corrective pullback within the broader uptrend.
Support Zone: 6288 – a key level from previous consolidation. Price is currently testing or approaching this level.
A bullish rebound from 6288 would confirm ongoing upside momentum, with potential targets at:
6500 – initial resistance
6600 – psychological and structural level
6700 – extended resistance on the longer-term chart
Bearish Scenario:
A confirmed break and daily close below 6288 would weaken the bullish outlook and suggest deeper downside risk toward:
6190 – minor support
6110 – stronger support and potential demand zone
Outlook:
Bullish bias remains intact while the Silver holds above 6288. A sustained break below this level could shift momentum to the downside in the short term.
This communication is for informational purposes only and should not be viewed as any form of recommendation as to a particular course of action or as investment advice. It is not intended as an offer or solicitation for the purchase or sale of any financial instrument or as an official confirmation of any transaction. Opinions, estimates and assumptions expressed herein are made as of the date of this communication and are subject to change without notice. This communication has been prepared based upon information, including market prices, data and other information, believed to be reliable; however, Trade Nation does not warrant its completeness or accuracy. All market prices and market data contained in or attached to this communication are indicative and subject to change without notice.

SilverXAGUSD
- Bullish Channel as an corrective pattern in Short Time Frame
- RSI - Divergence
- Completed " 1234 " Impulsive Waves
- Break of Structure
- S / R Level

Silver Extends Gains as Wave Structure Points HigherSilver broke higher last week sharply and decisively, while gold has not followed to the upside as strongly. However, with the gold–silver ratio falling, silver remains the stronger performer at this stage. Because of this relative strength, the move could be wave (3) of an ongoing five-wave bullish impulse, especially given the strong extension higher and the fact that gold is also approaching an all-time high.
Silver may continue to grind higher, and there appears to be room toward the 261.8% Fibonacci extension and the 68–70 zone to complete a lower-degree impulse within wave (3). Currently it can be trading in subwave 3 with room for more gains, just be aware of subwave 4 pullback before a bullish resumption within subwave 5 of (3).

XAG/USD: Price at the Upper Boundary of an Ascending ChannelAnalyzing the XAG/USD chart, we can identify a well-defined ascending channel that contains the broader uptrend originating in early September.
Within this structure, several important technical observations stand out:
The median line of the channel acted as dynamic support and triggered a bullish reaction on December 4.
The line that divides the upper half of the channel into quarters has demonstrated a clear role reversal: it served as resistance earlier in the month and later turned into support around December 10.
The current silver price is trading near the upper boundary of the channel, which may function as a significant resistance level — similar to what was observed in mid-October.
Given these factors, it is reasonable to assume that the market may be extremely overheated, increasing vulnerability to a corrective move. If this scenario unfolds, a bearish break of the steep ascending trajectory cannot be ruled out, especially considering that silver has rallied by approximately 30% from the November 21 low.

XAGUSD SILVER GOING TO BLAST?✅ XAGUSD Trade Summary (Buy Setup)
Market Bias:
Bullish — price is holding above demand and building higher-low structure.
Entry Zone:
📍 63.70 – 63.80 (Demand zone + order block)
Reason for Buy:
Price respected demand zone multiple times.
Market is accumulating liquidity before moving higher.
Structure shifted bullish after recent pullback.
Clear target equal highs at Buy Side Liquidity Range.
Stop-Loss (SL):
📍 63.50
(Below demand zone & liquidity sweep)
Take-Profit (TP):
📍 64.30 – 64.32
(Targeting Buy Side Liquidity)
Risk-Reward Ratio:
Approx 1:3 RRR
Expectation:
Price should hold above the demand range, build bullish order flow, and sweep buy-side liquidity at 64.30+.

New Name, New Year, New War: Venezuelan invasion coming soon? The Trump administration has made its intentions toward Nicolás Maduro clear. Removing the Venezuelan president is a stated goal, but the path the administration is willing to take remains uncertain.
A former U.S. ambassador to Venezuela has described the deployment of American ground troops as a “last option”, but anything is possible with Trump and his newly named Department of War.
Washington has already seized a tanker carrying Venezuelan crude and is preparing to intercept additional shipments. Also, the U.S. has carried out more than twenty strikes on vessels it claims were involved in drug-smuggling operations. Each step raises the risk of a broader confrontation.
Metal markets might rally on escalation. Silver remains in a strong vertical trend. The move above 63 pushed price into fresh record territory before a modest pullback. Gold has broken through the recent range and printed a new swing high near $4,285 before pulling back.
Any significant development in Venezuela, such as a new seizure or a military operation, could trigger a higher open in metals when markets resume.

Si1! - A "Short" Silver Heads-UpWhat we see on these two charts are two different Andrews Pitchforks.
- same time window
- different time period
- different pitchfork placement
The left chart maps the pendulum swings.
The right chart maps the real swings.
LEFT CHART
The market has almost reached the maximum stretch point, arriving at the U-MLH. A reversal toward the centerline is very likely, as the market tends to seek balance after such an extreme stretch. Classic mean reversion.
RIGHT CHART
Here we see that silver has reached the centerline - the classic 80% target for a pitchfork trader. From here, the market can break/zoom through the centerline, retest it, and continue upward. In the LEFT chart, this would correspond to a larger stretch toward Warning Line 1. Or the market may turn at the centerline because it has found its balance, which in the LEFT chart would confirm the stretch-and-turn scenario.
Either way, caution is warranted. I would at least take partial profits (50% is always good) and treat myself to an enjoyable Christmas party!
Anyone who would like to learn more about pitchforks, please read my bio here on TradingView.
Happy profits to you Silver Arrows §8-)

Silver looks like it may finally b ready 2 confirm the c&h breakI feel like at the very least price action s ready to continue up to the dotted red emasured move lines target from a pattern we broke up from some time ago. SO next stop should be around $71 dollars. What it does after that is anyones guess but it does seem like probability is high that it will be validating the cup and handle breakout the neckline of which is shown here in green. You cant grasp from this picture just how high the dotted green measured move line goes for the cup and handle breakout but even after it reaches the dotted red measured move target here to reach the dotted green one it would still have to 10x or so. So obviously validating the cup and handle breakout here would be massively bullish. *not financial advice*

Silver Hits New ATH — Major Reversal Zone Ahead? Bearish SetupSilver( OANDA:XAGUSD ) managed to increase by more than +20% over the last 10 trading days, creating a new All-Time High(ATH) and attracting the attention of many traders in the financial markets.
Silver is currently near Potential Reversal Zone(PRZ) , Yearly Resistance(5), Monthly Resistance(1), and the round number $60.00.
Silver also managed to break the support line, which indicates weakness in the uptrend.
In terms of classic technical analysis, silver managed to rise with the help of the ascending triangle pattern, but we must keep in mind that this pattern is a weak continuation.
In terms of Elliott Wave theory, silver is completing the main wave 5, and this wave could complete at PRZ.
Additionally, we’re noticing a Regular bearish Divergence(RD-) between the price peaks, which adds to the bearish sentiment.
I expect silver to drop to at least $55.10 after breaking the support zone($56.83-$56.37).
First Target: $55.10
Second Target: $53.73
Stop Loss(SL): $61.63(Worst)/$60.54
Do you think silver can go above $60?
💡 Please respect each other's opinions and express agreement or disagreement politely.
📌 Silver/ U.S. Dollar Analyze (XAGUSD), 4-hour time frame.
🛑 Always set a Stop Loss(SL) for every position you open.
✅ This is just my idea; I’d love to see your thoughts too!
🔥 If you find it helpful, please BOOST this post and share it with your friends.

EURUSD: pre-Fed breakout🛠 Technical Analysis: On the 4-hour timeframe, EURUSD has confirmed a "Global bullish signal" (SMA 50 crossing above SMA 200), following a breakout from a steeper descending channel. The pair has found solid footing at the immediate support zone around 1.1640 and is projected to rally towards the overhead resistance at 1.17386. The technical structure suggests a continuation of the upward momentum, driven by the moving average crossover and stabilizing price action above key levels.
———————————————
❗️ Trade Parameters (BUY)
———————————————
➡️ Entry Point: Buy approx. at 1.1640 – 1.1660
🎯 Take Profit: 1.17386 – 1.1750 (Resistance)
🔴 Stop Loss: Below the local consolidation structure (approx. 1.1610)
⚠️ Disclaimer: This is a potential trade idea based on current analysis; market conditions and price direction are subject to change based on news factors and volatility.

Stop!Loss|Market View: USDJPY🙌 Stop!Loss team welcomes you❗️
In this post, we're going to talk about the near-term outlook for the USDJPY currency pair☝️
Potential trade setup:
🔔Entry level: 156.504
💰TP: 159.160
⛔️SL: 155.225
"Market View" - a brief analysis of trading instruments, covering the most important aspects of the FOREX market.
👇 In the comments 👇 you can type the trading instrument you'd like to analyze, and we'll talk about it in our next posts.
💬 Description: The US dollar made the expected correction following the Fed's interest rate decision, but this doesn't change anything over the long term, and a strengthening of the American currency is expected. The Japanese yen is practically the best candidate for this likely strengthening. Technical and fundamental factors suggest a strengthening of the currency pair toward 159. Currently, a short-term trade can be considered near the POC (point of control) level, specifically via an upward breakout.
Thanks for your support 🚀
Profits for all ✅

Silver Powerful BreakoutOANDA:XAGUSD : Cup with Handle pattern and now powerful breakout, As long as hold above $54.70, every chance that it will touch $59.90 & $62.70 in upcoming days, Stop Loss $52.70.

XAGUSD – 4H OutlookBias: Short-term corrective move after hitting major supply zone.
XAGUSD just tapped a strong 4H supply zone around 62.70 – 63.00, and price immediately rejected with a clear wick. This confirms sellers are active at this level.
Structure-wise, silver has been moving in a parabolic impulse, and now the chart is showing the first signs of exhaustion. If the rejection holds, market likely forms a lower high before shifting into a deeper correction.
Key Levels
62.70–63.00 (Supply Zone – Strong Rejection)
61.98 (First support / retest area)
60.62 (Major 4H structure support)
59.31 (Bigger correction target)
What I Expect Next
Price retests the supply zone → forms a lower high
Pullback continuation toward 61.98
Break below opens the door to 60.62
Full correction target sits near 59.30
Momentum indicators also show bearish divergence + Stoch RSI cooling off, supporting a temporary downturn before any bigger trend continuation.
Summary
XAGUSD likely enters a short-term correction phase after rejecting a key supply area. I expect price to form a lower high and continue down toward the 60–59 zone unless buyers reclaim and hold above 63.

50 Shades of Grey Metal : A Silver Price StorySilver BULL PHASE PRICE PREDICTION MODEL
1. Using Historical GOLD/SILVER Ratio:
The Gold/Silver ratio has once again demonstrated its value as a long-term cyclical indicator. Historically, readings above 100 suggest a significant valuation disparity in which gold becomes relatively expensive and silver presents an attractive upside opportunity.
In the current cycle, gold appears to have formed a top near $4,200, after which silver initiated a confirmed breakout. As a result, the Gold/Silver ratio has already compressed to approximately 70. Should this trend continue toward its historical mean near 40, the implied price target for silver becomes substantially higher.
Under the assumption that gold remains capped around $4,200, a ratio of 40 would project silver at roughly $105 per ounce. With the metal currently trading around $69, this scenario indicates a potential appreciation of approximately 50% from present levels.If we assume gold topping at $5000 and GOLD/SILVER ratio reach 45-40 then Silver price will be $110-125.
Gold tops at $4200 -> Silver $105
Gold tops at $5000 -> Silver $110-125
2. Using Silver Technical Analysis:
Technically, silver has completed a major breakout from a long-term rounded bottom—also known as a saucer pattern. This structure has been forming for decades, with the key resistance level sitting near $48, a price ceiling that held for almost 45 years. Silver’s decisive move above this historic barrier, followed by a surge to a new all-time high of $69, confirms the validity and strength of the breakout.
Using the measured-move methodology typically applied to rounded bottom/saucer patterns, the projected upside target for this formation comes in around $85. This level represents the technical completion of the pattern and serves as a logical intermediate target within the broader bull phase.
3. Using Historical Silver Bull Market as a Price Guide:
Historically, during the major bull cycles of the 1980 and 2011, silver advanced by more than 1,000%, underscoring its tendency for extreme upside acceleration once momentum takes hold. If silver were to exhibit a comparable structural move in the current cycle—supported by the strength of the recent breakout and the robust momentum profile—the metal could reasonably target the $140–$150 range. Such a move would represent an appreciation of roughly 200% above the previous all-time high, aligning with the magnitude of past parabolic phases observed in the silver market.
BOTTOM LINE
Considering the convergence of these three analytical approaches—combined with my market experience, as well as the prevailing sentiment and momentum—silver appears positioned to reach the $120 range as a reasonable and achievable target for the current bull phase.
CAUTION: EDUCATION PURPOSE ONLY. NOT INVESTMENT ADVICE. DYOR

Gold & Silver Correction? Here's what 20 years of insight showsThe Gold/Silver ratio has dropped below 70 for the first time since July 2021.
Statistically, this is a strong indication of some correction in Gold and Silver (Moreso specifically Silver). Here's why.
The Gold/Silver ratio not only indicates which one of the two is outperforming, but also often hints at a likely slowdown or sharp increase in the price of bullion.
Let's look at what happened last 4 times in the last 20 years when the ratio went from 80+, down to the critical level of 70 - exactly where the ratio is at right now.
We can see that the Gold/Silver ratio almost always bounces back from 68-70 zone when it falls from 80+ (with 1 exception in 2009 where it overstretched a little and consolidated, but the outcome was still a correction in Silver as you will see below).
Below are the instances that show what happened to Silver when the ratio fell to 70 and bounced back up towards 80.
1. July 2003 to Sept 2003: Silver corrected about 6%
After posting a Year-to-date (YTD) gain of 18-20%, Silver corrected about 6% before rallying further. The correction lasted for around 2 months.
2. Feb 2009 to Apr 2009: Silver corrected about 18%
After posting a YTD gain of 28-30%, Silver corrected about 18% before rallying further. The correction lasted for around 2 months.
3. Feb 2016 to Jan 2018: Silver corrected about 22%
After posting a YTD gain of about 45%, Silver corrected about 22% before falling further. This 22% correction lasted 20 months (almost 2 years).
4. Feb 2021 to Jan 2022: Silver corrected about 19%
After posting a 125% gain from Pandemic low, Silver corrected about 20% before falling another 20% in the following months. This 20% correction lasted 12 months (almost 1 year) and further 20% correction took another 10 months.
Finally, this is where we are right now after Silver posting 100% gain in 2025.
What does this mean for you?
A] If you're an Investor invested in Silver:
We are approaching a time to potentially reduce Silver exposure (if this makes sense with capital gains, etc.) Gold may be preferred over Silver for next few months.
Why? Because in the 4 instances in 20 years, where Silver corrected roughly 20% most of the time, Gold did not correct as much. This makes sense as Gold/Silver bounces from 70 to 80, it means Gold is outperforming Silver. If your view is decadal and you wish to ride out the correction, well, do nothing.
B] If you're an Investor wanting to invest in Gold or Silver:
Consider waiting till you find a dip. That dip hasn't come all 2025, but it is highly likely it will now soon, as indicated by 20 years of data.
C] If you're a trader:
From a weekly to monthly positional viewpoint, this is probably the time to avoid or reduce position size on upside, and keep an eye out for downside reversals. For trade durations of hours to a few days also, I would still look out for opportunities with downside bias and reduce position size for upside trades.
If this is helpful and you want a deep dive into any aspects, or want specific related analyses, feel free to drop a comment.
These views are for educational purposes only and are not financial advice; please consult your licensed financial advisor before making any investment decisions.
Trade/invest with poise.

THE GREAT ROTATION: Forget $BTC, Watch $GDXJWhile the retail crowd is hyper-fixated on the flashing lights of CRYPTOCAP:BTC , NASDAQ:QQQ , and AMEX:SPY , a massive shift is happening in the shadows.
The "Easy Money" party in Tech and Crypto is getting crowded. The music is still playing, but the Smart Money is quietly grabbing their coats and heading for the exit.
Where are they going? They are rotating into the one sector that has been coiled, compressed, and ignored. The Destination: AMEX:GDXJ (Junior Gold Miners).
🧠 THE MACRO CHESS MOVE
Markets are a mechanism for transferring wealth from the impatient to the patient.
The Trap: Buying extended highs on CRYPTOCAP:BTC and NASDAQ:NVDA hoping for "one last pump."
The Opportunity: Buying the Divergence. Gold Spot ( AMEX:GLD ) is screaming at highs, but the Miners are lagging. This is a rubber band stretched to its breaking point. When it snaps back, the move isn't slow—it’s violent.
🔬 THE TECHNICAL BLUEPRINT (Daily Chart)
Forget the noise. Look at the structure.
1. THE COIL (The Setup) We are tracking a pristine Bullish Pennant formation. After an explosive rally from $90, price didn't crash—it hovered. This is institutional absorption. They are soaking up every share under $110.
2. THE LINE IN THE SAND (Support) $100 - $102. This is the fortress. As long as price holds this zone, the bulls are in total control.
3. THE IGNITION (The Trigger) $112. Mark this level. Alert it. Tattoo it. A daily close above $112 is the signal that the accumulation phase is over and the Markup Phase begins. This is "Blue Sky" territory.
🎯 THE PAYOFF (Scenario Mapping)
If the Capital Rotation kicks into high gear:
First Stop: $120 (The Psychological Barrier).
The Measured Move: $135+. This isn't a random number; it's the mathematical projection of the previous impulse leg.
🔥 THE VERDICT
The herd is looking Left ( CRYPTOCAP:BTC ). The Professionals are looking Right ( AMEX:GDXJ ). The chart is coiled. The macro winds are shifting. The rotation is real.
Don't watch the history books. Watch the charts.
⚠️ Disclaimer
This content is for educational and informational purposes only and does not constitute financial, investment, or trading advice. The author is not a licensed investment advisor or portfolio manager. Trading financial markets involves high risk. All decisions are made at your own discretion.
🚀 Follow us for more No-BS trade ideas & indicators AlphaRank

XAUUSD: triangle compression🛠 Technical Analysis: On the 4-hour timeframe, Gold (XAUUSD) is consolidating within a small symmetrical triangle, signaling an imminent breakout. The chart analysis projects a potential "fake-out" or liquidity grab towards the upper resistance zone at 4,250 – 4,280 to liquidate early short sellers before a major reversal. Following this potential spike, the technical structure favors a bearish continuation, targeting the medium-term support level at 3,902.
———————————————
❗️ Trade Parameters (SELL)
———————————————
➡️ Entry Point: Sell Limit at Resistance (approx. 4,250 – 4,280)
🎯 Take Profit: 3,902 (Support)
🔴 Stop Loss: Above the upper resistance structure (approx. 4,320)
⚠️ Disclaimer: This is a potential trade idea based on current analysis; market conditions and price direction are subject to change based on news factors and volatility.

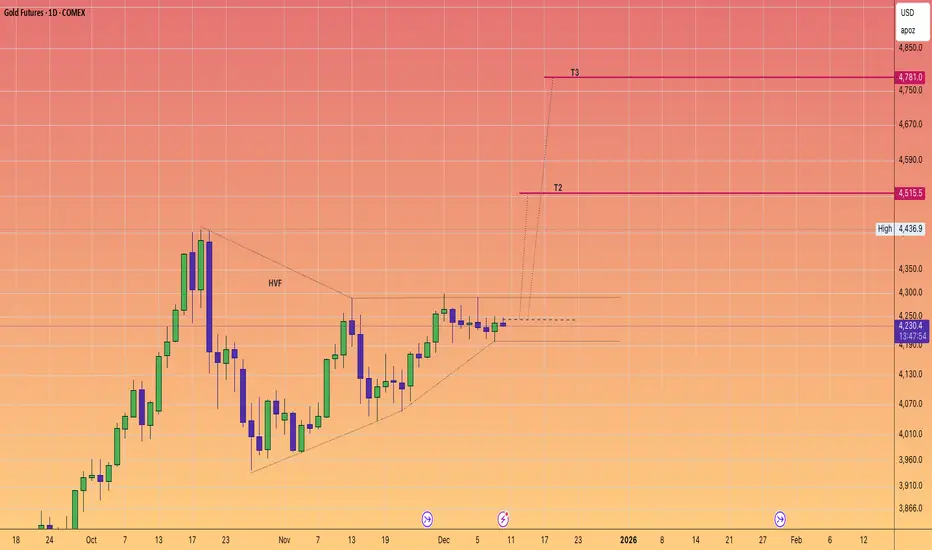
GOLD in a windup. Targets $4800AS we progress ever closer to the quite historic level of $5k for #GOLD
We note that Gold has been quite predictable and routinely has delivered +20% powerful moves since 2024.
The price action currently suggests we are about have another pop very soon.
Will it be enough to tag the $5K level
odds suggest that it definitely on the table.
The #HVF pattern points to $4800 and with some over performance we are right on that doorstep.
Hit All Your Monthly Targets with XAGUSDLadies and gentlemen, XAGUSD is about to activate a trigger that could kick off another uptrend rally for silver—but nailing it won't be that easy... let's break it down. 🔍
I’m Skeptic , founder of Skeptic Lab. If you want to elevate your long-term performance through genuine psychology, data-driven insights, and proven strategies, you’ve landed in the right spot.
In the daily timeframe, after smashing through the ceiling at 54.47959 and surging 8% , we're now ranging just below the resistance at 58.79759 . But every candle that's printed has been pushing hard to break this level: long lower shadows and short upper ones, signaling sellers tried to drag the price down, but buyers fought back fiercely and closed the body strong.
Tomorrow's rate news drops. Over 89.6% are betting on a 25 basis point cut (source: according to the CME FedWatch Tool). What does this mean in plain English? Borrowing gets cheaper, liquidity floods into stocks, companies ramp up investments = boom for commodities, equities, and Bitcoin. But on the flip side, the market might have already priced this in.
Silver's massive run-up these past weeks? Largely because forecasts have been screaming "rate cut incoming"...
My take? If we can open the position today and lock in profits tomorrow pre-news—making it fully risk-free—that's ideal. If we hit stop loss, hey, we gained real market insight (priceless), and exited with zero risk hanging over us. Win the trade? Massive R/R upside. + Slash your risk—drop from 1% to 0.1% exposure—so a stop barely stings. (News trades have lower win rates, hence the low risk play :) )
In the 1H timeframe, a breakout candle above 58.79759 fires our long trigger. Stay out of lower frames, please! They're full of shit candles, insane volatility, and fakeout traps—since the core momentum and real action is locked in 1H right now.
That's it—DO NOT FOMO in, and if this analysis hits your feed, a quick boost on that rocket button keeps the vibes going :) 🩵
Now get outta here.

SILVER (XAGUSD) – Short-Term DangerOn Monday, I highlighted something important in my Silver analysis: after a full week of rectangle consolidation, the most probable scenario was an upside break — with a projected target around 61.
I also repeated a point I’ve been making for weeks: Silver continues to look stronger than Gold.
Fast-forward to now:
🔹 That 61 target has been reached
🔹 Silver rallied more than 3,000 pips from the bottom to the high yesterday
🔹 The broader bullish trend is not in question
Let me be very clear: this post is not about denying the bullish structure.
The trend is intact, momentum is real, and a new ATH is absolutely possible.
⚠️ The Warning: A Short-Term Drop Is Becoming Likely
This is a timing post, not a trend post.
If you are a short-term trader and not already long, entering here is pure FOMO — and extremely risky.
Why? Because the market just moved 13,000 pips in 20 days. That is not sustainable without a reset.
Technically, the structure is stretched, and the probability of a corrective move is increasing.
📉 Levels to Watch for a Pullback
- 59 – my base expectation for the next corrective wave
- 55 – not my primary scenario, but absolutely possible considering the size of the latest rally
Neither scenario breaks the bullish trend. These would simply be healthy retracements inside the larger upward trajectory.
📌 Final Thoughts
The trend is bullish.
The long-term outlook is strong.
But the entry right now is terrible unless you're already positioned.
Stay disciplined. Wait for the market to reset.
Silver will offer better opportunities — don’t let FOMO make the decision for you!

Palladium Daily Squeeze Currently watching a daily squeeze looking to breakout on NYMEX:PA1! (I am trading this via AMEX:PALL ).
Should have a nice move up if this breaks bullishly, with an initial target of $1700.
