50 Shades of Grey Metal : A Silver Price StorySilver BULL PHASE PRICE PREDICTION MODEL
1. Using Historical GOLD/SILVER Ratio:
The Gold/Silver ratio has once again demonstrated its value as a long-term cyclical indicator. Historically, readings above 100 suggest a significant valuation disparity in which gold becomes relatively expensive and silver presents an attractive upside opportunity.
In the current cycle, gold appears to have formed a top near $4,200, after which silver initiated a confirmed breakout. As a result, the Gold/Silver ratio has already compressed to approximately 70. Should this trend continue toward its historical mean near 40, the implied price target for silver becomes substantially higher.
Under the assumption that gold remains capped around $4,200, a ratio of 40 would project silver at roughly $105 per ounce. With the metal currently trading around $69, this scenario indicates a potential appreciation of approximately 50% from present levels.If we assume gold topping at $5000 and GOLD/SILVER ratio reach 45-40 then Silver price will be $110-125.
Gold tops at $4200 -> Silver $105
Gold tops at $5000 -> Silver $110-125
2. Using Silver Technical Analysis:
Technically, silver has completed a major breakout from a long-term rounded bottom—also known as a saucer pattern. This structure has been forming for decades, with the key resistance level sitting near $48, a price ceiling that held for almost 45 years. Silver’s decisive move above this historic barrier, followed by a surge to a new all-time high of $69, confirms the validity and strength of the breakout.
Using the measured-move methodology typically applied to rounded bottom/saucer patterns, the projected upside target for this formation comes in around $85. This level represents the technical completion of the pattern and serves as a logical intermediate target within the broader bull phase.
3. Using Historical Silver Bull Market as a Price Guide:
Historically, during the major bull cycles of the 1980 and 2011, silver advanced by more than 1,000%, underscoring its tendency for extreme upside acceleration once momentum takes hold. If silver were to exhibit a comparable structural move in the current cycle—supported by the strength of the recent breakout and the robust momentum profile—the metal could reasonably target the $140–$150 range. Such a move would represent an appreciation of roughly 200% above the previous all-time high, aligning with the magnitude of past parabolic phases observed in the silver market.
BOTTOM LINE
Considering the convergence of these three analytical approaches—combined with my market experience, as well as the prevailing sentiment and momentum—silver appears positioned to reach the $120 range as a reasonable and achievable target for the current bull phase.
CAUTION: EDUCATION PURPOSE ONLY. NOT INVESTMENT ADVICE. DYOR
Silver

Gold & Silver Correction? Here's what 20 years of insight showsThe Gold/Silver ratio has dropped below 70 for the first time since July 2021.
Statistically, this is a strong indication of some correction in Gold and Silver (Moreso specifically Silver). Here's why.
The Gold/Silver ratio not only indicates which one of the two is outperforming, but also often hints at a likely slowdown or sharp increase in the price of bullion.
Let's look at what happened last 4 times in the last 20 years when the ratio went from 80+, down to the critical level of 70 - exactly where the ratio is at right now.
We can see that the Gold/Silver ratio almost always bounces back from 68-70 zone when it falls from 80+ (with 1 exception in 2009 where it overstretched a little and consolidated, but the outcome was still a correction in Silver as you will see below).
Below are the instances that show what happened to Silver when the ratio fell to 70 and bounced back up towards 80.
1. July 2003 to Sept 2003: Silver corrected about 6%
After posting a Year-to-date (YTD) gain of 18-20%, Silver corrected about 6% before rallying further. The correction lasted for around 2 months.
2. Feb 2009 to Apr 2009: Silver corrected about 18%
After posting a YTD gain of 28-30%, Silver corrected about 18% before rallying further. The correction lasted for around 2 months.
3. Feb 2016 to Jan 2018: Silver corrected about 22%
After posting a YTD gain of about 45%, Silver corrected about 22% before falling further. This 22% correction lasted 20 months (almost 2 years).
4. Feb 2021 to Jan 2022: Silver corrected about 19%
After posting a 125% gain from Pandemic low, Silver corrected about 20% before falling another 20% in the following months. This 20% correction lasted 12 months (almost 1 year) and further 20% correction took another 10 months.
Finally, this is where we are right now after Silver posting 100% gain in 2025.
What does this mean for you?
A] If you're an Investor invested in Silver:
We are approaching a time to potentially reduce Silver exposure (if this makes sense with capital gains, etc.) Gold may be preferred over Silver for next few months.
Why? Because in the 4 instances in 20 years, where Silver corrected roughly 20% most of the time, Gold did not correct as much. This makes sense as Gold/Silver bounces from 70 to 80, it means Gold is outperforming Silver. If your view is decadal and you wish to ride out the correction, well, do nothing.
B] If you're an Investor wanting to invest in Gold or Silver:
Consider waiting till you find a dip. That dip hasn't come all 2025, but it is highly likely it will now soon, as indicated by 20 years of data.
C] If you're a trader:
From a weekly to monthly positional viewpoint, this is probably the time to avoid or reduce position size on upside, and keep an eye out for downside reversals. For trade durations of hours to a few days also, I would still look out for opportunities with downside bias and reduce position size for upside trades.
If this is helpful and you want a deep dive into any aspects, or want specific related analyses, feel free to drop a comment.
These views are for educational purposes only and are not financial advice; please consult your licensed financial advisor before making any investment decisions.
Trade/invest with poise.

THE GREAT ROTATION: Forget $BTC, Watch $GDXJWhile the retail crowd is hyper-fixated on the flashing lights of CRYPTOCAP:BTC , NASDAQ:QQQ , and AMEX:SPY , a massive shift is happening in the shadows.
The "Easy Money" party in Tech and Crypto is getting crowded. The music is still playing, but the Smart Money is quietly grabbing their coats and heading for the exit.
Where are they going? They are rotating into the one sector that has been coiled, compressed, and ignored. The Destination: AMEX:GDXJ (Junior Gold Miners).
🧠 THE MACRO CHESS MOVE
Markets are a mechanism for transferring wealth from the impatient to the patient.
The Trap: Buying extended highs on CRYPTOCAP:BTC and NASDAQ:NVDA hoping for "one last pump."
The Opportunity: Buying the Divergence. Gold Spot ( AMEX:GLD ) is screaming at highs, but the Miners are lagging. This is a rubber band stretched to its breaking point. When it snaps back, the move isn't slow—it’s violent.
🔬 THE TECHNICAL BLUEPRINT (Daily Chart)
Forget the noise. Look at the structure.
1. THE COIL (The Setup) We are tracking a pristine Bullish Pennant formation. After an explosive rally from $90, price didn't crash—it hovered. This is institutional absorption. They are soaking up every share under $110.
2. THE LINE IN THE SAND (Support) $100 - $102. This is the fortress. As long as price holds this zone, the bulls are in total control.
3. THE IGNITION (The Trigger) $112. Mark this level. Alert it. Tattoo it. A daily close above $112 is the signal that the accumulation phase is over and the Markup Phase begins. This is "Blue Sky" territory.
🎯 THE PAYOFF (Scenario Mapping)
If the Capital Rotation kicks into high gear:
First Stop: $120 (The Psychological Barrier).
The Measured Move: $135+. This isn't a random number; it's the mathematical projection of the previous impulse leg.
🔥 THE VERDICT
The herd is looking Left ( CRYPTOCAP:BTC ). The Professionals are looking Right ( AMEX:GDXJ ). The chart is coiled. The macro winds are shifting. The rotation is real.
Don't watch the history books. Watch the charts.
⚠️ Disclaimer
This content is for educational and informational purposes only and does not constitute financial, investment, or trading advice. The author is not a licensed investment advisor or portfolio manager. Trading financial markets involves high risk. All decisions are made at your own discretion.
🚀 Follow us for more No-BS trade ideas & indicators AlphaRank

XAUUSD: triangle compression🛠 Technical Analysis: On the 4-hour timeframe, Gold (XAUUSD) is consolidating within a small symmetrical triangle, signaling an imminent breakout. The chart analysis projects a potential "fake-out" or liquidity grab towards the upper resistance zone at 4,250 – 4,280 to liquidate early short sellers before a major reversal. Following this potential spike, the technical structure favors a bearish continuation, targeting the medium-term support level at 3,902.
———————————————
❗️ Trade Parameters (SELL)
———————————————
➡️ Entry Point: Sell Limit at Resistance (approx. 4,250 – 4,280)
🎯 Take Profit: 3,902 (Support)
🔴 Stop Loss: Above the upper resistance structure (approx. 4,320)
⚠️ Disclaimer: This is a potential trade idea based on current analysis; market conditions and price direction are subject to change based on news factors and volatility.

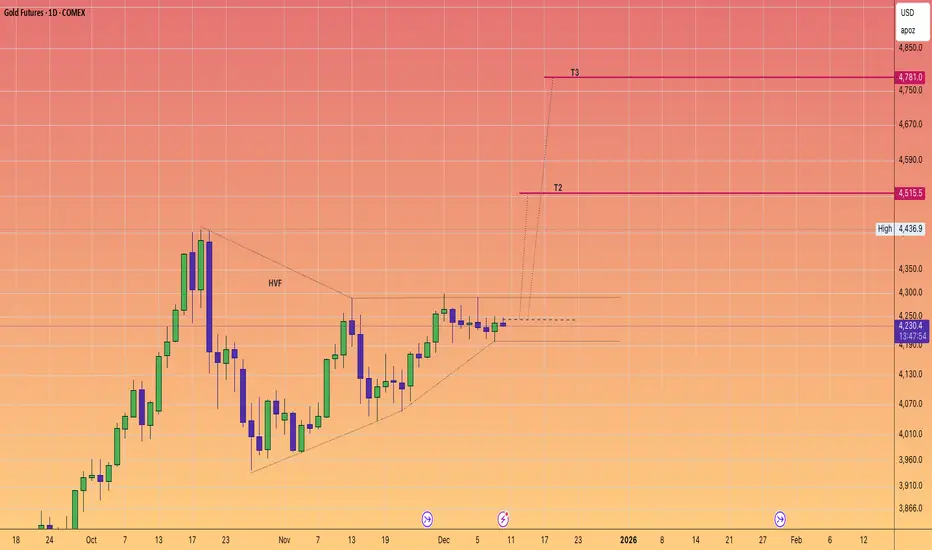
GOLD in a windup. Targets $4800AS we progress ever closer to the quite historic level of $5k for #GOLD
We note that Gold has been quite predictable and routinely has delivered +20% powerful moves since 2024.
The price action currently suggests we are about have another pop very soon.
Will it be enough to tag the $5K level
odds suggest that it definitely on the table.
The #HVF pattern points to $4800 and with some over performance we are right on that doorstep.
Hit All Your Monthly Targets with XAGUSDLadies and gentlemen, XAGUSD is about to activate a trigger that could kick off another uptrend rally for silver—but nailing it won't be that easy... let's break it down. 🔍
I’m Skeptic , founder of Skeptic Lab. If you want to elevate your long-term performance through genuine psychology, data-driven insights, and proven strategies, you’ve landed in the right spot.
In the daily timeframe, after smashing through the ceiling at 54.47959 and surging 8% , we're now ranging just below the resistance at 58.79759 . But every candle that's printed has been pushing hard to break this level: long lower shadows and short upper ones, signaling sellers tried to drag the price down, but buyers fought back fiercely and closed the body strong.
Tomorrow's rate news drops. Over 89.6% are betting on a 25 basis point cut (source: according to the CME FedWatch Tool). What does this mean in plain English? Borrowing gets cheaper, liquidity floods into stocks, companies ramp up investments = boom for commodities, equities, and Bitcoin. But on the flip side, the market might have already priced this in.
Silver's massive run-up these past weeks? Largely because forecasts have been screaming "rate cut incoming"...
My take? If we can open the position today and lock in profits tomorrow pre-news—making it fully risk-free—that's ideal. If we hit stop loss, hey, we gained real market insight (priceless), and exited with zero risk hanging over us. Win the trade? Massive R/R upside. + Slash your risk—drop from 1% to 0.1% exposure—so a stop barely stings. (News trades have lower win rates, hence the low risk play :) )
In the 1H timeframe, a breakout candle above 58.79759 fires our long trigger. Stay out of lower frames, please! They're full of shit candles, insane volatility, and fakeout traps—since the core momentum and real action is locked in 1H right now.
That's it—DO NOT FOMO in, and if this analysis hits your feed, a quick boost on that rocket button keeps the vibes going :) 🩵
Now get outta here.

SILVER (XAGUSD) – Short-Term DangerOn Monday, I highlighted something important in my Silver analysis: after a full week of rectangle consolidation, the most probable scenario was an upside break — with a projected target around 61.
I also repeated a point I’ve been making for weeks: Silver continues to look stronger than Gold.
Fast-forward to now:
🔹 That 61 target has been reached
🔹 Silver rallied more than 3,000 pips from the bottom to the high yesterday
🔹 The broader bullish trend is not in question
Let me be very clear: this post is not about denying the bullish structure.
The trend is intact, momentum is real, and a new ATH is absolutely possible.
⚠️ The Warning: A Short-Term Drop Is Becoming Likely
This is a timing post, not a trend post.
If you are a short-term trader and not already long, entering here is pure FOMO — and extremely risky.
Why? Because the market just moved 13,000 pips in 20 days. That is not sustainable without a reset.
Technically, the structure is stretched, and the probability of a corrective move is increasing.
📉 Levels to Watch for a Pullback
- 59 – my base expectation for the next corrective wave
- 55 – not my primary scenario, but absolutely possible considering the size of the latest rally
Neither scenario breaks the bullish trend. These would simply be healthy retracements inside the larger upward trajectory.
📌 Final Thoughts
The trend is bullish.
The long-term outlook is strong.
But the entry right now is terrible unless you're already positioned.
Stay disciplined. Wait for the market to reset.
Silver will offer better opportunities — don’t let FOMO make the decision for you!

Palladium Daily Squeeze Currently watching a daily squeeze looking to breakout on NYMEX:PA1! (I am trading this via AMEX:PALL ).
Should have a nice move up if this breaks bullishly, with an initial target of $1700.

SILVER Is Very Bearish! Sell!
Please, check our technical outlook for SILVER.
Time Frame: 1h
Current Trend: Bearish
Sentiment: Overbought (based on 7-period RSI)
Forecast: Bearish
The price is testing a key resistance 5,871.4.
Taking into consideration the current market trend & overbought RSI, chances will be high to see a bearish movement to the downside at least to 5,754.1 level.
P.S
Overbought describes a period of time where there has been a significant and consistent upward move in price over a period of time without much pullback.
Like and subscribe and comment my ideas if you enjoy them!

Stop!Loss|Market View: GOLD🙌 Stop!Loss team welcomes you❗️
In this post, we're going to talk about the near-term outlook for GOLD ☝️
Potential trade setup:
🔔Entry level: 4167.192
💰TP: 3900.356
⛔️SL: 4370.061
"Market View" - a brief analysis of trading instruments, covering the most important aspects of the FOREX market.
👇 In the comments 👇 you can type the trading instrument you'd like to analyze, and we'll talk about it in our next posts.
💬 Description: After breaking out of the accumulation in a symmetrical triangle, gold prices formed an accumulation near the 4200 level, indicating the emergence of a potential limit seller who, after breaking out of the accumulation, will sell the instrument to those willing to buy at the breakout. Against this backdrop, a downward movement is likely expected, and given the potential volatility this week, two scenarios are being considered.
Thanks for your support 🚀
Profits for all ✅

XAGUSD 1h
Silver hold the price above a resistance line in the consolidation zone, if the 4h candle closed above this line there would be chance to move upward, also for swingers, we need to see close of daily candle above the box to meet ATH.
Stay tuned for our next updates.

Silver sideways consolidation, resistance retest The Silver remains in a bullish trend, with recent price action showing signs of a corrective pullback within the broader uptrend.
Support Zone: 5420 – a key level from previous consolidation. Price is currently testing or approaching this level.
A bullish rebound from 5420 would confirm ongoing upside momentum, with potential targets at:
5875 – initial resistance
6000 – psychological and structural level
6106 – extended resistance on the longer-term chart
Bearish Scenario:
A confirmed break and daily close below 5420 would weaken the bullish outlook and suggest deeper downside risk toward:
5350 – minor support
5275 – stronger support and potential demand zone
Outlook:
Bullish bias remains intact while the Silver holds above 5420. A sustained break below this level could shift momentum to the downside in the short term.
This communication is for informational purposes only and should not be viewed as any form of recommendation as to a particular course of action or as investment advice. It is not intended as an offer or solicitation for the purchase or sale of any financial instrument or as an official confirmation of any transaction. Opinions, estimates and assumptions expressed herein are made as of the date of this communication and are subject to change without notice. This communication has been prepared based upon information, including market prices, data and other information, believed to be reliable; however, Trade Nation does not warrant its completeness or accuracy. All market prices and market data contained in or attached to this communication are indicative and subject to change without notice.

Silver pump vs the Algo - Who will win?COMEX:SI1! COMEX_MINI:SIL1! TVC:SILVER
The algorithm has reached a terminal exhaustion state at the 4.0 Standard Deviation Macro-Extension effectively completing the parabolic expansion cycle initiated from the 2024 lows.
The current price action represents a 'Distribution Node' at the 60.00 psychological event horizon where the Smart Money is actively offloading inventory into late retail buyers before initiating a high-velocity repricing event to the 54.020 algorithmic equilibrium.
Entry: 58.850 (Market Execution / Sell Limit)
Stop loss: 60.150 (1.300 points)
Take profit: 54.020 (4.830 points)
Risk to reward ratio: 3.71R
The Opportunity
The Monthly chart reveals the absolute truth: Price has struck the 4.0 Standard Deviation projection. In the realm of IPDA, this is the 'Statistical Extremity'—a zone where the probability of continued vertical expansion collapses to near zero and the probability of a mean reversion increases exponentially.
The market has left a massive 'Liquidity Void' between 54.00 and 58.00. This is not structural support; it is thin air. The algorithm abhors this vacuum. The 54.020 level identified is not merely a support level; it is the 'Fair Value' origin of the final impulse leg. The market must return here to close the circuit and validate the breakout.
The Entry
Entering short at the 58.850 region capitalizes on the 'bull trap' formed by the failure to displace above 59.50. The 8-hour chart shows a loss of momentum and the formation of a 'Rounded Top' distribution profile.
The algorithm is currently holding price up solely to induce 'Fear of Missing Out' (FOMO) longs. Once the Asian/London liquidity is swept, the floor will be removed, and the price will seek the path of least resistance: down through the vacuum.
The Invalidation
The bearish causal chain is ontologically corrupted if price achieves a daily close above the 60.150 Omega Point.
A breach of this level would imply that the market has entered a 'Hyper-Inflationary' discovery mode, ignoring standard deviation constraints.
This would shift the probability manifold to the Primary Antithetical Chain targeting the 62.00-65.00 vector.
Key Trajectory Waypoints
Target 1: 57.200 | Type: Immediate Structural Low | Probability: 85% | ETA: 24-48 Hours
Target 2: 55.500 | Type: 1.5 SD / Mid-Void | Probability: 70% | ETA: End of Week
Target 3: 54.020 | Type: The Great Rebalance | Probability: 55% | ETA: 1-2 Weeks
The Shadow Reality
A 20% probability exists for the antithetical reality: The Flag Continuation.
In this scenario, the 58.00 level acts as a 'High Tight Flag' support, and the market consolidates sideways to burn time before one final thrust to 61.00.
This reality is confirmed if price refuses to trade below 57.80 for 48 hours.

SILVER BEARS WILL DOMINATE THE MARKET|SHORT
SILVER SIGNAL
Trade Direction: short
Entry Level: 5,843.1
Target Level: 5,765.0
Stop Loss: 5,895.0
RISK PROFILE
Risk level: medium
Suggested risk: 1%
Timeframe: 9h
Disclosure: I am part of Trade Nation's Influencer program and receive a monthly fee for using their TradingView charts in my analysis.
✅LIKE AND COMMENT MY IDEAS✅

Part 2 - Analysis on Silver and trade setupThis is the second party of a previous video I did on XAGUSD (although accidentally called it UJ in the title of the last video).
I hope you find it insightful. All the analysis is included in the video. Also some teaching.
- R2F Trading

BRIEFING Week #49 : Watch Oil & USDJPYHere's your weekly update ! Brought to you each weekend with years of track-record history..
Don't forget to hit the like/follow button if you feel like this post deserves it ;)
That's the best way to support me and help pushing this content to other users.
Kindly,
Phil

Silver is in the Bearish directionHello Traders
In This Chart XAGUSD HOURLY Forex Forecast By FOREX PLANET
today XAGUSD analysis 👆
🟢This Chart includes_ (XAGUSD market update)
🟢What is The Next Opportunity on XAGUSD Market
🟢how to Enter to the Valid Entry With Assurance Profit
This CHART is For Trader's that Want to Improve Their Technical Analysis Skills and Their Trading By Understanding How To Analyze The Market Using Multiple Timeframes and Understanding The Bigger Picture on the Charts

SILVER: Bearish Continuation & Short Trade
SILVER
- Classic bearish pattern
- Our team expects retracement
SUGGESTED TRADE:
Swing Trade
Sell SILVER
Entry - 58.349
Stop - 58.743
Take - 57.644
Our Risk - 1%
Start protection of your profits from lower levels
Disclosure: I am part of Trade Nation's Influencer program and receive a monthly fee for using their TradingView charts in my analysis.
❤️ Please, support our work with like & comment! ❤️

The AI Boom's Unsung HeroThe rise of artificial intelligence isn’t just shaking up tech companies it’s quietly transforming the global silver market in a big way. As major players like NVIDIA, Google and others ramp up their AI infrastructure silver is becoming more critical than ever. Why? Because silver, thanks to its unmatched electrical conductivity, plays a key role in powering the hardware behind AI.
Silver is the most conductive metal on Earth. That makes it perfect for high-performance computing something AI needs a lot of. It’s especially important in data centers and advanced semiconductors, where both electrical and thermal performance are mission-critical.
What’s really interesting is that AI servers tend to use two to three times more silver than traditional data center servers. That’s because AI workloads are more power-hungry, generate more heat and require more complex cooling and electrical systems. Simply put, more AI means more silver.
If there’s one company at the heart of this trend it’s NVIDIA. Analysts at Morgan Stanley expect NVIDIA to consume a staggering 77% of all silicon wafers used for AI accelerators in 2025 up from 51% in 2024. That adds up to around 535,000 300-mm wafers a year each of which contains silver in key components.
All of this AI growth is showing up in the numbers. Industrial silver demand hit an all-time high of 680.5 million ounces in 2024. The electronics industry alone uses around 250 million ounces per year and AI is now the fastest-growing part of that.
Despite all this demand, silver supply just isn’t keeping up. The market’s been in deficit for four straight years, with a total shortfall of 678 million ounces between 2021 and 2024. That’s roughly ten months of global mine output gone missing from the balance sheet.
It’s no surprise, then, that silver prices have been climbing fast. As of July 2025 silver’s up nearly 30% for the year. Looking further ahead I see room for silver to keep climbing:
In the short term (2025): $36–$42 per ounce seems realistic
By 2026: Potential for $50+ as more AI growth stays strong
AI isn’t just changing how we work, communicate, or compute—it’s literally reshaping the commodities that make this technology possible. Silver, once thought of mainly in the context of jewelry or coins, is now a backbone material for the AI revolution.

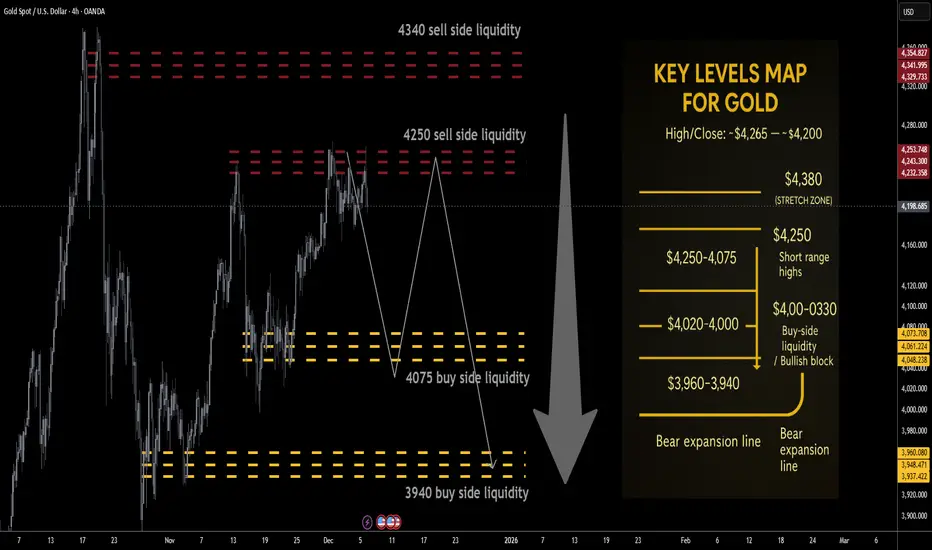
Gold next week Key S/R Levels and Outlook for Traders🔥 GOLD WEEKLY SNAPSHOT — BY PROJECTSYNDICATE
🏆 Swing High / Swing Low
$4,265 → ~$4,164 — clean rejection from the 4,26x breakout zone with a long upper wick, but weekly close still near $4,200, keeping price pinned in the upper part of the broader $4k range.
📈 Trend
Higher-timeframe: Structural bull trend intact while price holds above the $3,940–$4,000 block.
Tactical: Last week’s failed extension above $4,250 and the close back near $4,200 tilt the tape into distributive mode:
Rallies into $4,250 / $4,340 = sell-side liquidity magnets.
Downside liquidity sits lower at $4,075 / $3,940, making upside risk/reward look asymmetric to the downside from current levels.
🛡 Supports – Buy-Side Liquidity / Downside Objectives
$4,130–$4,100:
Short-term intraday pivot where buyers repeatedly stepped in last week; first micro-reaction zone on any flush.
$4,090–$4,075 🟢 Buy-side liquidity #1
First true BSL pocket below the close; ideal TP1 for shorts from above and a spot where responsive dip-buyers are likely to probe.
$4,020–$4,000:
Psychological shelf; loss of 4k would confirm that local distribution is winning and open the deeper BSL run.
$3,960–$3,940 🟢 Buy-side liquidity #2 / structural block
Higher-timeframe demand and key liquidity magnet for a fuller corrective leg. A sustained break/acceptance below $3,940 would signal that the 2025 blow-off is transitioning into broader mean-reversion rather than shallow consolidation.
🚧 Resistances – Sell-Side Liquidity / Short-Side Focus
$4,220–$4,250 🔴 Sell-side liquidity #1
First overhead supply from the prior week’s failed breakout structure and just under recent highs. Clean area for “sell the rip” probes and for late longs to de-risk.
$4,300–$4,340 🔴 Sell-side liquidity #2
Extension / SLI pocket aligned with the upper part of last week’s range and just below the prior $4,38x–$4,40x all-time high band. Ideal for scaling adds if a news-driven squeeze runs stops above 4,250.
Stretch: $4,380–$4,400:
Prior record spike / stop-run area; only expected on a full-on squeeze into the Fed, but a tag here would likely be exhaustion rather than a new sustainable trend leg higher.
🧭 Bias Next Week
Base tactical bias: fade strength / short rallies, not chase upside.
the tape favors a liquidity grab higher → rotation lower scenario:
Look for wicks into $4,220–$4,340 to be sold.
Downside path of least resistance: $4,090–$4,075 → $4,020–$4,000 → $3,960–$3,940.
⚖️ Base Case Scenario
Open/early week:
Price opens near $4,200 and either trades flat or spikes briefly into $4,220–$4,250 on weekend gap/early flow.
Liquidity sweep into resistance:
Rejection from SLI:
Failure to accept above $4,250/4,300 leaves upper wicks on 4H/daily, signaling distribution.
Rotation into BSL:
First objective: $4,090–$4,075 (TP1)
Secondary objective: $4,020–$4,000 (TP2)
Stretch / full flush: $3,960–$3,940 (TP3) into the structural demand block and buy-side liquidity pocket.
🚀 Breakout / Invalidation Trigger
Bearish framework invalidation:
A strong daily/weekly acceptance above $4,380 would imply shorts caught offside and re-open the path toward $4,450+ in line with the higher Street targets for 2026.
In that case, shift from short-the-rip → neutral / buy shallow pullbacks until a new top structure forms.
🔓 Bull / Bear Trigger Lines
Structural bull line:
Above $3,940–$4,000: long-term bull structure remains intact. Even if you’re tactically short, treat deep moves into this area with respect – this is where higher-timeframe players are likely to re-accumulate.
Bear expansion line:
Below $3,940: opens scope for a faster liquidation wave toward $3,880–$3,850 and potentially a broader 2025–26 consolidation phase instead of immediate continuation higher.
🧭 Recommended Strategy – Short at Market Open
⚠️ Illustrative trade plan, not financial advice. Size and risk-manage according to your own rules.
1️⃣ Primary Short – Open + Fade the Rips
Short at/near market open around the $4,195–$4,210 zone if price opens below $4,220 and orderflow confirms rejection of higher bids.
Add / build zones:
Add 1: into $4,220–$4,250 (first SLI band / prior breakout zone).
Add 2 (only if spike): $4,300–$4,340 (second SLI; look for clear blow-off / stop-run behavior before loading the last clip).
Stops / invalidation:
Tactical stop: hard stop above $4,380.
More conservative: soft line at $4,340, hard stop $4,390–$4,400 to allow for intraday wicks.
Targets (aligned with buy-side liquidity):
TP1: $4,090–$4,075 → take partials and reduce risk.
TP2: $4,020–$4,000 → core target for the week if distribution plays out.
TP3: $3,960–$3,940 → full BSL sweep into structural demand; expect responsive buying attempts here.
SILVER My Opinion! SELL!
My dear followers,
I analysed this chart on SILVER and concluded the following:
The market is trading on 58.349 pivot level.
Bias - Bearish
Technical Indicators: Both Super Trend & Pivot HL indicate a highly probable Bearish continuation.
Target - 57.776
Safe Stop Loss - 58.724
About Used Indicators:
A super-trend indicator is plotted on either above or below the closing price to signal a buy or sell. The indicator changes color, based on whether or not you should be buying. If the super-trend indicator moves below the closing price, the indicator turns green, and it signals an entry point or points to buy.
Disclosure: I am part of Trade Nation's Influencer program and receive a monthly fee for using their TradingView charts in my analysis.
———————————
WISH YOU ALL LUCK

XAGUSD H1 | Bearish Reaction Off Pullback ResistanceMomentum: Bearish
Price is currently below the ichimoku cloud.
Sell entry: 57.933
- Strong pullback resistance
- 61.8% Fib retracement
- 100% Fib projection
- Fair Value Gap
Stop Loss: 58.903
- Swing high resistance
Take Profit: 56.729
- Swing low support
High Risk Investment Warning
Stratos Markets Limited (tradu.com/uk ), Stratos Europe Ltd (tradu.com/eu ):
CFDs are complex instruments and come with a high risk of losing money rapidly due to leverage. 70% of retail investor accounts lose money when trading CFDs with this provider. You should consider whether you understand how CFDs work and whether you can afford to take the high risk of losing your money.
Stratos Global LLC (tradu.com/en ): Losses can exceed deposits.
Please be advised that the information presented on TradingView is provided to Tradu (‘Company’, ‘we’) by a third-party provider (‘TFA Global Pte Ltd’). Please be reminded that you are solely responsible for the trading decisions on your account. Any information and/or content is intended entirely for research, educational and informational purposes only and does not constitute investment or consultation advice or investment strategy. The information is not tailored to the investment needs of any specific person and therefore does not involve a consideration of any of the investment objectives, financial situation or needs of any viewer that may receive it. Past performance is not a reliable indicator of future results. Actual results may differ materially from those anticipated in forward-looking or past performance statements. We assume no liability as to the accuracy or completeness of any of the information and/or content provided herein and the Company cannot be held responsible for any omission, mistake nor for any loss or damage including without limitation to any loss of profit which may arise from reliance on any information supplied by TFA Global Pte Ltd.

SILVER (XAGUSD): Consolidation & Trading Plan
Silver keep coiling within a narrow range on a daily.
Depending on the side of its breakout, I expect 2
potential scenarios.
If the market breaks and closes above 59.0 - the resistance
of the range, expect a bullish continuation to 60.0 level.
If the market breaks and closes below 56.2 - the support
of the range, expect a down movement to 54.5
Alternatively, keep trading the market within the range,
buying from the support and selling from the resistance.
❤️Please, support my work with like, thank you!❤️
I am part of Trade Nation's Influencer program and receive a monthly fee for using their TradingView charts in my analysis.
