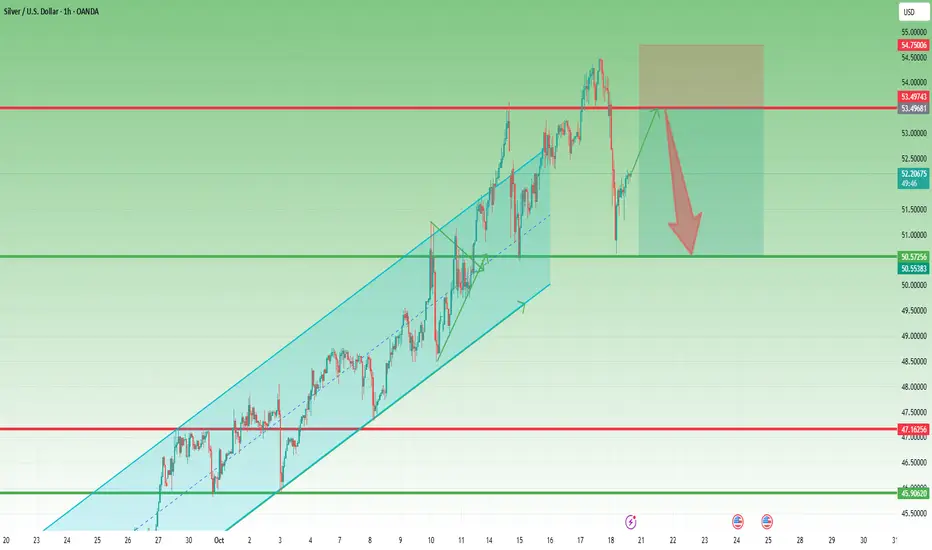
Silver: After New All-Time Highs, a Sharp CorrectionLast week, Silver reached a new all-time high, almost touching my $55 target.
However, on Friday, the market delivered a powerful sell-off, with the price dropping by around 4,000 pips — from the $54.50 ATH down to the $50.50 support zone.
At this stage, I expect the price to stabilize and form a temporary base of consolidation.
My focus now shifts to the $53.50 resistance zone, which could act as a short-term decision point.
If I observe signs of weakness or rejection in that area, I’ll consider short positions, targeting a potential retest of the $50 support zone.
Silver
SILVER Strong Rejection! Buy!
Hello,Traders!
SILVER Price just reacted from a horizontal demand area after a deep liquidity sweep below the previous low. Buyers stepped in strongly, hinting at a possible continuation higher toward the target zone near $52.80 where unfilled orders remain. Expect bullish momentum to extend if the demand zone holds.
Time Frame 5H.
Buy!
Comment and subscribe to help us grow!
Check out other forecasts below too!
Disclosure: I am part of Trade Nation's Influencer program and receive a monthly fee for using their TradingView charts in my analysis.

Silver is in the Down TrendHello Traders
In This Chart XAGUSD HOURLY Forex Forecast By FOREX PLANET
today XAGUSD analysis 👆
🟢This Chart includes_ (XAGUSD market update)
🟢What is The Next Opportunity on XAGUSD Market
🟢how to Enter to the Valid Entry With Assurance Profit
This CHART is For Trader's that Want to Improve Their Technical Analysis Skills and Their Trading By Understanding How To Analyze The Market Using Multiple Timeframes and Understanding The Bigger Picture on the Charts

SILVER Expected Growth! BUY!
My dear friends,
SILVER looks like it will make a good move, and here are the details:
The market is trading on 51.814 pivot level.
Bias - Bullish
Technical Indicators: Supper Trend generates a clear long signal while Pivot Point HL is currently determining the overall Bullish trend of the market.
Goal - 52.913
Recommended Stop Loss - 51.290
About Used Indicators:
Pivot points are a great way to identify areas of support and resistance, but they work best when combined with other kinds of technical analysis
Disclosure: I am part of Trade Nation's Influencer program and receive a monthly fee for using their TradingView charts in my analysis.
———————————
WISH YOU ALL LUCK

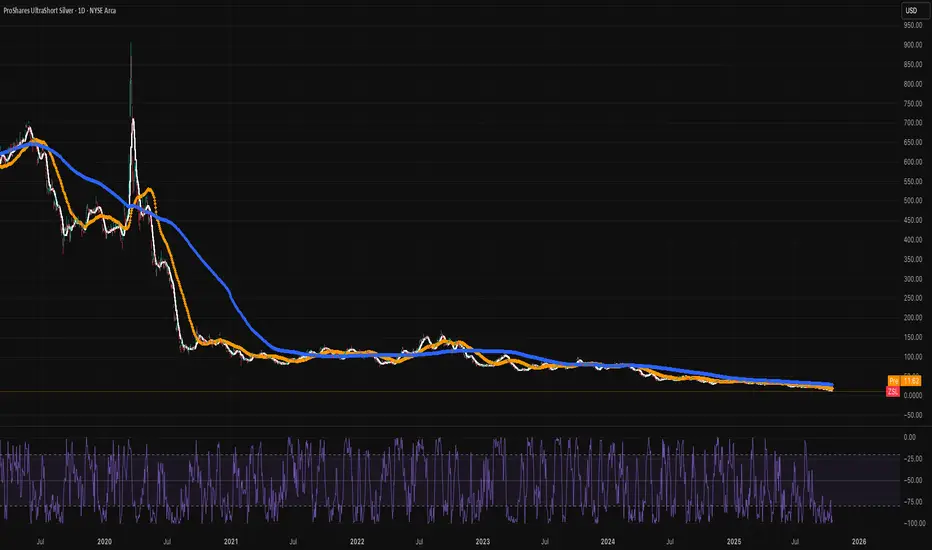
Add Silver to your ALERTSHave been watching Silver recently and while I hear some of the bullish feelings around it, I do want to caution that it is very volatile esp. at these levels. The issue is not whether you think it's a good hedge or not, but that there are a number of speculators that simply profit once their asset reaches a certain level. Also, the world generates around 800M"ish" of ounces in a given year and we're at 1 billion demand. What does that mean? There will be trust issues when the supply chain breaks, and it will break esp. when future contracts expire and delivery is expected within 72 hours and cannot be met. I could be way off here, or not :) I follow macros, trends, and call out BS all the time when I see it.
Add ZSL (inverse of Silver) to your alerts asap. It will spike very soon!
Best of luck!
Canadian Venture index --- Inverse head & shouldersGold has reached unprecedented heights, approaching the $3000 mark—a prediction we made with precision. Now is the moment to turn our attention to silver and the mining sector.
To start, let's examine the Canadian venture index, which is displaying a promising inverse head and shoulders pattern. I am confident that the logarithmic projection will be achieved without much difficulty.

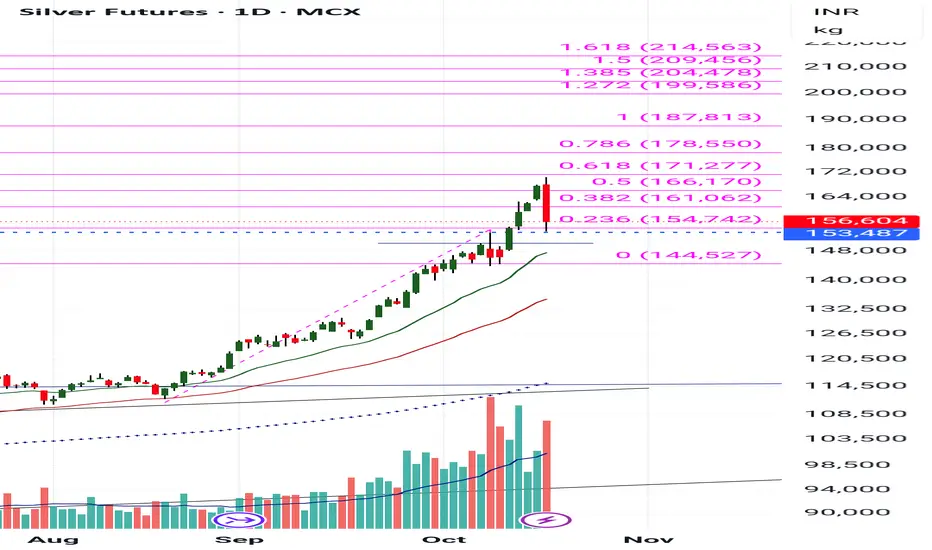
Silver 6% FallSilver corrected by 6% yesterday after a beautiful recent rally.
It touched 23.6% of Fibonacci. Expecting some consolidation now for say 2-3 days before hopefully bouncing back.
Let's see the opening of Monday !!!
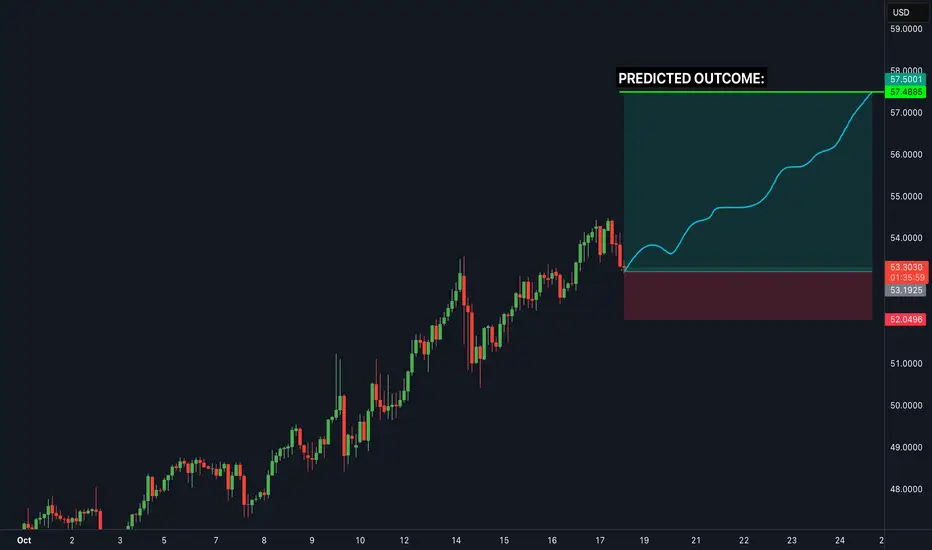
Silver Market Update Easy Breakdown!Silver’s been showing some strong moves lately ⚡ but it’s at a key decision point right now.
Here’s what I’m watching:
📉 If silver drops below 51.2, we could see a pullback toward 49.30–49.00 before the next push higher.
📈 For silver to reach the next big highs around $70, it needs to break above 52.60 first.
If that happens, the next targets are 54.60 and 57.00.
💡 So short-term dips? Totally normal.
Long-term silver still looks strong if it can clear those resistance levels.
Want to see how I’m reading these moves and what I’m watching next before it happens?
💬 DM me “SILVER” and I’ll share my private breakdown and targets directly.
Mindbloome Exchange
Trade Smarter Live Better

SILVER: Trading Signal From Our Team
SILVER
- Classic bullish formation
- Our team expects growth
SUGGESTED TRADE:
Swing Trade
Buy SILVER
Entry Level - 51.814
Sl - 51.223
Tp - 52.966
Our Risk - 1%
Start protection of your profits from lower levels
Disclosure: I am part of Trade Nation's Influencer program and receive a monthly fee for using their TradingView charts in my analysis.
❤️ Please, support our work with like & comment! ❤️

SILVER GROWTH AHEAD|LONG|
✅SILVER After tapping into the demand level, price is expected to retrace higher as liquidity beneath the previous low has been cleared. A potential bullish reaction from this zone could drive the market toward the 52.50$ target area. Time Frame 2H.
LONG🚀
✅Like and subscribe to never miss a new idea!✅

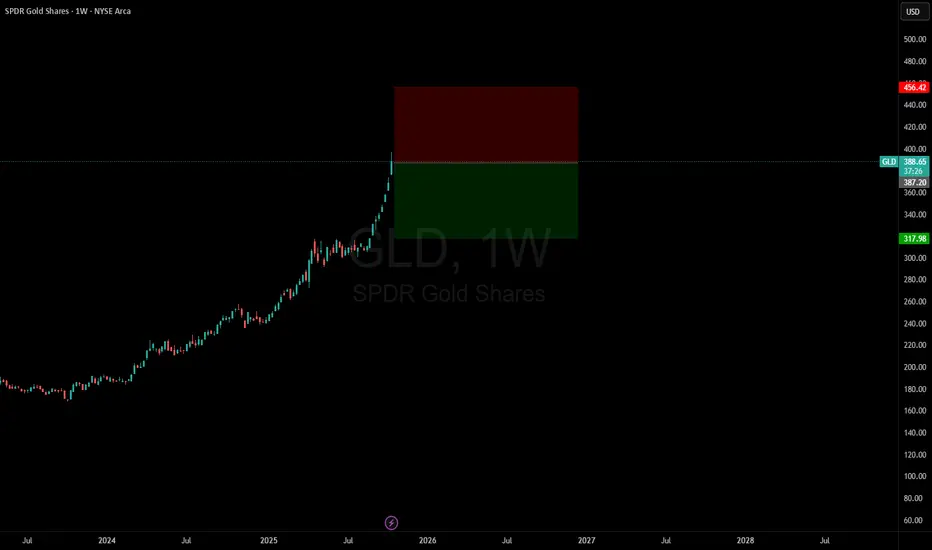
Short GLDGold is now over $4,200 and I believe there is a trade to the down-side.
Understand, it VERY hard to call a top in such a powerful bull market move. Most of the time, you WILL lose this trade.
Even when you do win these type of trades, the price action will usually go against you before it goes in the right direction.
It is a market. You WILL be tested.
That’s how price discovery works.
The truth is that if you're trying to outperform market-level returns, you MUST take risks.
SILVER Strong Uptrend! Buy!
Hello,Traders!
SILVER SMC based analysis shows price retracing toward the rising trend-line to rebalance short-term liquidity before another bullish leg. Buyers are expected to defend the structure and push price back toward the upper target zone near $5,296. Time Frame 5H.
Buy!
Comment and subscribe to help us grow!
Check out other forecasts below too!
Disclosure: I am part of Trade Nation's Influencer program and receive a monthly fee for using their TradingView charts in my analysis.

Sell Silver @47Sell SILVER @47
Silver will face major resistance at 47-48
Target1 - 40
Target2 - 37.8
Buy Silver at 40-37 only/-
Disclaimer :-
I am not SEBI registered. The information provided here is for education purposes only.
I will not be responsible for any of your profit/loss with this channel suggestions.
Consult your financial advisor before taking any decisions.

Silver corrective pullback supported at 5187The Silver remains in a bullish trend, with recent price action showing signs of a corrective pullback within the broader uptrend.
Support Zone: 5187 – a key level from previous consolidation. Price is currently testing or approaching this level.
A bullish rebound from 5187 would confirm ongoing upside momentum, with potential targets at:
5450 – initial resistance
5513 – psychological and structural level
5580 – extended resistance on the longer-term chart
Bearish Scenario:
A confirmed break and daily close below 5187 would weaken the bullish outlook and suggest deeper downside risk toward:
5055 – minor support
4960 – stronger support and potential demand zone
Outlook:
Bullish bias remains intact while the silver holds above 5187. A sustained break below this level could shift momentum to the downside in the short term.
This communication is for informational purposes only and should not be viewed as any form of recommendation as to a particular course of action or as investment advice. It is not intended as an offer or solicitation for the purchase or sale of any financial instrument or as an official confirmation of any transaction. Opinions, estimates and assumptions expressed herein are made as of the date of this communication and are subject to change without notice. This communication has been prepared based upon information, including market prices, data and other information, believed to be reliable; however, Trade Nation does not warrant its completeness or accuracy. All market prices and market data contained in or attached to this communication are indicative and subject to change without notice.


BUY SILVER! Perfect trade setupBased on deep analysis we can see silver is heading to the upside... this is a perfect risk to reward trade setup. Low risk high reward
ZSL hidden gem (silver inverse)When things go back and insolvency hits, Silver could go down (by a lot). Keep an eye on this sleeping giant. There are many who know that we are tipping the scale no Gold and Silver and it's not sustainable. It's way too hot and the early signs of weakness will lead to major dip. ZSL is the inverse ETF. Keep an alert on this baby. Best of luck!
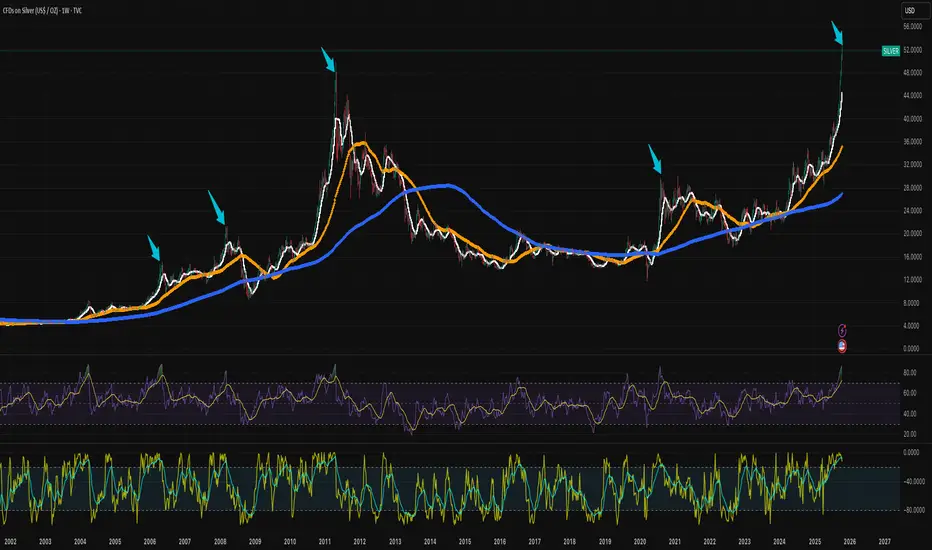
SILVER - Cinderella Gold Ready To ShineSilver, aka as Cinderella Gold.
Can it outperform Gold?
as Dollar takes loses?
Can it come clkose to it's close to 50$ All time highs?
To be found out soon and all this depends on the Feds.
One Love,
THE FXPROFESSOR

Gold traders - White House to speak on China shortlyGold’s impressive rally has been powered by a mix of rate-cut expectations, political risk, central bank buying, and dollar weakness.
Gold traders’ focus this week has been on the escalating U.S.–China trade tensions though.
Markets are standing by for a statement from the White House, expected within the hour.
We’ll post updates here once the White House statement is released and markets begin to react.

Platinum 10 years accumulation 2 000 USD Overview of Catalysts
Here’s a detailed look at the top 10 key catalysts influencing platinum prices—and how they stack up on a 0–10 impact scale 🎯.
1. Supply Deficits (Mining Shortfalls) ⛏️
Trend: Persistent structural deficits—the largest since 2013—with a projected deficit of \~598 koz in 2024.
Drivers: Declining output in South Africa and Russia, underinvestment, and aging mines.
Impact Score: 10/10 – Direct upward pressure on price.
2. Industrial Demand & Green-Energy Growth 🏭
Trend: Industrial consumption is booming, with strong growth in sectors like wind turbines, glass, and electronics.
Support: This broad demand fuels a large part of the supply deficit, and goes well beyond automotive use.
Impact Score: 9/10 – Strong structural support.
3. Auto Catalyst Substitution (Pd → Pt) 🔄
Trend: Cost-effective substitution as platinum approaches price parity with palladium; significant volume was substituted in 2023, with more projected for 2024.
Significance: Boosts automotive demand in an area previously dominated by palladium.
Impact Score: 8/10.
4. Electric Vehicle Adoption (EVs) ⚡
Trend: EVs don’t use platinum in catalytic converters, which is a structural hit to demand as EV growth continues.
Significance: Long-term downside pressure.
Impact Score: 7/10.
5. Hydrogen Fuel Cell Demand 💧
Trend: Hydrogen vehicles use platinum, with projected demand growth toward 2030.
Limitations: Growth remains slower than battery EVs.
Impact Score: 6/10.
6. Recycling Constraints 🔄
Trend: Recycling, which provides about a quarter of supply, is falling due to fewer end-of-life vehicles and glass, reducing the supply buffer.
Market Effect: This amplifies supply tightness.
Impact Score: 6/10.
7. Chinese Emission Policies 🏭
Trend: China’s tightening emissions regulations are supporting demand, with end uses well protected against a slowdown.
Importance: China is the largest platinum user; policy gives stability.
Impact Score: 7/10.
8. Jewellery & Investment Trends 💍
Trend: Jewellery demand remains steady, and investment demand is rising.
Note: This is a smaller demand segment, but it is supportive.
Impact Score: 5/10.
9. Macroeconomic & Auto Production Outlook 📉
Trend: Weak global auto production is lowering platinum use, but recovery in auto could lift demand.
Aftermath: Economic rebound could support prices.
Impact Score:** 5/10.
10. Speculative Sentiment & Positioning 📈
Trend: Inventories are depleted; investors are waiting for a breakout.
Tipping Point: A price surge could spark momentum-driven demand.
Impact Score:** 4/10.
| Rank | Catalyst | Score (/10) |
| ---- | ---------------------------------- | ----------- |
| 1 | Supply Deficit | 10 |
| 2 | Industrial / Green-Energy Demand | 9 |
| 3 | Auto Catalyst Pd → Pt Substitution | 8 |
| 4 | EV Adoption (Negative Impact) | 7 |
| 5 | Chinese Emission Policies | 7 |
| 6 | Hydrogen Fuel Cell Growth | 6 |
| 7 | Recycling Constraints | 6 |
| 8 | Jewellery & Investment Demand | 5 |
| 9 | Macro Slowdowns / Auto Production | 5 |
| 10 | Speculative Positioning | 4 |
📌 Key Insights & Outlook
* Tight supply and diversified demand—especially from green energy and industrial sectors—are the strongest bullish forces for platinum.
* Auto-driven substitution offers further upside, while EV growth and recycling limitations act as constraints.
* Chinese regulations add resilience; hydrogen offers potential if growth accelerates.
* Jewellery and investment flows remain minor but supportive.
* Much depends on auto sector recovery and investor psychology—momentum effects could amplify gains if technical levels break.
🔮 Final Take
Platinum remains positioned for medium-term strength, thanks to severe supply tightness and robust non-auto demand drivers. For investors, key areas to watch are further deficits, industrial trends, and catalytic substitution. Be mindful of potential headwinds from EV adoption and macroeconomic softness, but the structural case remains compelling.

Silver - Can it go to 50$? We like to hedge by Buying Silver and selling Gold:
Gold is already at all time highs , but Silver is not even half of it's previous highs (2011)
Silver, the 'Cinderella Gold' is a semiconductor - thus rises with technology
Silver rises and drops togethjer with Gold, thus allowing us to have a beautiful hedging opportunity for the next few months

SILVER Will Go Lower From Resistance! Sell!
Please, check our technical outlook for SILVER.
Time Frame: 1D
Current Trend: Bearish
Sentiment: Overbought (based on 7-period RSI)
Forecast: Bearish
The market is approaching a significant resistance area 5,316.9.
Due to the fact that we see a positive bearish reaction from the underlined area, I strongly believe that sellers will manage to push the price all the way down to 4,596.2 level.
P.S
We determine oversold/overbought condition with RSI indicator.
When it drops below 30 - the market is considered to be oversold.
When it bounces above 70 - the market is considered to be overbought.
Like and subscribe and comment my ideas if you enjoy them!

Silver (XAGUSD) – Bearish Momentum Building#Silver (#XAGUSD H4) – Bearish Momentum Building
Current price: $52.46
Silver is showing early signs of a downside continuation after a completed corrective rebound. The structure suggests a potential shift toward a new impulsive leg lower.
🧩 Technical Overview
• Price reversed from the $53.00 resistance zone after completing a local correction.
• The rising channel was broken, confirming weakness and early downside momentum.
• Market structure now favors a decline, with the trend shifting toward lower highs and lower lows.
📉 Scenario
If price confirms a downward continuation:
• Stop-loss: above the recent high near $53.00.
• Once a clear H4 fractal forms, the stop should trail above the most recent fractal high.
• The main downside targets are aligned with Fibonacci levels from the previous swing:
– First zone: $50.50 (initial reaction area)
– Next support: $47.20–$47.40
– Extended target: $44.10–$44.30
– Major accumulation zone: $41.20
⚙️ Market Context
• The overall bullish impulse from mid-September appears exhausted.
• Lower timeframe momentum confirms growing pressure from sellers.
• A clean break below $50.50 would confirm continuation of the downward leg.
🧭 Summary
Silver remains in a corrective decline phase, showing potential for deeper retracement if sellers maintain control.
As long as price stays below $53.00, the bias remains bearish, with focus on $47.20–$44.00 as the key reaction zones.
