SILVER SELLERS WILL DOMINATE THE MARKET|SHORT
SILVER SIGNAL
Trade Direction: short
Entry Level: 4,409.7
Target Level: 4,246.7
Stop Loss: 4,517.2
RISK PROFILE
Risk level: medium
Suggested risk: 1%
Timeframe: 9h
Disclosure: I am part of Trade Nation's Influencer program and receive a monthly fee for using their TradingView charts in my analysis.
✅LIKE AND COMMENT MY IDEAS✅
Silver

$dylTwo Trigger plans marked out on chart,
1. A push down take liquitity marked in orange and a reclaim of the mide range = trigger 1
2.A fast push into range low and hold the "Big quartely level" = trigger 2
#uranium
#dyl

SILVER (XAGUSD): Strong For Weeks! Continue To Buy! It!In this Weekly Market Forecast, we will analyze the XAGUSD (SILVER) for the week of Sept. 22 - 26th.
Silver has been strong for weeks. The industries continue strong demand from solar, electric vehicles and electronics. That, combined with supply constraints, continues to lend support to silver.
Bullish FVGs, bullish BOSs, and OLHC candles point to higher prices.
No reason to short this market.
Enjoy!
May profits be upon you.
Leave any questions or comments in the comment section.
I appreciate any feedback from my viewers!
Like and/or subscribe if you want more accurate analysis.
Thank you so much!
Disclaimer:
I do not provide personal investment advice and I am not a qualified licensed investment advisor.
All information found here, including any ideas, opinions, views, predictions, forecasts, commentaries, suggestions, expressed or implied herein, are for informational, entertainment or educational purposes only and should not be construed as personal investment advice. While the information provided is believed to be accurate, it may include errors or inaccuracies.
I will not and cannot be held liable for any actions you take as a result of anything you read here.
Conduct your own due diligence, or consult a licensed financial advisor or broker before making any and all investment decisions. Any investments, trades, speculations, or decisions made on the basis of any information found on this channel, expressed or implied herein, are committed at your own risk, financial or otherwise.

SILVER Is Bearish! Short!
Take a look at our analysis for SILVER.
Time Frame: 1D
Current Trend: Bearish
Sentiment: Overbought (based on 7-period RSI)
Forecast: Bearish
The market is approaching a key horizontal level 4,427.7.
Considering the today's price action, probabilities will be high to see a movement to 4,214.0.
P.S
The term oversold refers to a condition where an asset has traded lower in price and has the potential for a price bounce.
Overbought refers to market scenarios where the instrument is traded considerably higher than its fair value. Overvaluation is caused by market sentiments when there is positive news.
Like and subscribe and comment my ideas if you enjoy them!

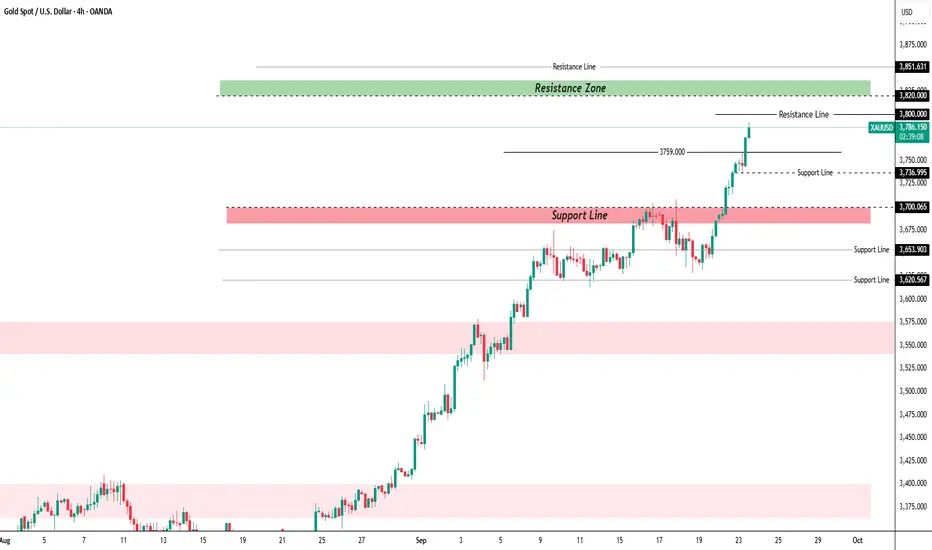
Gold (XAUUSD) – Technical Outlook
🟢 Bullish Scenario:
* Pivot Level: 3759
* If price holds above 3759
🎯 First target: 3800 (resistance)
🎯 If 3800 breaks strongly → continuation towards: 3820
---
🔴 Bearish Scenario:
* If price sustains below 3759
🎯 First target: 3736 (support)
🎯 If 3736 breaks → continuation lower towards: 3700
---
👉 Summary:
* Above 3759 → bullish continuation.
* Below 3759 → bearish continuation.
Gold | 30min Double Top | GTradingMethodHello Traders,
I’ve entered a short position on gold based on a potential double top formation on the 30-minute chart.
🔎 Market Overview:
This pattern often signals weakening bullish momentum and potential reversal pressure. While gold has been strong recently, the short-term setup suggests an opportunity for a tactical short if the pattern confirms.
📊 Trade Plan:
Risk/Reward: 3.6
Entry: 3,757.0
Stop Loss: 3,766.6
Take Profit 1 (50%): 3,729
Take Profit 2 (50%): 3,713
🙏 Thanks for checking out my post!
Make sure to follow me to catch the next idea and please share your thoughts — I’d love to hear them.
📌 Please note:
This is not financial advice. This content is to track my trading journey and for educational purposes only.

Silver Daily TF AnalysisSilver Daily Analysis
Bulls Eye
- In previous analysis of XAGUSD, it was specified that a breakout above Fib Extension 1.272 level will likely fuel further upside momentum.
- On the upside, the next milestone sits near $44.0
Current Situation
- Silver has breached the ascending channel, and testing the record highs made during Aug 2011 - 44.20
- A confluence of resistance becoming hurdle for further bull side rally - including
1) the record high mark itself
2) the upper trendline of the channel
3)the fib extension level 1.414
4) The upper Bollinger band
Projections
- Prices are likely to correct, to retest the Fib Extension 1.272 (41.32), confluence with middle Bollinger band.
- However, if prices breaches the immediate, but crucial resistance at 44.20, then it might rise high towards 46.00

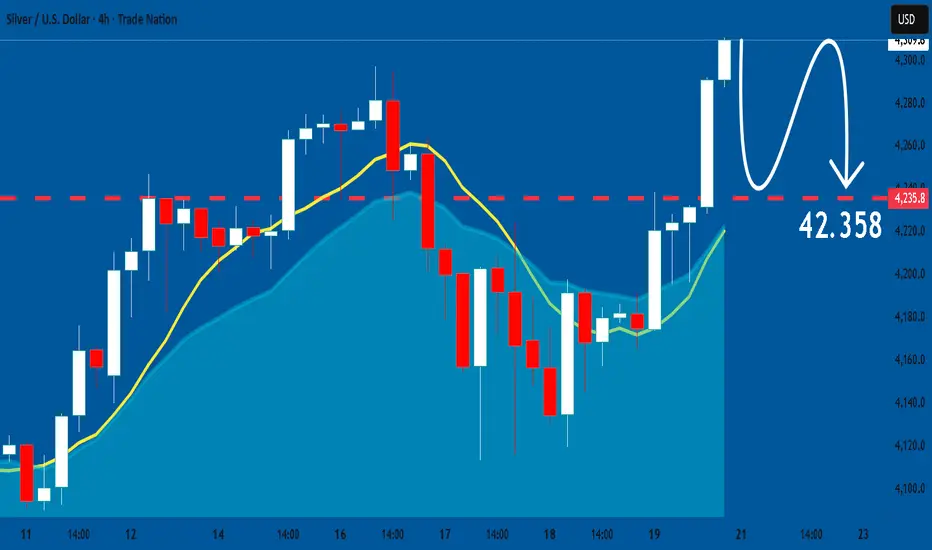
Silver Price Outlook: H4 Technical Charts Point to Bearish MomenSilver prices are flashing early warning signs of weakness as the 4-hour (H4) technical charts reveal a shift in momentum. After weeks of choppy price action, the metal appears to be setting up for a potential downside move in the coming days. Here’s a detailed look at the key drivers and levels to watch.
Technical Picture: H4 Chart Breakdown
Trend Structure
Silver has slipped below its short-term ascending trendline, signaling a possible break in bullish momentum.
Recent candles show lower highs and lower lows, a classic indication of bearish pressure building.
Key Moving Averages
The 50-period EMA has crossed below the 100-period EMA, reinforcing a near-term bearish bias.
Price is also trading under the 21-period EMA, suggesting that sellers are in control.
Momentum Indicators
The Relative Strength Index (RSI) is trending downward, currently hovering near the 40–45 zone—still above oversold territory, leaving room for further declines.
MACD histogram is widening on the negative side, with a fresh bearish crossover confirming selling momentum.

Gold | H8 Double Top | GTradingMethodHello Traders, good morning!
Gold has been pushing into new highs, but I’ve taken a small short position this morning. The reason? A potential double top is forming on the 8-hour timeframe.
Negative RSI divergence is present — price is making higher highs, while RSI is printing lower highs. This signals weakening buying momentum.
Volume on the second top is lower than the first, which adds further confluence for a possible reversal.
I am aware that this is most likely a controversial position as most people will be long gold.
However, the risk reward favors shorts at these levels and I willing to take a small position against the trend. Only time will tell.
📊 Trade Plan:
Risk/Reward: 3.6
Entry: 3,698.5
Stop Loss: 3,732.5
Take Profit 1 (50%): 3,597
Take Profit 2 (50%): 3,549.8
GTradingMethod Tip:
When trading reversal patterns, I always look for multiple layers of confluence — structure (like a double top), momentum (RSI divergence), and volume. This helps filter out weak setups.
🙏 Thanks for checking out my post!
Where do you think gold is headed today?
Please note:
This is not financial advice. This content is to track my trading journey and for educational purposes only.

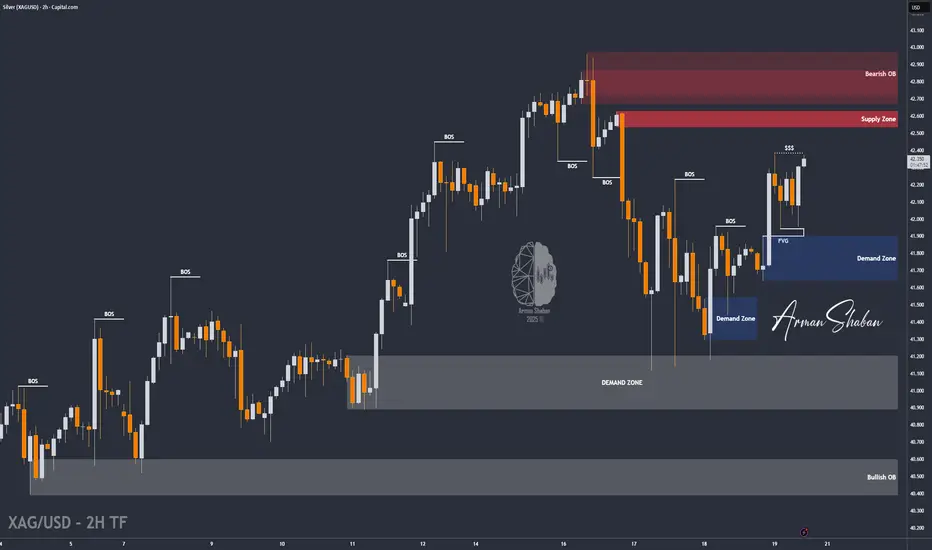
XAG/USD | Bull or Bear ? (READ THE CAPTION)By analyzing the Silver chart on the 2-hour timeframe, we can see that the price is currently trading around $42. The resistance at $42.4 is just ahead, and I expect it to be broken soon, which could push silver to higher levels.
The next target and supply zone is between $42.5–$42.65. All supply and demand zones are marked on the chart — make sure to watch them closely and follow the price reaction. This analysis will be updated again!
Please support me with your likes and comments to motivate me to share more analysis with you and share your opinion about the possible trend of this chart with me !
Best Regards , Arman Shaban
Silver Bullish breakout support at 4300The Silver remains in a bullish trend, with recent price action showing signs of a continuation breakout within the broader uptrend.
Support Zone: 4300 – a key level from previous consolidation. Price is currently testing or approaching this level.
A bullish rebound from 4300 would confirm ongoing upside momentum, with potential targets at:
4440 – initial resistance
4507 – psychological and structural level
4575 – extended resistance on the longer-term chart
Bearish Scenario:
A confirmed break and daily close below 4300 would weaken the bullish outlook and suggest deeper downside risk toward:
4246 – minor support
4180 – stronger support and potential demand zone
Outlook:
Bullish bias remains intact while the silver holds above 4300. A sustained break below this level could shift momentum to the downside in the short term.
This communication is for informational purposes only and should not be viewed as any form of recommendation as to a particular course of action or as investment advice. It is not intended as an offer or solicitation for the purchase or sale of any financial instrument or as an official confirmation of any transaction. Opinions, estimates and assumptions expressed herein are made as of the date of this communication and are subject to change without notice. This communication has been prepared based upon information, including market prices, data and other information, believed to be reliable; however, Trade Nation does not warrant its completeness or accuracy. All market prices and market data contained in or attached to this communication are indicative and subject to change without notice.

XAUUSD H2 XABCD SHORT/LONG sequence with price targets🔸Hello traders, let’s review the 2-hour chart for GOLD (XAUUSD). Price action has been volatile, but the market continues to respect harmonic levels. We are tracking a clean XABCD harmonic structure, offering both higher-risk and lower-risk opportunities depending on your trading style.
🔸Speculative XABCD structure defined by the following pivots:
X = 3625 A = 3689 B = 3639 C = 3709 D/PRZ = 3603
This setup still pending PRZ/D point, giving us potential reversal scenarios.
Advanced short entry is from C at 3709 with target exit at D/PRZ 3603 – higher-risk setup still pending
🔸Trade Analysis and overview:
Advanced short is still available from point C at 3709 with exit target at PRZ/D 3603. This is a higher-risk play, still pending
Now we shift focus to the lower-risk reversal setup: buying near the D/PRZ level at 3603. Harmonic patterns often suggest strong bounce potential from the PRZ, making this a solid buy/hold opportunity.
🔸Strategy & Targets:
BUY/HOLD from PRZ/D = 3603
TP1 = 3700 (first profit zone / re-test of structure)
TP2 = 3750 (extended target into higher resistance)
Manage risk with proper SL placement beneath PRZ.
🔸Key Notes:
Pattern suggests a bullish reversal from current zone.
Traders should remain patient as volatility around PRZ is common.
This is a swing trade setup, so allow time for structure to develop toward TP levels.
🎁If you find this analysis useful:
Hit the like button to show support 🙌
Drop a comment and let us know your view on GOLD!

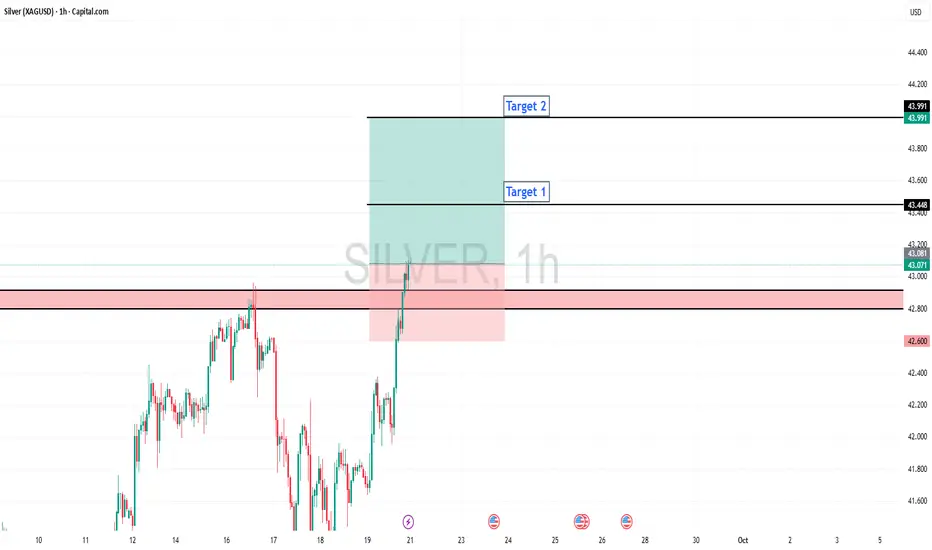
Silver Long Trade ideaSilver has broken out of consolidation and closed above the recent high.
This is a bullish signal we can consider to buy/long silver, near term we should see $44 price point.
Good luck !

BRIEFING Week #38 : Waiting for Something to Happen !Here's your weekly update ! Brought to you each weekend with years of track-record history..
Don't forget to hit the like/follow button if you feel like this post deserves it ;)
That's the best way to support me and help pushing this content to other users.
Kindly,
Phil

Silver is in the Bullish trend after testing ResistanceHello Traders
In This Chart XAGUSD HOURLY Forex Forecast By FOREX PLANET
today XAGUSD analysis 👆
🟢This Chart includes_ (XAGUSD market update)
🟢What is The Next Opportunity on XAGUSD Market
🟢how to Enter to the Valid Entry With Assurance Profit
This CHART is For Trader's that Want to Improve Their Technical Analysis Skills and Their Trading By Understanding How To Analyze The Market Using Multiple Timeframes and Understanding The Bigger Picture on the Charts
Weekly Analysis Index and Stocks. Found Unique stocks for InvestFound Few Unique stocks and Bees that will generate good momentum (rocket):
🔹#Hi-Tech Pipes
🔹#Astramicrowave
🔹#AsterDM
🔹#Monte Carlo Fashions
🔹#EicherMotor
🔹#Paragmilk
🔹#PSUBankbees
🔹#Silverbees
🔹#MahaBank
Sole purpose of doing it was to instill a belief that money can be made with patience to wait for the right setups and the discipline of executing them without fear

SILVER The Target Is DOWN! SELL!
My dear friends,
Please, find my technical outlook for SILVER below:
The instrument tests an important psychological level 43.096
Bias - Bearish
Technical Indicators: Supper Trend gives a precise Bearish signal, while Pivot Point HL predicts price changes and potential reversals in the market.
Target - 42.342
About Used Indicators:
Super-trend indicator is more useful in trending markets where there are clear uptrends and downtrends in price.
Disclosure: I am part of Trade Nation's Influencer program and receive a monthly fee for using their TradingView charts in my analysis.
———————————
WISH YOU ALL LUCK

SILVER: Market Sentiment & Price Action
Remember that we can not, and should not impose our will on the market but rather listen to its whims and make profit by following it. And thus shall be done today on the SILVER pair which is likely to be pushed down by the bears so we will sell!
Disclosure: I am part of Trade Nation's Influencer program and receive a monthly fee for using their TradingView charts in my analysis.
❤️ Please, support our work with like & comment! ❤️
SILVER Is Going Down! Sell!
Please, check our technical outlook for SILVER.
Time Frame: 1h
Current Trend: Bearish
Sentiment: Overbought (based on 7-period RSI)
Forecast: Bearish
The market is trading around a solid horizontal structure 4,309.9.
The above observations make me that the market will inevitably achieve 4,247.3 level.
P.S
Overbought describes a period of time where there has been a significant and consistent upward move in price over a period of time without much pullback.
Like and subscribe and comment my ideas if you enjoy them!

XAGUSD Holds 41.40 Strong – Bulls Ready for 43 AgainAs I’ve often highlighted in my previous Silver outlooks, OANDA:XAGUSD usually offers cleaner technical setups than Gold, with less “noise” and fewer manipulation spikes. This time is no exception.
After touching the 43.00 zone, Silver entered a corrective phase, sliding down to 41.40 – a key confluence support. Price tested this level no less than four times, and each time buyers stepped in, eventually pushing the market higher.
Much like in Gold, this drop from the highs should not be mistaken for a trend reversal. Instead, it’s a healthy correction inside a strong uptrend. Based on the price action, we can now argue that the correction is likely complete.
📊 Trading plan:
• My strategy is to buy dips, ideally around the 41.80 zone.
• First target remains the 43.00 resistance area.
• Invalidation (negation) comes only with a daily close below 41.50.
In short, Silver has shown resilience at support, and unless 41.50 breaks, I stay with the bulls. 🚀

Noise or pattern?Since february 2024 silver shows like gold a four phase pattern but with a higher frequency leading to a phase shift. What do you think. What are the causes for this cycles? Why is there a difference in the frequency and what will happen when both phases are congruent again?
Disclaimer
This content is for informational and educational purposes only and should not be construed as financial or investment advice. The author is not a registered financial advisor. Trading and investing in financial markets involve substantial risk of loss and is not suitable for every investor. Past performance is not indicative of future results. Always conduct your own research and consult with a qualified professional before making any investment decisions.


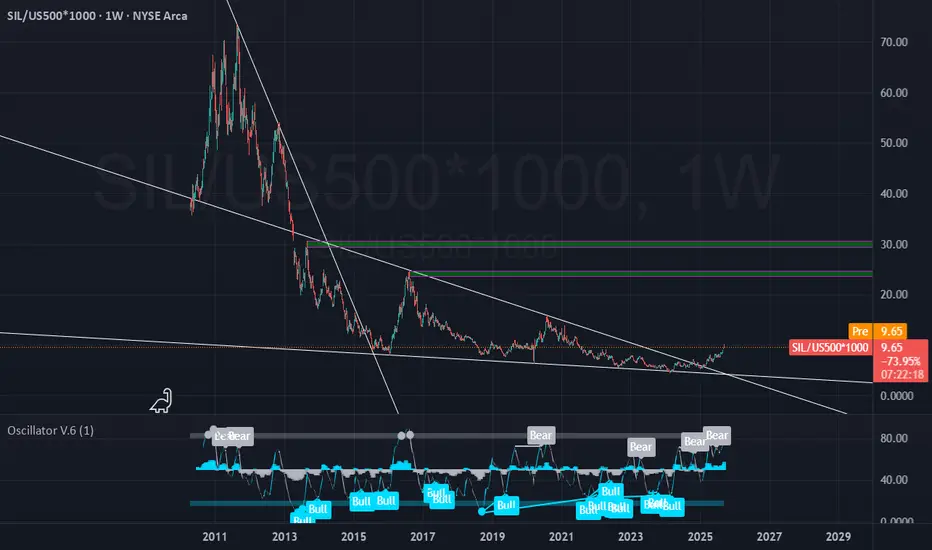
Silver: From Underperforming to OutperformingThe Silver miner ETF has been underperforming the US Stock market for quiet some time.
The times are shifting, seeing the breakout off the Falling Wedge.
Targets from this moment: 100% Minimum
Potentially: 200%+
TLDR: for maximazing performance, you are better off owning SIL ETF (or silver stocks) then the S&P500.