Silver’s 220% Rally: Still Worth Buying Now?Many have recommended investing in silver in recent years. I wasn’t a strong believer, but seeing its 220% growth — even outperforming gold — is impressive. For new investors, silver carries high risk at current levels. In my view, $50 would be a much more attractive entry price
Silveranalysis

XAGUSD it's further bulishh scnerios? #SILVER.. market stagnent even gold drop but silver constant hold his bulish pattern ..
So if market holds further then upside 60 plus can be a possible next stop ..
Good luck
Trade wisely

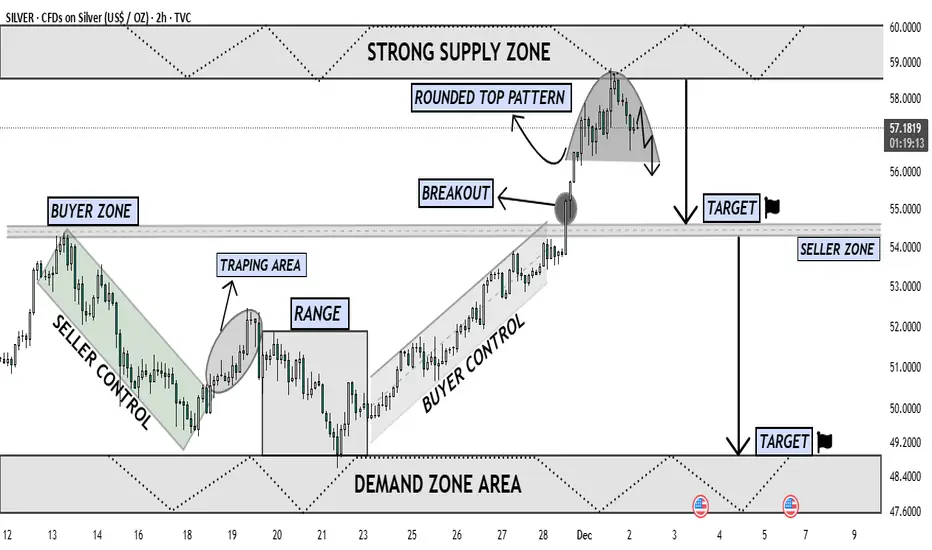
Silver Forming Major Top Near Supply Downside Retracement LikelyThe chart shows Silver reaching a major Strong Supply Zone near the 58–60 level, where price has reacted multiple times in the past. After a strong impulsive rally driven by Buyer Control, the market broke above the previous Buyer Zone, confirming bullish strength. However, once price entered the upper supply region, momentum started to fade, forming a clear Rounded Top Pattern — a classic distribution structure indicating exhaustion of buyers.
Following the breakout retest, buyers failed to continue upward, and sellers stepped in aggressively from the supply zone. The chart now shows a shift from buyer dominance to seller pressure, with price beginning to curve downward inside the rounded top. This shape reflects decreasing highs, weakening demand, and early reversal signals.
The projected move suggests that once the neckline of the rounded top breaks with strong bearish candle confirmation, price is likely to fall toward the first Target Zone around 54, which aligns with the Seller Zone and previous breakout structure. If bearish continuation remains strong, the next logical target lies in the Demand Zone Area between 48–49, where liquidity is expected to support a potential reversal or consolidation.
Overall, this chart indicates a high-probability corrective phase, with sellers preparing to reclaim control as the market rejects the supply zone and transitions into a deeper pullback phase. Buyers must show strong defense at the mid-support; otherwise, Silver could decline further toward the lower demand region.
SILVER: The Mother of All Cup and Handles? 45-Year BreakoutThis analysis highlights what could be the most significant long-term technical pattern currently forming in the financial markets: a massive, multi-decade Cup and Handle formation on the silver/USD monthly chart.
The Cup (1980 – 2011)
The Cup began with the historic spike in 1980 and was completed with the rally to the same resistance level around $50 per ounce in 2011. This vast, 31-year, rounded consolidation zone represents a massive accumulation and basing phase.
The Handle (2011 – Present)
Following the 2011 peak, silver entered the "Handle" phase. This is the final consolidation period, characterized by price compression and sideways action below the key $50 resistance zone. This phase serves to shake out weak hands and build the energy required for a major long-term structural breakout.

Strong Bullish Structure Developing in Silver🚀 XAG/USD (SILVER) Swing Blueprint | Bullish Structure Intact | Key Levels Mapped! ⚔️
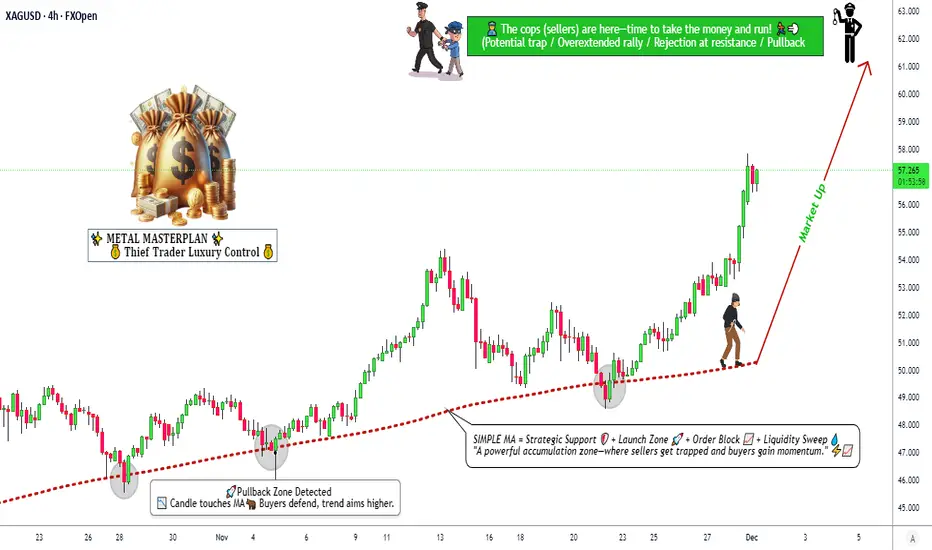
🎯 Metals Market Opportunity: Silver (XAG/USD) Swing Trade Setup
📈 Direction: Bullish | Swing Trade
🏷 Asset: XAG/USD - Silver vs. U.S. Dollar
⚖️ Core Thesis: Silver is building a potential swing bullish structure, aiming for a significant resistance zone. This plan outlines the key framework.
📊 Trade Plan (Blueprint)
✅ Entry Zone: Consider entries on pullbacks or strength confirmation. (Any price level entry - discipline is key).
🛑 Stop Loss (Risk Management):
"This is thief SL @ 54" 💎
Dear Traders (The OG Crew), 👊
This is my protective level. YOU MUST adjust your SL based on YOUR OWN risk tolerance & strategy. I do not recommend using only my level. Manage your capital wisely.
🎯 Target Zone: @ 62 Area.
This aligns with a strong historical resistance + potential overbought/trap zone. 🪤 The strategy is to "escape with profits" as price approaches.
Note: This is my target. Take profits based on your own analysis and risk-reward goals.
🔍 Related Pairs & Market Correlations (Must-Watch) 🔗
Monitoring these pairs provides context for Silver's move:
🦅 TVC:DXY (U.S. Dollar Index):
Key Point: INVERSE correlation. A weaker TVC:DXY typically boosts commodities priced in USD, like Silver. Watch for DXY breakdowns for added Silver bullish confirmation.
🟡 XAU/USD (Gold):
Key Point: STRONG positive correlation. Gold is the leader. A strong, bullish Gold market often drags Silver higher (and vice-versa). Silver's moves can be more volatile ("Gold on steroids").
📈 US 10-Year Treasury Yields / TVC:TNX :
Key Point: General inverse relationship. Rising real yields can pressure non-yielding metals. Watch for yield pullbacks that may relieve pressure on Silver.
⛽️ Crude Oil ( BLACKBULL:WTI / ICMARKETS:XBRUSD ):
Key Point: Inflation/Commodity Sentiment Gauge. Rising oil can signal broader commodity strength and inflation fears, which can benefit Silver as a real asset.
📊 Copper ( CAPITALCOM:COPPER ) & AMEX:GDX (Gold Miners ETF):
Key Point: Industrial / Risk Sentiment. Copper confirms industrial demand outlook. AMEX:GDX strength confirms bullish precious metals sector momentum.
💎 Final Notes
This is a blueprint, not financial advice.
You are the captain of your own capital. 🧭
Always use proper position sizing.
Markets are dynamic—always monitor for structure breaks.
Let's get this bread... responsibly! 🥖
✅ Like & Follow if you find this detailed blueprint valuable! It helps the idea reach more traders. 💡
#SILVER #XAGUSD #TradingSetup #SwingTrading #Commodities #PreciousMetals #Forex #TradingView #DXY #GOLD #XAUUSD #Analysis
Gold & Silver Are On Fire Right Now!🌕 Gold is up — heading towards its fourth straight monthly gain, hitting a fresh two-week high on expectations of an upcoming rate cut by the Federal Reserve.
💎 Silver just smashed a new all-time high — zooming to $56.78/oz, rallying ~16.6% this month alone!
📈📉 With global rate-cut hopes rising, safe-haven metals are drawing fresh investor love. Whether you call it “hedge”, “insurance”, or “bullish vibe” — the trend is clear: metals are in demand.
👉 Bottom line: If you’ve been waiting for a strong entry into commodities — now might be the moment. Gold and silver are ringing the bell loud and clear! 🔔

NOV.30,2025 GOLD & SILVER ANALYSISGold and Silver are both looking bullish on the weekly and monthly charts suggesting further upside is still intact. Although on these same timeframes, the price action is very extended outside their standard Bollinger bands and KC bands. Hence this level is not great for long entries as the risk to reward is not attractive to me.
There are some divergences on the daily charts too but these are still active and not confirmed. So as cautioned in the video, in both scenarios it is best to wait for confirmation for Bullish continuation or Bearish correction from these levels.
This is my perception on the commodities of Gold and Silver.
Thank you for supporting my publications and I wish you the best of trades as we begin the month of December.

Silver is in the Bullish directionHello Traders
In This Chart XAGUSD HOURLY Forex Forecast By FOREX PLANET
today XAGUSD analysis 👆
🟢This Chart includes_ (XAGUSD market update)
🟢What is The Next Opportunity on XAGUSD Market
🟢how to Enter to the Valid Entry With Assurance Profit
This CHART is For Trader's that Want to Improve Their Technical Analysis Skills and Their Trading By Understanding How To Analyze The Market Using Multiple Timeframes and Understanding The Bigger Picture on the Charts

XAGUSD: Bullish Wave 5 Setting a Path Toward 56.000?Hey Realistic Traders!
"Silver Riding Gold’s Momentum, New ATH in the horizon?"
Let’s dive into the technical analysis to answer the question and see what the chart is really telling us.
Technical Analysis
On the daily chart, OANDA:XAGUSD has once again rebounded around the EMA200, with repeated bounces reinforcing the strength of its broader bullish trend. During Wave 4, Silver consolidated within a falling wedge pattern, a corrective formation that typically appears as downside momentum weakens within a larger uptrend. A breakout from this pattern signals renewed bullish pressure and often marks the beginning of Wave 5 in Elliott Wave theory.
Following the breakout, price action supports the case for a developing impulsive Wave 5. The bullish Marubozu candlestick indicates stronger buying interest, while the MACD golden cross adds confirmation to the bullish bias. Together, these signals strengthen the view that momentum is shifting back in favor of the bulls.
Based on Fibonacci projections, Wave 5 may extend toward the 1.0 Fibonacci ratio, aligning with the second upside target near 56.000. Before reaching that level, price may encounter the historical resistance zone around the first target at 54.082, where a temporary pullback could occur.
This bullish wave count remains valid as long as price stays above 49.216. A move below this level would invalidate the potential formation of Wave 5 and shift the outlook back to neutral.
Support the channel by engaging with the content, using the rocket button, and sharing your opinions in the comments below.
Disclaimer: "Please note that this analysis is solely for educational purposes and should not be considered a recommendation to take a long or short position on Silver

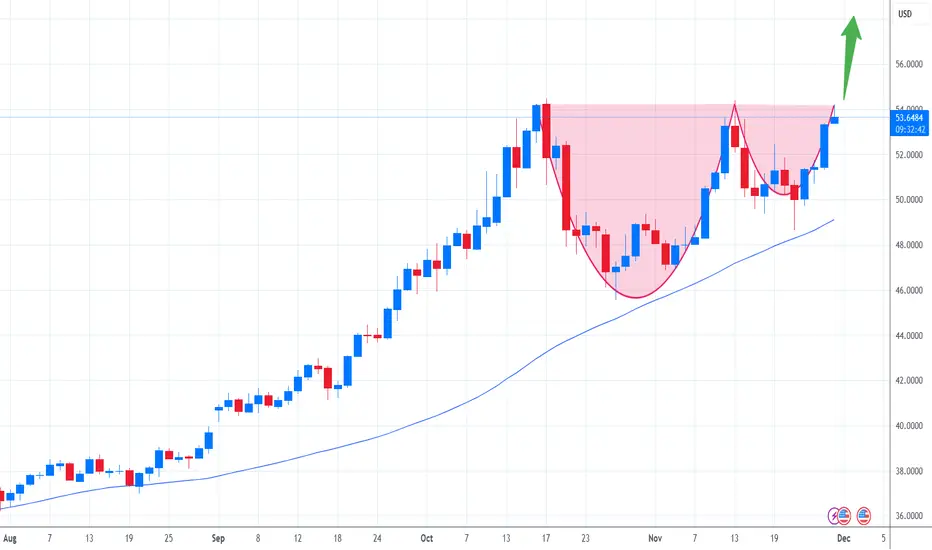
Perfect Cup and handle Pretty self explanatory here perfect cup and handle on Silver. Very Bullish
Happy Hunting - ND

Silver Turning Positive – Breakout Ahead?Silver is gaining traction again as dollar weakness offers fresh support and buyers step back into the market. On the daily chart, the cup-and-handle formation is becoming more pronounced, and the current upward push raises the question of whether a clean breakout is finally underway. The key level to watch remains the USD 54.50 zone, as a decisive close above it could clear the path for a stronger bullish move.
A softer dollar environment continues to help, as it improves global purchasing power and often attracts fresh flows into precious metals. At the same time, improving inflation expectations keep silver relevant as a hedge, especially with investors preparing for potential policy shifts later in the year. The industrial side of the story also matters: demand from solar, electronics, and EV-related sectors remains strong, and any upbeat economic indicators could reinforce the case for higher prices. When equities trade in a risk-on mood, silver tends to benefit as part of the broader commodities cycle, and that dynamic is currently in play as well.
If the breakout fails, the tone could shift quickly. Weak economic data would raise concerns about industrial demand, while a rebound in the dollar or rising bond yields could cap momentum. These factors, combined with the possibility of profit taking after a solid run, might pull silver lower again. Still, as long as major support levels hold, the market keeps a constructive bias, and a confirmed breakout above 54.50 would likely be the trigger for the next strong leg higher.
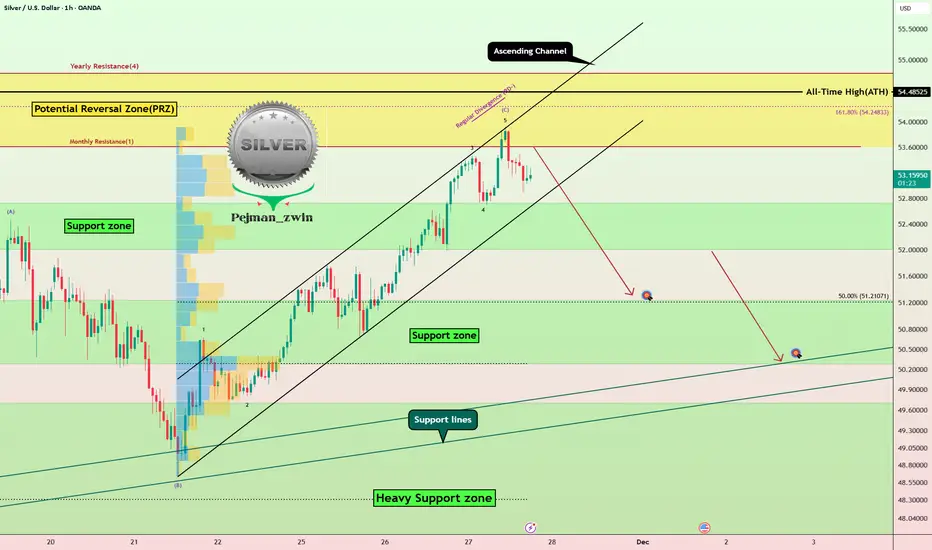
Silver Warning: RD- + PRZ = Short Opportunity?Today, we're diving into Silver ( OANDA:XAGUSD ), and it seems that there’s a potential short opportunity on the horizon.
Currently, silver is approaching a Potential Reversal Zone(PRZ) and an ascending channel.
From an Elliott Wave perspective, it appears that silver has completed wave C of an Expanding Flat Pattern(3-3-5/ABC).
Additionally, we’re noticing a Regular bearish Divergence (RD-) between the price peaks, which adds to the bearish sentiment.
I expect that, following a break below the lower line of the ascending channel, silver could also break through its Support zone($52.73-$52.00) and potentially decline to around the $51.33 level.
First Target: $51.33
Second Target: Support lines
Stop Loss(SL): $54.63
💡 Please respect each other's opinions and express agreement or disagreement politely.
📌 Silver/ U.S. Dollar Analyze (XAGUSD), 1-hour time frame.
🛑 Always set a Stop Loss(SL) for every position you open.
✅ This is just my idea; I’d love to see your thoughts too!
🔥 If you find it helpful, please BOOST this post and share it with your friends.
NOV.23,2025 ANALYSIS- DXY, BTC, NAS100, SPX500, XAUUSD & XAGUSDDXY CAUTION: at weekly resistance but Uptrend with a huge bullish candle suggests continuation to the upside. I expect some sideway price action potential pullback to 99.365 level and then continuation to the upside target of 100.608. A break below 99.365 will invalidate upside targets.
BITCOIN: STILL BEARISH, All my initial bearish targets from previous analysis got smashed. BTC is now in a new bearish territory only finding support at the fib extension 1.618 from the $126,296 high. RSI is very oversold and potentially there could be a sideways price action around this level re-testing $80,524 this week. Ultimately the next bearish target is between $70k and $78k.
NAS100 & SPX500 BEARISH: Both indices closed with a strong bearish candle but found support around their 21EMA on the weekly chart. I observed some unconfirmed hidden divergence plus daily stochastics cycle lows so I expect some sideways consolidation and next leg down to targets of about $23,169 for Nas100 and $6,418 for SPX500.
GOLD & SILVER SIDEWAYS: Gold on the weekly chart showed only a doji candle consolidating price action but lower high of($4,194) confirmed on the chart. I envisage that this consolidation will continue into next week and finally breakdown to the $3,826 target. Silver has maintained the double tops on the weekly and daily charts. The lower high of $52.98 also suggest more downside price action with the initial target of $45 - $47 zone.
I hope my publications are helpful to your own analysis and perspective. Thank you and please show your support for these analysis with a boost or comment so it's shown to other traders. Have a great and profitable trading week and remember risk management is your first job as a trader. Cheers!!

Silver - Parking capital somewhere 'safe'One of the cleaner chart patterns that I can see, which has been playing out for the last 5 years. Over several years the target zone sits at twice the current value.
ETF's like SLV look appealing with general exposure through miners.
Follow the lines.

Is the Silver Price Preparing to Challenge Its Record High?Is the Silver Price Preparing to Challenge Its Record High?
The United States is celebrating Thanksgiving, meaning trading activity across financial markets will be lower than usual today (and to some extent tomorrow). Yesterday, we noted a decline in volatility in the gold market.
Against this backdrop, the silver market is drawing attention – and may not allow traders to relax. As the XAG/USD chart shows, silver has risen by more than 7% since the start of the week.
It is reasonable to assume that the holiday-induced drop in liquidity has opened the door to broader price movements. It is not impossible that we may soon see an attempt to break the all-time high (around $54.45 per ounce), which as of this morning lies roughly 1% away.
Technical Analysis of XAG/USD
Examining the XAG/USD chart, we can identify key swing points that allow us to outline an ascending channel. This week’s strong advance has pushed silver into the upper half of that channel.
The bulls’ strength is reflected in:
→ the steep slope of the orange channel, within which we see impulsive bullish candles followed by brief corrections – a classic pattern of a strong market;
→ a higher peak on the Awesome Oscillator.
Given this context, it is plausible that the median line could switch from resistance to support (as it has previously – shown by arrows), potentially helping the bulls gather the confidence needed to challenge the record high.
This article represents the opinion of the Companies operating under the FXOpen brand only. It is not to be construed as an offer, solicitation, or recommendation with respect to products and services provided by the Companies operating under the FXOpen brand, nor is it to be considered financial advice.

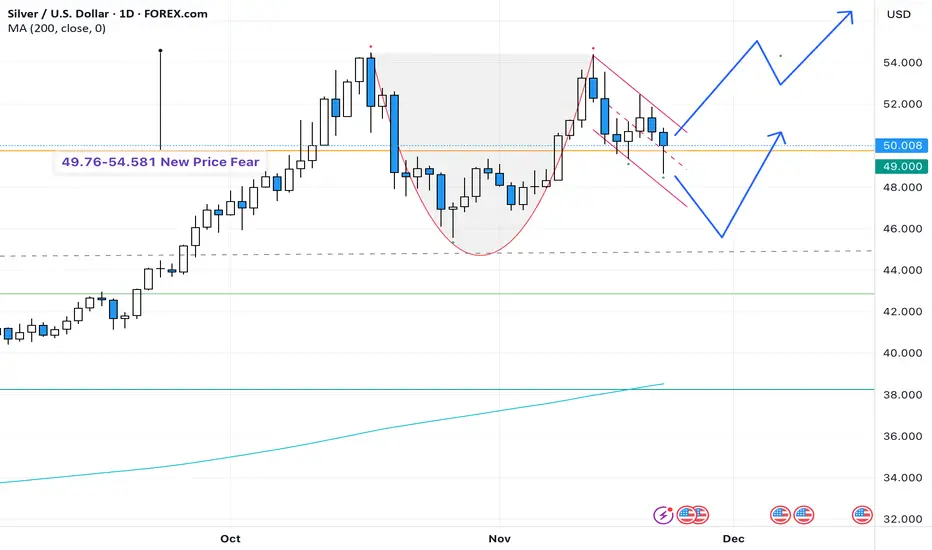
Is Silver Setting Up for a Massive Bull Run? Cup & Handle SignalWith gold leading the rally by printing new all-time highs. Meanwhile, silver — often ignored — has also broken its historical level at 49.76 USD and pushed into a new high.
Last week, global liquidity weakened and silver retraced to 48.644, but buyers quickly stepped in and pushed the daily close back above 49.76, showing strong bullish demand at higher prices.
On the daily chart, silver is forming a clean Cup & Handle pattern. The price is currently consolidating within the handle, and a breakout above the key resistance at 54 USD could trigger a powerful continuation move.
Key points to watch:
✔ Precious metals remain in a strong macro bull cycle
✔ Silver successfully retested its previous high zone
✔ Cup & Handle formation is nearly complete
✔ A breakout above 54 could accelerate the next major rally
Silver is known for its volatility and explosive trends once momentum builds. Do you think a breakout above 54 could mark the beginning of silver’s next big run?
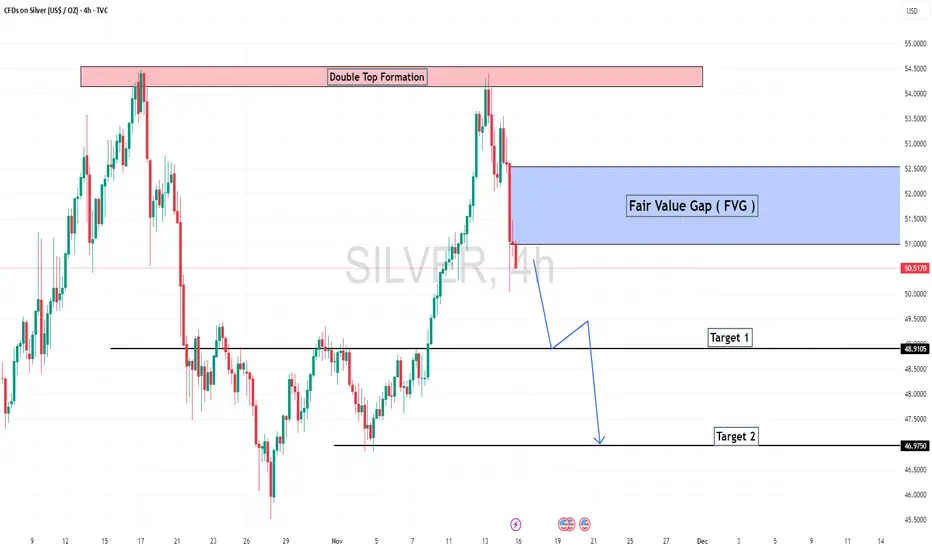
Silver (XAGUSD) — Breakdown Setup After Double TopSilver has printed a clear Double Top at a major resistance zone, showing signs of trend exhaustion after a strong bullish rally. Recent structure and momentum signals now point toward a potential deeper correction.
🔹 Key Bearish Signals
Double Top at major resistance
Shift from Higher High (HH) to Lower High (LH)
Bearish RSI divergence on 1D and 4H
Multiple rejections at the same resistance level
Support zone has been tested several times → increasing breakdown probability
🔻 Trade Plan
Sell Stop below the support zone
SL: Above recent LH
TP: Next major demand area (clean downside structure)
🎯 Why This Setup Matters
Double Top + LH confirms early trend reversal
RSI divergence reinforces weakening momentum
1D and 4H confluence adds confidence
A support break could trigger a sharp move down with strong R:R potential

SILVER (XAG/USD): More Growth is Coming📈SILVER is demonstrating a very bullish posture following a confirmed breakout above a minor intraday horizontal resistance.
We are observing a positive reaction after its retest.
I anticipate that the price may soon achieve the 52.35 level.

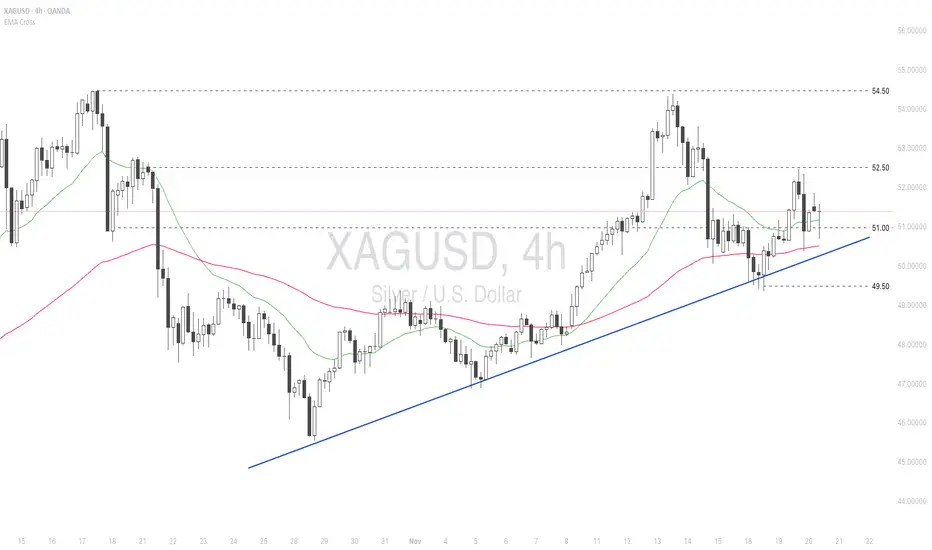
Silver holds steady amid soft labor data and a hawkish Fed
Silver prices are holding steady as markets weigh soft labor data against a hawkish Fed.
ADP reported that private-sector employment fell by an average of 2.5k jobs per week over the four weeks to Nov 1. Moreover, Cleveland Fed data also showed 39k workers received layoff notices in Oct, close to a 40k level that exceeded only during the global financial crisis and the pandemic.
Meanwhile, the Oct FOMC minutes were hawkish, with several participants indicating that an additional 0.25% cut would not be appropriate and stressing a risk-balanced approach to future policy decisions.
XAGUSD remains range-bound between 51.00-52.50, awaiting additional price triggers for a clear breakout.
If XAGUSD closes above 51.00, the price may retest the next resistance at 52.50.
Conversely, if XAGUSD breaks below EMA21 and 51.00, the price could retreat toward the subsequent support at 49.50.
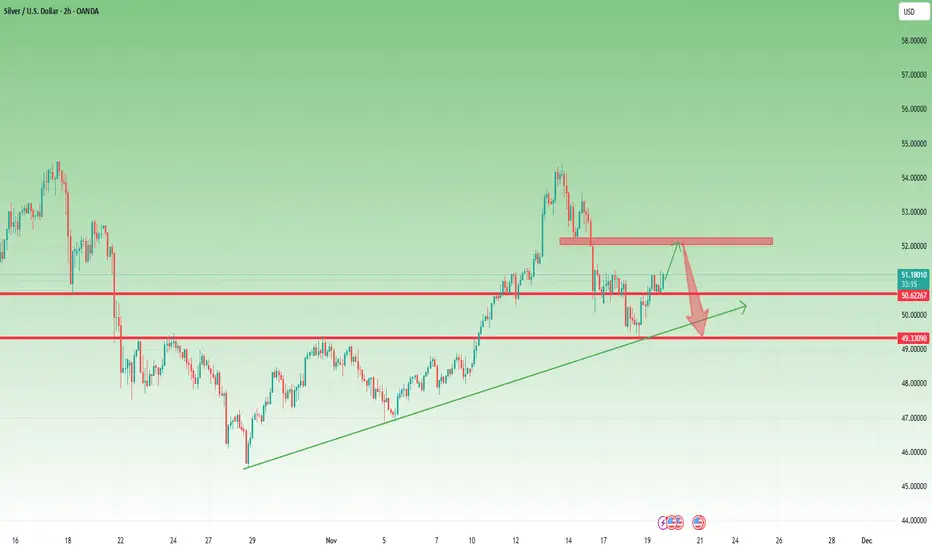
New Leg Up Possible, Yet I Expect Another Decline Toward 491. What Happened Since Yesterday
In yesterday’s analysis, I highlighted the possibility of a rebound from the confluence support and mentioned that Silver could rise toward the 50.50 resistance.
Not only did Silver reach that target — it broke above it, and the price is now trading above 51.00.
The bullish momentum was stronger than expected, confirming buyers stepped in aggressively from support.
2. Current Market Context
With price holding above 51, the short-term chart structure is slightly bullish, and a new leg up is possible in the immediate term.
However, despite this strength, I believe the overall correction is not yet complete. Silver has a habit of producing sharp counter-trend moves before continuing the broader direction.
3. Technical Outlook
Key levels to monitor:
Resistance:
- 52.00 – major short-term barrier; ideal area to search for shorts
- 50.50 – intraday resistance turned support
Support / Downside target:
- 49.00 – the next major support and my preferred downside target
Until Silver breaks and holds above 52, upside continuation remains limited in my view.
4. Trading Plan
My plan is straightforward:
If price reaches the 52 zone, I will look for short entries.
Downside target is 49.
I will reassess the bias only if Silver starts to stabilize well above 52, which would shift the structure back to bullish.
5. Conclusion
Silver exceeded expectations on the rebound, but the larger corrective structure appears intact.
Short-term upside is possible, yet I still expect another leg down, with 49 as the main target.
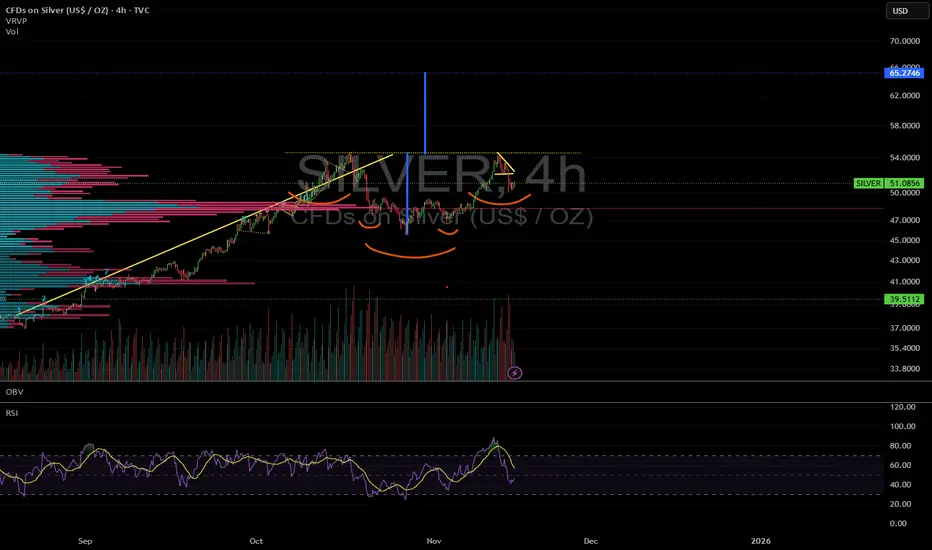
SILVER TO 65 $ ?Silver is undergoing a consolidation in the 47 to 54 $ range recently.
There is an inverse Head and Shoulders pattern forming right now.
The implied price objective of 65 $
At a time where many (even smart) invesors are waiting for a dip down to 40 (and even 30) $ could that be the surprise that hot assets offer in a raging bull market ?
The pattern is there ! Will it play out ?
I am positioned.
Silver is in the Bullish directionHello Traders
In This Chart XAGUSD HOURLY Forex Forecast By FOREX PLANET
today XAGUSD analysis 👆
🟢This Chart includes_ (XAGUSD market update)
🟢What is The Next Opportunity on XAGUSD Market
🟢how to Enter to the Valid Entry With Assurance Profit
This CHART is For Trader's that Want to Improve Their Technical Analysis Skills and Their Trading By Understanding How To Analyze The Market Using Multiple Timeframes and Understanding The Bigger Picture on the Charts
Silver Price Ready for Lift-Off: Bullish Channel Silver (XAG/USD) is consolidating within a rising channel, with strong Ichimoku cloud support hinting at a potential bullish breakout. After a brief pullback to the lower channel boundary, price action shows signs of rebound momentum targeting the $54 resistance zone. A confirmed break above $53 could trigger an upward move equal to the channel height, continuing the bullish trend. Traders are watching for a breakout confirmation above the midline for a potential long setup.
🧭 Chart Overview
Timeframe: 30-minute chart
Indicator: Ichimoku Cloud (9, 26, 52, 26)
Price: $52.67 (as of the chart time)
Trend Channel: Rising (ascending parallel channel)
---
📊 Price Action Analysis
1. Trend Structure:
The chart shows Silver trading inside a well-defined ascending channel, respecting both upper and lower boundaries.
Price recently bounced off the lower channel support, which often acts as a bullish signal within an ongoing trend.
2. Ichimoku Cloud (Kumo):
The price is hovering around the top of the Ichimoku cloud, suggesting neutral-to-bullish sentiment.
The cloud’s future span (Senkou Span A > Span B) points slightly upward — a sign of potential continuation of the uptrend.
Support lies near the $52.50–$52.60 zone, which aligns with both the lower channel line and the top of the cloud — a strong confluence area.
3. Momentum Observation:
The recent correction looks more like a healthy retracement than a reversal.
Buyers are likely waiting for confirmation before pushing higher.
4. Breakout Levels:
Immediate Resistance: $53.40 (mid-channel + previous top).
Major Resistance: $54.00 (upper channel target).
Support Zone: $52.50–$52.00 (Ichimoku + trendline confluence).
---
🚀 Bullish Scenario
If price closes above $53.40, it would confirm a breakout of the short-term consolidation pattern.
The projected move (based on the channel height) suggests a target near $54.50–$54.60.
