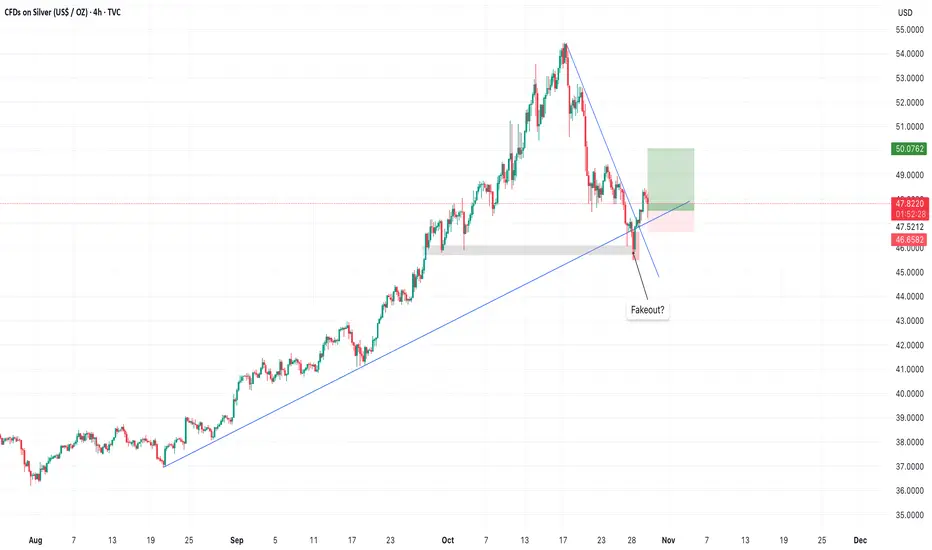
SILVER LongHello traders,
I am sharing my biases for Silver (XAG). My opinion is that we will have a touch to price 50$ at least. The reason why I'm getting long here is because we have a fakeout , and the trendline is holding properly. Also the bullish engulfing on 4H formed yesterday, gives another indication for long.
Silveranalysis
Silver - Expecting Bullish Continuation In The Short TermH4 - Strong bullish momentum.
No opposite signs.
Until the two Fibonacci support zones hold I expect the price to move higher further.
If you enjoy this idea, don’t forget to LIKE 👍, FOLLOW ✅, SHARE 🙌, and COMMENT ✍! Drop your thoughts and charts below to keep the discussion going. Your support helps keep this content free and reach more people! 🚀
--------------------------------------------------------------------------------------------------------------------

Silver’s Bull Run Isn’t Over Yet – Here’s Why!Hey traders, today is a great time to revisit the Silver vs. Gold debate .
Fundamentally, Silver ( OANDA:XAGUSD ) is currently hitting some pretty impressive levels. In fact, we’ve just seen Silver break above its All-Time High(ATH), surpassing $50, driven by strong industrial demand and global economic uncertainties .
What does this mean for us? Well, while Gold ( OANDA:XAUUSD ) remains the classic safe haven, silver’s dual role—both as a precious metal and a key industrial commodity—gives it a unique edge right now. The recent breakout suggests that silver might actually be an even more compelling bullish play than gold in the current market environment.
So if you’re feeling bullish, there’s a solid fundamental case for silver shining a bit brighter these days. Let's keep an eye on how it moves.
---------------------------------------------------------
Let’s dive into the 4-hour timeframe for silver . Recently, with the help of a head and shoulders pattern , silver began a correction and reached its target .
At the moment, it looks like Silver has completed its pullback to a heavy resistance zone($49.82-$43.00) and is now moving near a Potential Reversal Zone(PRZ) and a Support line .
From an Elliott Wave perspective , it seems that silver has completed its main wave 3(New ATH=$49.82) and is currently working through its main wave 4 , which so far looks like a Zigzag Correction .
I expect that Silver will resume its upward movement and climb at least up to about $50.77(First Target) .
Second Target: $52.61
Stop Loss(SL): $45.82(Worst)
Please respect each other's ideas and express them politely if you agree or disagree.
Silver/ U.S. Dollar Analyze (XAGUSD), 4-hour time frame.
Be sure to follow the updated ideas.
Do not forget to put a Stop loss for your positions (For every position you want to open).
Please follow your strategy and updates; this is just my Idea, and I will gladly see your ideas in this post.
Please do not forget the ✅' like '✅ button 🙏😊 & Share it with your friends; thanks, and Trade safe.

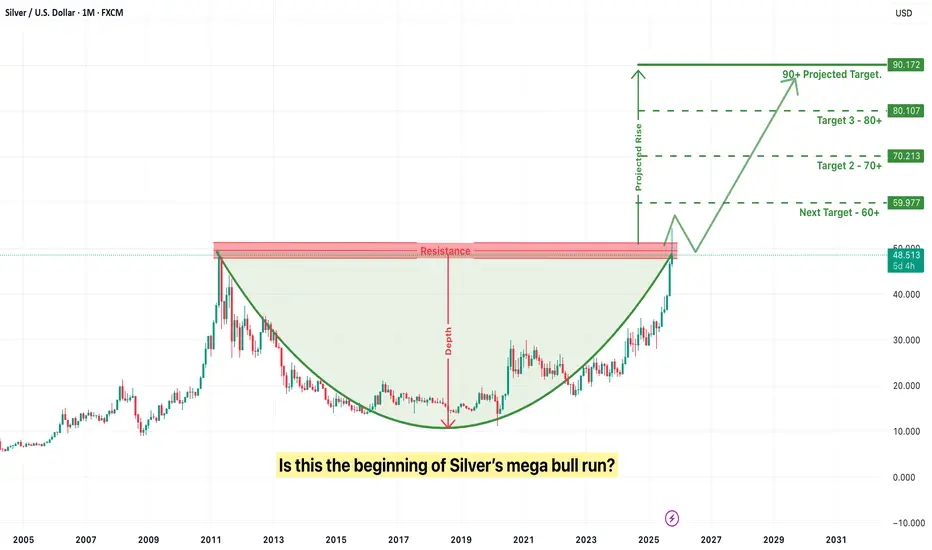
Is this the beginning of Silver’s mega bull run?For years silver has been seen as gold’s lesser companion — always important, but never truly leading. However, the world is now entering a new economic and technological era where silver is quietly transitioning from a secondary asset into a strategic metal of the future. What makes silver unique is that it is both an industrial metal and a monetary asset at the same time. Gold is used primarily for wealth protection, but silver has dual demand — it rises when technology adoption accelerates and it rises again when currencies weaken and investors seek a safe store of value. This rare combination places silver in a category of its own.
The most powerful driver behind silver’s future potential is the global energy and technology transformation. The world is rapidly shifting toward electric mobility, renewable power, high-speed communication networks and AI-scale computing. Every one of these megatrends directly increases silver consumption. Electric vehicles require significantly more silver than traditional cars because of their circuitry and conductivity needs. Solar panels have already become the single-largest industrial consumer of silver worldwide, and demand is projected to rise sharply due to green energy mandates and government policies. In the coming decade, silver will also be crucial to 5G infrastructure, robotics, space technology and medical-grade electronics. Simply put, modern technology cannot scale without silver.
While demand is rising rapidly, supply is structurally constrained. Most silver does not come from dedicated silver mines but as a by-product of mining other metals such as zinc, lead and copper. This means supply cannot simply increase when silver prices rise. If industrial base-metals mining slows, silver production automatically contracts. At the same time investment demand is rising, which creates a long-term deficit. This mismatch between rising demand and limited supply is exactly what leads to a major asset re-rating over time.
Another major factor supporting silver is the global macroeconomic cycle. Currencies across the world are losing value due to continuous money printing, rising debt and inflationary pressure. Investors are increasingly looking for hard assets that preserve purchasing power. Gold is traditionally the first choice, but it is already well accumulated and priced. Silver, being more affordable and under-owned, becomes the “accessible hedge” for the masses. Each time inflationary fears rise or fiat confidence falls, silver sees renewed investment flow.
Technically as well, silver is at a critical long-term juncture. The price structure is completing a multi-decade cup-and-handle pattern, which is one of the strongest bullish technical formations in commodity markets. Such large time-frame technical setups rarely appear, and when they do, their breakouts typically fuel multi-year trends rather than short rallies. A sustained breakout in silver has the potential to trigger a supercycle where price appreciation becomes exponential rather than linear.
However, while the long-term potential is extremely strong, investors should be aware of certain risks. Silver is far more volatile than gold and is known for sharp price swings in short timeframes. Breakouts can also produce temporary fake moves, trapping impatient investors who enter at the top and exit at the first correction. Because silver is tied to industrial demand, a short-term slowdown in the global economy can temporarily affect prices even when the long-term thesis remains intact. Another caution is the difference between physical silver and paper silver. Physical markets reflect real-world scarcity, while paper silver markets (ETFs, futures) can sometimes be suppressed by large institutional trading, creating short-term price distortions that do not reflect underlying fundamentals.
The key to winning with silver is adopting a patient, long-term perspective instead of a speculative trading mindset. Accumulation through systematic or staggered buying reduces timing risk and prevents emotional decision-making. A blend of physical holding for long-term security and digital exposure for liquidity creates the most efficient structure. Silver has historically rewarded patience and conviction while punishing emotional exits.
In conclusion, silver stands at the intersection of three powerful global shifts — technological transformation, monetary instability and resource scarcity. It is no longer just a precious metal; it is becoming a strategic asset for the coming decade. Gold protects capital, but silver has the potential to multiply it. This is why many economists, historians and market analysts believe silver is poised to become one of the most powerful wealth-building assets of the future.
Silver Price Falls Below $50Silver Price Falls Below $50
According to the XAG/USD chart, silver has fallen below the $50 mark after setting a historic high on 17 October, when the price briefly climbed above $54.40 for the first time.
Since then, the market has turned lower:
→ Silver formed a bearish ABCD pattern and broke below the key $50 psychological level.
→ A similar move occurred in gold, which dropped this week from around $4,375 to nearly $4,000 per ounce.
As many media outlets have noted:
→ The decline in precious metals appears to be a correction within a broader uptrend;
→ The fundamental outlook remains strong.
However, the aggressive nature of the sell-off raises concern.
→ On one hand, the drop may have been driven by an overheated rally and heavily leveraged long positions.
→ On the other, the speed of the decline suggests the autumn metals rally could be nearing exhaustion.
Technical Analysis of the XAG/USD Chart
An analysis of XAG/USD reveals several key turning points, allowing the construction of a widened ascending channel. This week’s drop has stretched the channel downward, effectively turning the former lower boundary into the new median line.
Bullish perspective:
→ The new lower boundary of the expanded channel acts as strong support.
→ A bullish RSI divergence has formed.
→ Price action near point D this morning resembles a potential Triple Bottom pattern.
Bearish perspective:
→ Selling pressure this week has been highly effective, with bears managing to break through:
$52.60, which has now flipped from support to resistance;
The $50 psychological level.
Given the above, it is reasonable to assume that bulls may attempt to use the lower boundary of the expanded channel to restart the autumn uptrend. However, after such a sharp sell-off, confidence may remain fragile. Should $50 now act as resistance, bears could target the next support near $45.88.
This article represents the opinion of the Companies operating under the FXOpen brand only. It is not to be construed as an offer, solicitation, or recommendation with respect to products and services provided by the Companies operating under the FXOpen brand, nor is it to be considered financial advice.

Silver Squeeze – Risk Reversals and Dollar Strength Sets InSilver has broken lower after recent highs, with the much-anticipated “silver squeeze” losing momentum. The market is now facing renewed pressure from a stronger U.S. dollar and broad risk-off sentiment, as investors trim exposure to commodities and metals.
The weekly close will be crucial — a bearish candlestick could confirm further downside potential, opening the door toward the USD 40.00 area, a key technical support zone.
Several factors are currently weighing on Silver:
- DXY rebound: The U.S. Dollar Index has bounced from support, attracting safe-haven demand and pressuring metals.
- Higher real yields: As inflation expectations ease, rising real yields make precious metals less attractive.
- ETF outflows: Institutional investors are trimming Silver ETF holdings, reducing speculative support.
- Weakness in industrial metals: A slowdown in China’s manufacturing sector is dragging down sentiment for Silver, which also has industrial demand.
- Technical exhaustion: After repeated tests of the USD 53.00 zone, momentum faded, and a breakdown below short-term moving averages confirmed a shift in tone.
If the current move continues, Silver could test USD 40.00 in the coming sessions. Only a decisive recovery above USD 52.00 would ease the short-term bearish outlook.

SILVER - Further Movement Up Idea for another surge up in silvers price to the top of this channel
I am using a bars pattern that shows similar price patterns to the current price action
Stretching this pattern out it can be used to plot a move upwards.
See if the moves are similar or not.
Weekly timeframe

Silver (XAGUSD) Setup — VWAP & Volume Profile Trade PlanXAGUSD Silver is in a strong bullish trend on the higher timeframes, but we’ve seen an aggressive short-term reversal 🔁. I’m using VWAP and Volume Profile to help plan my trade and identify value/support areas 📊.
If price remains above VWAP and shows support from the volume profile, I’ll look for a long opportunity — otherwise I’ll stay flat and wait for confirmation 🚦. Everything’s explained clearly in the video.
⚠️ Disclaimer: This is for educational purposes only and not financial advice.

Grand Silver SupercycleI present the Grand Silver Supercycle. Silver has followed Elliott Wave Theory nicely through the years. The price hit a century low during The Great Depression, beginning what I believe to be the first wave of a supercycle. There is a clear five wave pattern up from this low, peaking in 1980. This is supercycle wave 1. Then, we see a five wave corrective pattern down, bottoming out in the early 90s. Alternatively, a three wave ABC pattern could be drawn. This is where supercycle wave 3 begins. Wave 3 is typically much more prominent than wave 1 in Elliott Wave Theory. For this reason, it makes sense that the next five wave pattern ending in 2011 is only the first subwave of supercycle wave 3. The second subwave corrected to the 2020 low, and we are currently on the third subwave. Within this subwave, we could either be starting a third wave (as shown in the chart) or still be on the corrective second wave. I believe the former is much more likely due to fundamentals.
Price targets within the current subwave were estimated as follows:
wave 3 length = 1.618 X wave 1
wave 3 target = $48
wave 4 length = 38.2% retracement of wave 3
wave 5 length = 1.618 X (wave 3 end - wave 1 start)
I'm more confident on wave 3 ending near $48 than I am of wave 5 ending near $95. There is strong resistance at $50, which coincides with the Elliott target zone. Wave 5 length can vary significantly. For silver at least, fifth waves have traditionally been long ones.
Fundamentals
Elliott Wave Theory is only a tool. It needs to be backed up by fundamentals when forecasting on long time frames. Silver is undervalued due to many years of supply outstripping demand, creating cheap prices. That is in the early stages of changing as now demand outpaces supply. Global silver demand was expected to hit an all time high of 1.21 billion ounces in 2022 (www.silverinstitute.org). This is largely due to increases in demand in both industry (Green Revolution) and personal investment (stackers hedging against inflation). Silver reserves currently stand at 530,000 metric tons (www.statista.com). The current demand is 38,000 metric tons per year. A simple calculation shows existing reserves could be depleted in 14 years. However, this calculation doesn't take into account new discoveries and recycling, which have so far kept pace with demand. Estimates of time to depletion of reserves vary wildly from a couple decades to a few centuries. At the moment, the prime driver of price (in addition to inflation) will be the deficit, not depletion of reserves.
Inflation is a totally different animal that is much harder to forecast long term due to its close relationship to government and Federal Reserve policy. It is more likely that when presented the choice, our leaders choose high inflation over debt default and depression. How this all is going to play out is anyone's guess. It seems for now our leaders are trying to kick the can down the road for as long as possible. If hyperinflation hits, the silver price will reach extraordinary heights.

Silver is in the Down TrendHello Traders
In This Chart XAGUSD HOURLY Forex Forecast By FOREX PLANET
today XAGUSD analysis 👆
🟢This Chart includes_ (XAGUSD market update)
🟢What is The Next Opportunity on XAGUSD Market
🟢how to Enter to the Valid Entry With Assurance Profit
This CHART is For Trader's that Want to Improve Their Technical Analysis Skills and Their Trading By Understanding How To Analyze The Market Using Multiple Timeframes and Understanding The Bigger Picture on the Charts

#XAGUSD(SILVER): Price is likely to drop at $41 area. The current trading price of XAGUSD (SILVER) is at an all-time high. This is attributed to global uncertainty and the decline of the US Dollar. However, the lack of significant volume to support this level suggests a potential rapid decline. This decline could facilitate the price reaching a key level of $41.
There are two potential benefits from this drop. Firstly, it would allow for maximisation of trading by selling. Secondly, when the price reaches this level, we can purchase at the discounted price.
We wish you the best of luck and trade safely.
Team Setupsfx_

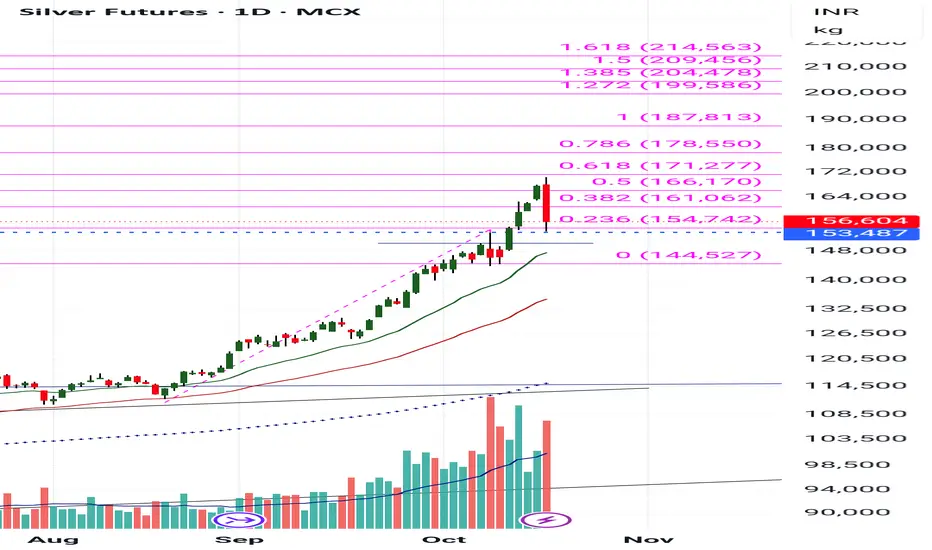
Silver 6% FallSilver corrected by 6% yesterday after a beautiful recent rally.
It touched 23.6% of Fibonacci. Expecting some consolidation now for say 2-3 days before hopefully bouncing back.
Let's see the opening of Monday !!!
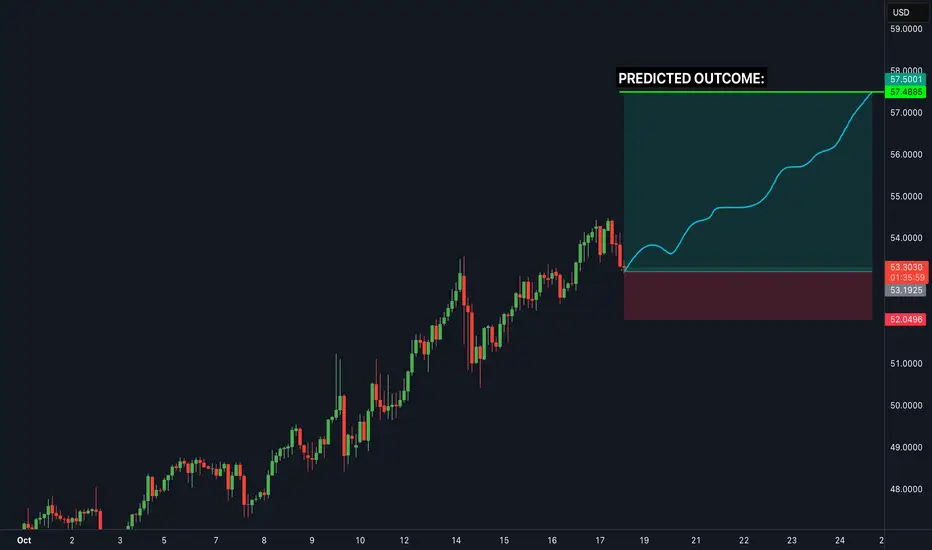
Silver Market Update Easy Breakdown!Silver’s been showing some strong moves lately ⚡ but it’s at a key decision point right now.
Here’s what I’m watching:
📉 If silver drops below 51.2, we could see a pullback toward 49.30–49.00 before the next push higher.
📈 For silver to reach the next big highs around $70, it needs to break above 52.60 first.
If that happens, the next targets are 54.60 and 57.00.
💡 So short-term dips? Totally normal.
Long-term silver still looks strong if it can clear those resistance levels.
Want to see how I’m reading these moves and what I’m watching next before it happens?
💬 DM me “SILVER” and I’ll share my private breakdown and targets directly.
Mindbloome Exchange
Trade Smarter Live Better

BUY SILVER! Perfect trade setupBased on deep analysis we can see silver is heading to the upside... this is a perfect risk to reward trade setup. Low risk high reward
Silver - Can it go to 50$? We like to hedge by Buying Silver and selling Gold:
Gold is already at all time highs , but Silver is not even half of it's previous highs (2011)
Silver, the 'Cinderella Gold' is a semiconductor - thus rises with technology
Silver rises and drops togethjer with Gold, thus allowing us to have a beautiful hedging opportunity for the next few months

Setupsfx_ | SILVER: Preparing For Another Bullish Move! There are two buying areas we believe could reverse the price trend, which would be a significant move in silver price history. We may even see it go above $40 for the first time. Silver is becoming a secondary best option to invest in the global market, but it will never surpass gold at least for now.
Good luck and trade safely!
Team Setupsfx_

Silver (XAGUSD) – Bearish Momentum Building#Silver (#XAGUSD H4) – Bearish Momentum Building
Current price: $52.46
Silver is showing early signs of a downside continuation after a completed corrective rebound. The structure suggests a potential shift toward a new impulsive leg lower.
🧩 Technical Overview
• Price reversed from the $53.00 resistance zone after completing a local correction.
• The rising channel was broken, confirming weakness and early downside momentum.
• Market structure now favors a decline, with the trend shifting toward lower highs and lower lows.
📉 Scenario
If price confirms a downward continuation:
• Stop-loss: above the recent high near $53.00.
• Once a clear H4 fractal forms, the stop should trail above the most recent fractal high.
• The main downside targets are aligned with Fibonacci levels from the previous swing:
– First zone: $50.50 (initial reaction area)
– Next support: $47.20–$47.40
– Extended target: $44.10–$44.30
– Major accumulation zone: $41.20
⚙️ Market Context
• The overall bullish impulse from mid-September appears exhausted.
• Lower timeframe momentum confirms growing pressure from sellers.
• A clean break below $50.50 would confirm continuation of the downward leg.
🧭 Summary
Silver remains in a corrective decline phase, showing potential for deeper retracement if sellers maintain control.
As long as price stays below $53.00, the bias remains bearish, with focus on $47.20–$44.00 as the key reaction zones.

Silver - Expecting Bullish Continuation In The Short TermH4 - Strong bullish momentum.
No opposite signs.
Until the two Fibonacci support zones hold I expect the price to move higher further.
If you enjoy this idea, don’t forget to LIKE 👍, FOLLOW ✅, SHARE 🙌, and COMMENT ✍! Drop your thoughts and charts below to keep the discussion going. Your support helps keep this content free and reach more people! 🚀
--------------------------------------------------------------------------------------------------------------------

Silver Price Reaches Record HighSilver Price Reaches Record High
The previous peak was set in 1980, but this week the price of silver rose above $53 for the first time ever, as shown on the XAG/USD chart.
Bullish sentiment has been driven by political factors, sustained demand from central banks, and the metal’s growing use in modern industries such as renewable energy.
Meanwhile, media reports are adding to the sense of market frenzy, noting:
→ shortages in physical supply;
→ forced liquidation of short positions (the “short squeeze” effect);
→ bold analyst forecasts — with a CNBC survey suggesting silver could double from current levels to reach $100.
Technical Analysis of the XAG/USD Chart
In earlier analysis of the XAG/USD chart, we:
→ identified an upward channel;
→ noted that silver’s rise was slowing around the $48.75 level, though new record highs in gold could spur the “silver bulls”.
That slowdown has proved to be merely a pause before a breakout to fresh 45-year highs. The ascending channel has maintained its slope but widened upward — notably, the current all-time high sits along the upper boundary of this expanded channel.
Key observations:
→ A sharp drop of more than 5% over the past two candles signals strong selling pressure, likely linked to profit-taking after a roughly 17% rise over the past 30 days.
→ Long lower wicks on the recent wide candles (as indicated by the arrow) show active buying interest.
→ The rise in the ATR indicator became evident as the market broke through the key psychological level of $50 per ounce.
The increase in volatility means traders may need to adjust their strategies — it can also signal that a market reversal could be nearing, as extreme price swings often mark the end of prolonged trends.
For now, however, demand remains strong enough to keep the market within its upward channel:
→ bulls are likely to view the $50–50.50 area as key support;
→ bears may look to reassert control if XAG/USD attempts to climb further above $53.
This article represents the opinion of the Companies operating under the FXOpen brand only. It is not to be construed as an offer, solicitation, or recommendation with respect to products and services provided by the Companies operating under the FXOpen brand, nor is it to be considered financial advice.

#XAGUSD Silver – Monthly Chart (Higher Time Frame Analysis Updat📈 #XAGUSD Silver – Monthly Chart (Higher Time Frame Analysis Update)
On the monthly COMEX chart, Silver has reached a historically critical zone — a level it has touched only three times since its inception on the forex market ⚡️
### 🕰 Historical Context
1️⃣ 1980:
Silver made its first-ever major peak around $48, followed by a massive correction all the way down to $5.
2️⃣ April 2011:
The metal created another lifetime high at $49.80, but history repeated itself — price crashed sharply, touching lows near $11.50 in subsequent years.
3️⃣ October 2025 (Current Scenario):
Silver has now printed a new high at $51.20, marking its third attempt in history to sustain above the psychological barrier of $50.
---
### 🔍 Key Technical Outlook
Both previous times, Silver failed to sustain above $50, leading to deep corrections.
Hence, this time, we need to see at least 1–2 consecutive weekly candle closings above the $50–$51 zone to confirm a strong breakout and trend continuation.
Once that confirmation comes in, we could confidently plan fresh long entries, as this would signal a potential super-cycle rally in Silver 🔥
---
### 🎯 Upside Projections
If Silver manages to hold above $50 convincingly, the next major targets on a higher timeframe would be:
* First Target: $60
* Extended Target: $68
This move could potentially open the doors for a massive long-term bullish phase, supported by both technical breakout and global precious metal demand fundamentals 💎

Silver Shines — But Caution Ahead?Silver Shines — But Caution Ahead?
- Silver has just hit a fresh all-time high of $51.70, breaking past its 2011 record.
- However, the monthly RSI is racing toward the extreme 85.00 zone, a level that previously marked major tops in 2006, 2008, and 2011.
Momentum remains strong, but history suggests (as shown in the monthly Silver Chart) that when RSI enters this zone, sharp pullbacks tend to follow.
I don't mean, the the rally is over — but it's just a reminder that every time a steep vertical move is often followed by high volatility (volatility might invite pullbacks).

Silver will Make a New All Time HighHello Traders
In This Chart XAGUSD HOURLY Forex Forecast By FOREX PLANET
today XAGUSD analysis 👆
🟢This Chart includes_ (XAGUSD market update)
🟢What is The Next Opportunity on XAGUSD Market
🟢how to Enter to the Valid Entry With Assurance Profit
This CHART is For Trader's that Want to Improve Their Technical Analysis Skills and Their Trading By Understanding How To Analyze The Market Using Multiple Timeframes and Understanding The Bigger Picture on the Charts

Silver Fractal Analysis $50 short time frame analysis, silver could go much higher than $50.
this is however just a short term analysis, until we break resistance and turn support $50 is the target price.
