Silver is in the Bullish directionHello Traders
In This Chart XAGUSD HOURLY Forex Forecast By FOREX PLANET
today XAGUSD analysis 👆
🟢This Chart includes_ (XAGUSD market update)
🟢What is The Next Opportunity on XAGUSD Market
🟢how to Enter to the Valid Entry With Assurance Profit
This CHART is For Trader's that Want to Improve Their Technical Analysis Skills and Their Trading By Understanding How To Analyze The Market Using Multiple Timeframes and Understanding The Bigger Picture on the Charts
Silveranalysis
Silver - The catastrophic rejection!🆘Silver ( TVC:SILVER ) is just collapsing:
🔎Analysis summary:
At this exact moment, Silver is retesting the previous all time highs, which were already rejected about 45 years ago. Considering the extremely bearish rejection on the smaller timeframes, Silver simply fails to break out. This will lead to a devastating reversal.
📝Levels to watch:
$50
SwingTraderPhil
SwingTrading.Simplified. | Investing.Simplified. | #LONGTERMVISION

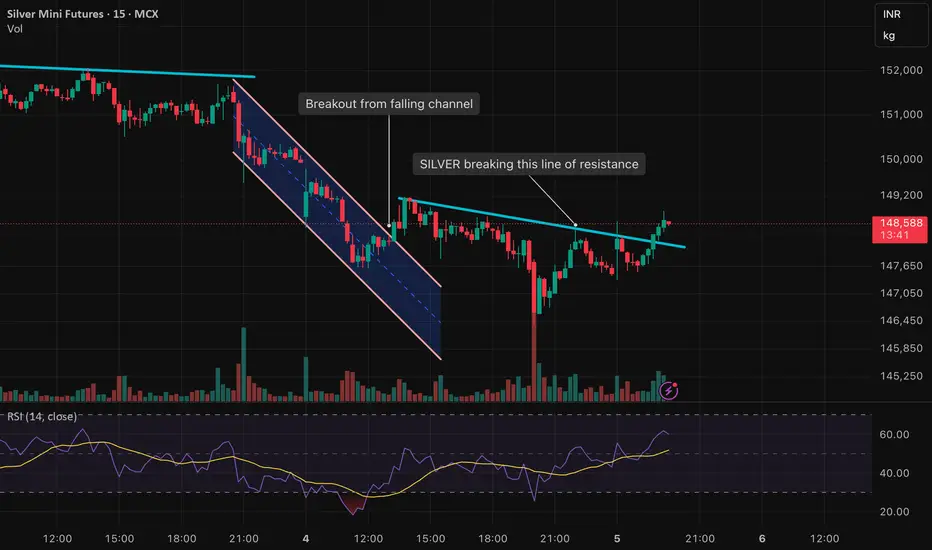
SILVER breaks above Line of ResistanceSILVER price breaks the marked line of resistance. Earlier the chart was respecting this line however this time it broke after US Employment data which is supportive for gold and silvre prices
SILVER forming a wedge pattern ready for either side brakoutPrice action on Silver is getting tighter and is now trading inside a wedge formation, which usually leads to a strong move once price breaks out — either up or down. No bias yet, just preparing for momentum on whichever side gives confirmation.
📌 What I’m watching:
• Trendline breakout with volume
• Retest + continuation for safer entries
• Volatility spike around key levels
• RSI & momentum alignment before execution
⚠️ Not a buy/sell call. This is just market observation for educational purposes.
Trade your own plan, manage risk, and respect position sizing.
If you like clean chart breakdowns, price-action setups and real-time market tracking — hit follow so you don’t miss the next update.
XAGUSD Bullish Continuation: Rectangle Breakout Toward 55Silver (XAGUSD) has cooled after a powerful August–October rally, slipping into a clean 1D rectangle between 46.00 and 50.00. Price sits below the MA20 but above the MA60/MA120, keeping the broader uptrend intact while momentum resets. The recent volatility burst has faded and bands have tightened, which often precedes expansion. The major supply remains the mid-October swing high near 55.00, while structurally important demand rests at 39.50 from the summer base.
Primary path: look for a daily close above 50.00 to confirm a range breakout and resume the trend toward 55.00. If it breaks, bullish exposure can be managed with invalidation on a daily close back below 47.50 (the post-break area), acknowledging MA60 backup near 44.63. Until that trigger prints, the base case is continued chop inside 46.00–50.00 with mean-reversion around the MA20.
Alternative path: a daily close below 46.00 flips the range lower and opens a corrective leg toward 44.60 (MA60) and potentially 42.00. Short setups from a 46.00 break should be invalidated on a close back above 48.00. Bigger-picture invalidation for the bullish structure sits at 39.50 — a sustained break there would negate the uptrend context.
Levels to watch: Resistance 50.00 (breakout) and 55.00; Support 46.00, 44.60, and 39.50. Triggers: 1D close >50.00 (bullish) or <46.00 (bearish). Targets: 55.00 on upside; 44.60/42.00 on downside. This is a study, not financial advice. Manage risk and invalidations.

Silver forming a long-term “Cup and Handle” - as Gold didSilver seems to be repeating the same institutional “Cup and Handle” structure that we recently saw play out perfectly on Gold.
On Gold, the price completed the entire measured move — equal to the depth of the cup — before entering consolidation.
Now, Silver is building a very similar long-term formation, and this setup could define the market direction for the next several years.
🧠 Technical Context
On the higher timeframes (1W and 1M), Silver has formed a clear rounded base — the cup.
The current consolidation area represents the handle, and price is now approaching the upper boundary of that handle.
Once we see a decisive breakout above the handle resistance, institutions will likely defend that zone on the first retest.
This pattern is one of the most reliable continuation formations in long-term trends, especially when accompanied by rising volume near the breakout area.
There’s a very important condition: this pattern becomes active only after the handle breakout.
Before the breakout, it’s just an unconfirmed structure — the pattern is validated only once the handle level is broken.
🎯 Trade Plan
Breakout Level (Handle Resistance): around $50.0 – $51
Usually, the breakout happens on high volume, accompanied by several strong bullish candles
Retest Zone: $30 – $35.0
Target (long-term extension): $600.0+
Stop-Loss: according to your risk management strategy
📊 Summary
If Silver repeats the Gold scenario, we might see a clean breakout–retest–continuation structure with very limited pullbacks once the move begins.
This could mark the start of a multi-year bullish phase in silver.
I’ll be monitoring the breakout confirmation and volume profile closely before entering.
Once confirmed, the upside potential looks substantial compared to the risk.
This is not financial advice. For educational purposes only

Silver H1 | Heading Into 61.8% Fibonacci ResistanceBased on the H1 chart analysis, we could see the price rise to the sell entry, which has an overlap resistance that aligns with the 61.8% Fibonacci retracement and could reverse from this levle to the upside.
Sell entry is at 48.35, which is an overlap resistance that aligns with the 61.8% Fibonacci retracement
Stop loss is at 49.26, whic is a multi swing high resistance.
Take profit is at 46.98, which is an overlap support.
Stratos Markets Limited (tradu.com ):
CFDs are complex instruments and come with a high risk of losing money rapidly due to leverage. 68% of retail investor accounts lose money when trading CFDs with this provider. You should consider whether you understand how CFDs work and whether you can afford to take the high risk of losing your money.
Stratos Europe Ltd (tradu.com ):
CFDs are complex instruments and come with a high risk of losing money rapidly due to leverage. 70% of retail investor accounts lose money when trading CFDs with this provider. You should consider whether you understand how CFDs work and whether you can afford to take the high risk of losing your money.

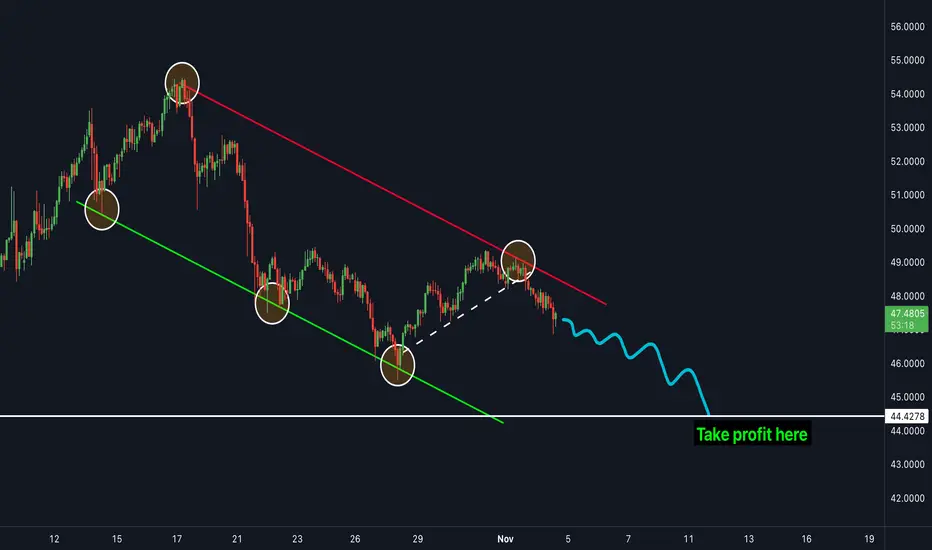
SILVER is ready to drop more - SELL NOW!Silver has been in a clear downtrend for the last few weeks and has struggled to move to the upside. The price is currently in between a bearish channel and is bouncing in-between both resistance and support zones. The price broke the most recent trendline (shown in white) which acted as a support zone. The next target is the white line shown on the chart as "take profit". This is the next major support zone which the price is very likely to hit next.
XAG/USD Analysis: Price Stabilises Below the Psychological LevelXAG/USD Analysis: Price Stabilises Below the Psychological Level
October proved exceptionally volatile for the silver market — the price broke past a historical record, climbing above $50. However, after widespread profit-taking, the market reversed downward.
XAG/USD is currently influenced by several factors:
→ prospects for Federal Reserve policy;
→ the easing of trade tensions between the United States and China;
→ the potential government shutdown and related news.
As indicated by the ATR indicator, volatility is declining — suggesting that supply and demand forces may be finding a balance.
Technical Analysis of the XAG/USD Chart
The broad upward channel remains intact, though it is worth noting that its median line has shifted from acting as support to serving as resistance.
From a bullish perspective:
→ the lower boundary of the channel acts as strong support;
→ the bullish A-B-C-D structure indicates that demand is recovering.
From a bearish perspective: if the silver price continues to rise, it will face resistance at:
→ the psychological $50 mark;
→ the 21 October drop zone, where selling pressure previously dominated.
Given the above, it is reasonable to assume that:
→ in the near term, the price may consolidate around the QL line;
→ if bearish momentum resumes, the alternative downward channel (shown in red) will gain relevance.
This article represents the opinion of the Companies operating under the FXOpen brand only. It is not to be construed as an offer, solicitation, or recommendation with respect to products and services provided by the Companies operating under the FXOpen brand, nor is it to be considered financial advice.

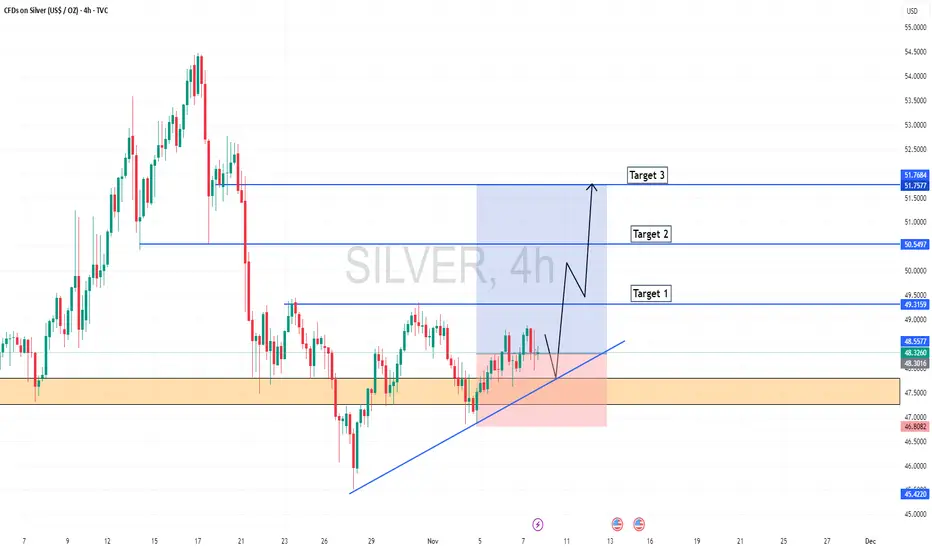
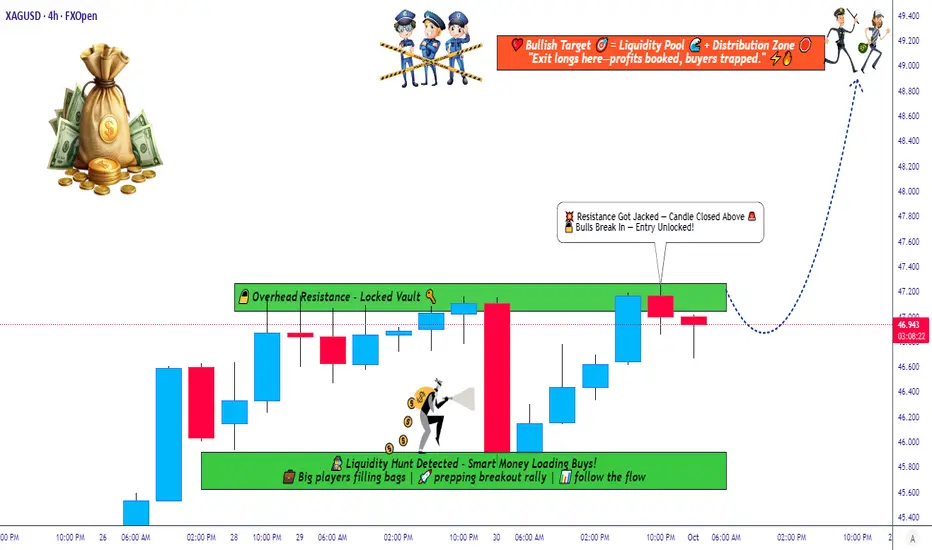
Silver Strategy Map — Thief Layers, Smart Targets, and Risk Zone📊 XAG/USD “Silver vs U.S Dollar” — Metals Market Wealth Strategy Map (Swing/Day Trade)
🔑 Plan: Bullish Setup
This setup follows the “Thief Strategy”, which means using layered limit entries to scale into the trade. Instead of going all-in at one level, we “steal the entries” across multiple layers.
💰 Layered Buy Limit Entries (Example Setup):
46.200
46.400
46.600
46.800
47.000
👉 You can increase layers as per your own plan and risk style.
🛑 Stop Loss (Protective Exit): 45.600
(This is my thief SL — but you’re free to adjust as per your own risk appetite.)
🎯 Target Zone: 49.000
⚠️ Around 49.300, we see a “Police Barricade” (heavy resistance + overbought conditions + potential trap).
That’s where profits should be taken — escape with gains before the trap closes!
Why This Setup?
Support Zones: Strong accumulation zones forming near 45.600–46.000.
Trend Bias: Silver remains bullish in the medium-term metals market outlook.
Layering Strategy Advantage: Reduces entry risk and allows better average fill.
Profit Zone: 49.000 aligns with strong supply area + RSI extension risk.
🔗 Correlation & Related Pairs to Watch
OANDA:XAUUSD (Gold vs USD): Gold often leads Silver’s moves — watch Gold for early signals.
TVC:DXY (US Dollar Index): A weaker USD usually boosts metals.
TVC:PLATINUM & CAPITALCOM:PALLADIUM : Industrial metals correlation — strong moves here can influence Silver sentiment.
TVC:SILVER Futures: Always track COMEX Silver contracts for volume confirmation.
✨ “If you find value in my analysis, a 👍 and 🚀 boost is much appreciated — it helps me share more setups with the community!”
📌 Disclaimer: This is a Thief-style trading strategy, created just for fun and educational sharing. Not financial advice — trade at your own risk.
#XAGUSD #Silver #Metals #TradingStrategy #SwingTrade #DayTrade #ThiefStrategy #Gold #DXY #Forex #Commodities
Weekend Analysis: DXY, BTC, Gold, Silver, Nas100 and SPX500In this video presentation I am expecting the dollar index to continue its uptrend on the lower time frame towards the liquidation level target of 99.500.
Bitcoin is still in a distribution range and currently correcting the sharp sell off from $126,296. I am observing an A-B-C corrective pattern potentially to targets of either $115,044 or $117,653. These are confluence of resistance level and will be expecting a sell off from these levels. If these levels gets invalidated then potentially the all time highs of $126k is in view. However that's not my expectation so a breach of the target level will invalidate the bearish analysis on Bitcoin.
I think Gold and Silver have peaked out for now and smart money is off loading to FOMO retail traders. I am expect Silver to sell off much faster than Gold.
Nas100 and SPX500 clinched to a breakout of new highs but the buying volume is fading out and seems to be a fake out. I will be watching if the breakout levels gets support or breakdown on pullback to decide a long position or short position.
This is my opinion on the market this week and I thank you for your time to visit my publications.
Have a great trading week and don't forget risk and money management is your first job as trader or investor. Cheers!!

Silver is in the Bullish directionHello Traders
In This Chart XAGUSD HOURLY Forex Forecast By FOREX PLANET
today XAGUSD analysis 👆
🟢This Chart includes_ (XAGUSD market update)
🟢What is The Next Opportunity on XAGUSD Market
🟢how to Enter to the Valid Entry With Assurance Profit
This CHART is For Trader's that Want to Improve Their Technical Analysis Skills and Their Trading By Understanding How To Analyze The Market Using Multiple Timeframes and Understanding The Bigger Picture on the Charts

Short in silverAs you can see there is shorting opportunity in silver as well as gold so what is your view on this??????

SilverXAGUSD
- Completed " 12345 " Impulsive Waves
- Demand Zone
- Fibonacci Level - 50.00% / 61.80%
- RSI - Divergence
- Bullish Channel as an corrective pattern in Short Time Frame

SILVER LongHello traders,
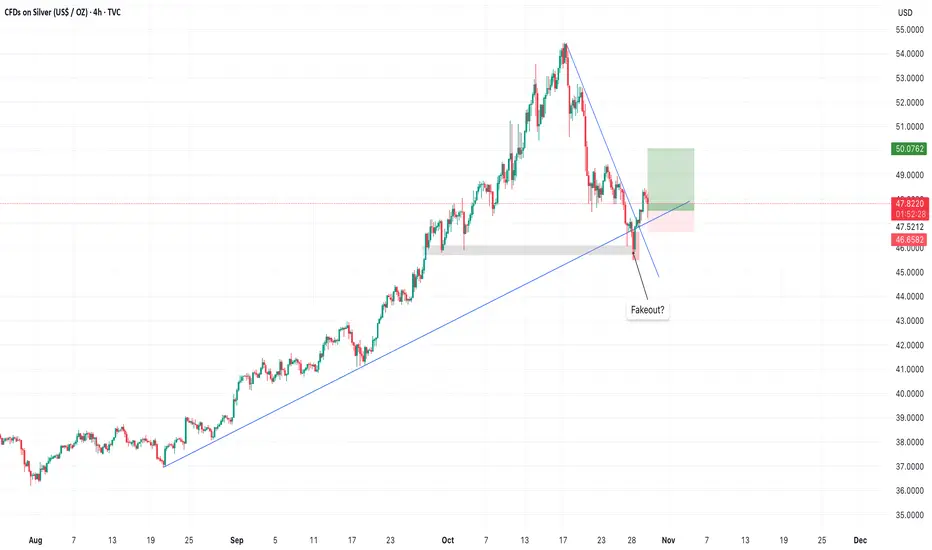
I am sharing my biases for Silver (XAG). My opinion is that we will have a touch to price 50$ at least. The reason why I'm getting long here is because we have a fakeout , and the trendline is holding properly. Also the bullish engulfing on 4H formed yesterday, gives another indication for long.
Silver - Expecting Bullish Continuation In The Short TermH4 - Strong bullish momentum.
No opposite signs.
Until the two Fibonacci support zones hold I expect the price to move higher further.
If you enjoy this idea, don’t forget to LIKE 👍, FOLLOW ✅, SHARE 🙌, and COMMENT ✍! Drop your thoughts and charts below to keep the discussion going. Your support helps keep this content free and reach more people! 🚀
--------------------------------------------------------------------------------------------------------------------

Silver’s Bull Run Isn’t Over Yet – Here’s Why!Hey traders, today is a great time to revisit the Silver vs. Gold debate .
Fundamentally, Silver ( OANDA:XAGUSD ) is currently hitting some pretty impressive levels. In fact, we’ve just seen Silver break above its All-Time High(ATH), surpassing $50, driven by strong industrial demand and global economic uncertainties .
What does this mean for us? Well, while Gold ( OANDA:XAUUSD ) remains the classic safe haven, silver’s dual role—both as a precious metal and a key industrial commodity—gives it a unique edge right now. The recent breakout suggests that silver might actually be an even more compelling bullish play than gold in the current market environment.
So if you’re feeling bullish, there’s a solid fundamental case for silver shining a bit brighter these days. Let's keep an eye on how it moves.
---------------------------------------------------------
Let’s dive into the 4-hour timeframe for silver . Recently, with the help of a head and shoulders pattern , silver began a correction and reached its target .
At the moment, it looks like Silver has completed its pullback to a heavy resistance zone($49.82-$43.00) and is now moving near a Potential Reversal Zone(PRZ) and a Support line .
From an Elliott Wave perspective , it seems that silver has completed its main wave 3(New ATH=$49.82) and is currently working through its main wave 4 , which so far looks like a Zigzag Correction .
I expect that Silver will resume its upward movement and climb at least up to about $50.77(First Target) .
Second Target: $52.61
Stop Loss(SL): $45.82(Worst)
Please respect each other's ideas and express them politely if you agree or disagree.
Silver/ U.S. Dollar Analyze (XAGUSD), 4-hour time frame.
Be sure to follow the updated ideas.
Do not forget to put a Stop loss for your positions (For every position you want to open).
Please follow your strategy and updates; this is just my Idea, and I will gladly see your ideas in this post.
Please do not forget the ✅' like '✅ button 🙏😊 & Share it with your friends; thanks, and Trade safe.

Silver Price Falls Below $50Silver Price Falls Below $50
According to the XAG/USD chart, silver has fallen below the $50 mark after setting a historic high on 17 October, when the price briefly climbed above $54.40 for the first time.
Since then, the market has turned lower:
→ Silver formed a bearish ABCD pattern and broke below the key $50 psychological level.
→ A similar move occurred in gold, which dropped this week from around $4,375 to nearly $4,000 per ounce.
As many media outlets have noted:
→ The decline in precious metals appears to be a correction within a broader uptrend;
→ The fundamental outlook remains strong.
However, the aggressive nature of the sell-off raises concern.
→ On one hand, the drop may have been driven by an overheated rally and heavily leveraged long positions.
→ On the other, the speed of the decline suggests the autumn metals rally could be nearing exhaustion.
Technical Analysis of the XAG/USD Chart
An analysis of XAG/USD reveals several key turning points, allowing the construction of a widened ascending channel. This week’s drop has stretched the channel downward, effectively turning the former lower boundary into the new median line.
Bullish perspective:
→ The new lower boundary of the expanded channel acts as strong support.
→ A bullish RSI divergence has formed.
→ Price action near point D this morning resembles a potential Triple Bottom pattern.
Bearish perspective:
→ Selling pressure this week has been highly effective, with bears managing to break through:
$52.60, which has now flipped from support to resistance;
The $50 psychological level.
Given the above, it is reasonable to assume that bulls may attempt to use the lower boundary of the expanded channel to restart the autumn uptrend. However, after such a sharp sell-off, confidence may remain fragile. Should $50 now act as resistance, bears could target the next support near $45.88.
This article represents the opinion of the Companies operating under the FXOpen brand only. It is not to be construed as an offer, solicitation, or recommendation with respect to products and services provided by the Companies operating under the FXOpen brand, nor is it to be considered financial advice.

Silver Squeeze – Risk Reversals and Dollar Strength Sets InSilver has broken lower after recent highs, with the much-anticipated “silver squeeze” losing momentum. The market is now facing renewed pressure from a stronger U.S. dollar and broad risk-off sentiment, as investors trim exposure to commodities and metals.
The weekly close will be crucial — a bearish candlestick could confirm further downside potential, opening the door toward the USD 40.00 area, a key technical support zone.
Several factors are currently weighing on Silver:
- DXY rebound: The U.S. Dollar Index has bounced from support, attracting safe-haven demand and pressuring metals.
- Higher real yields: As inflation expectations ease, rising real yields make precious metals less attractive.
- ETF outflows: Institutional investors are trimming Silver ETF holdings, reducing speculative support.
- Weakness in industrial metals: A slowdown in China’s manufacturing sector is dragging down sentiment for Silver, which also has industrial demand.
- Technical exhaustion: After repeated tests of the USD 53.00 zone, momentum faded, and a breakdown below short-term moving averages confirmed a shift in tone.
If the current move continues, Silver could test USD 40.00 in the coming sessions. Only a decisive recovery above USD 52.00 would ease the short-term bearish outlook.

SILVER - Further Movement Up Idea for another surge up in silvers price to the top of this channel
I am using a bars pattern that shows similar price patterns to the current price action
Stretching this pattern out it can be used to plot a move upwards.
See if the moves are similar or not.
Weekly timeframe

Silver (XAGUSD) Setup — VWAP & Volume Profile Trade PlanXAGUSD Silver is in a strong bullish trend on the higher timeframes, but we’ve seen an aggressive short-term reversal 🔁. I’m using VWAP and Volume Profile to help plan my trade and identify value/support areas 📊.
If price remains above VWAP and shows support from the volume profile, I’ll look for a long opportunity — otherwise I’ll stay flat and wait for confirmation 🚦. Everything’s explained clearly in the video.
⚠️ Disclaimer: This is for educational purposes only and not financial advice.

Grand Silver SupercycleI present the Grand Silver Supercycle. Silver has followed Elliott Wave Theory nicely through the years. The price hit a century low during The Great Depression, beginning what I believe to be the first wave of a supercycle. There is a clear five wave pattern up from this low, peaking in 1980. This is supercycle wave 1. Then, we see a five wave corrective pattern down, bottoming out in the early 90s. Alternatively, a three wave ABC pattern could be drawn. This is where supercycle wave 3 begins. Wave 3 is typically much more prominent than wave 1 in Elliott Wave Theory. For this reason, it makes sense that the next five wave pattern ending in 2011 is only the first subwave of supercycle wave 3. The second subwave corrected to the 2020 low, and we are currently on the third subwave. Within this subwave, we could either be starting a third wave (as shown in the chart) or still be on the corrective second wave. I believe the former is much more likely due to fundamentals.
Price targets within the current subwave were estimated as follows:
wave 3 length = 1.618 X wave 1
wave 3 target = $48
wave 4 length = 38.2% retracement of wave 3
wave 5 length = 1.618 X (wave 3 end - wave 1 start)
I'm more confident on wave 3 ending near $48 than I am of wave 5 ending near $95. There is strong resistance at $50, which coincides with the Elliott target zone. Wave 5 length can vary significantly. For silver at least, fifth waves have traditionally been long ones.
Fundamentals
Elliott Wave Theory is only a tool. It needs to be backed up by fundamentals when forecasting on long time frames. Silver is undervalued due to many years of supply outstripping demand, creating cheap prices. That is in the early stages of changing as now demand outpaces supply. Global silver demand was expected to hit an all time high of 1.21 billion ounces in 2022 (www.silverinstitute.org). This is largely due to increases in demand in both industry (Green Revolution) and personal investment (stackers hedging against inflation). Silver reserves currently stand at 530,000 metric tons (www.statista.com). The current demand is 38,000 metric tons per year. A simple calculation shows existing reserves could be depleted in 14 years. However, this calculation doesn't take into account new discoveries and recycling, which have so far kept pace with demand. Estimates of time to depletion of reserves vary wildly from a couple decades to a few centuries. At the moment, the prime driver of price (in addition to inflation) will be the deficit, not depletion of reserves.
Inflation is a totally different animal that is much harder to forecast long term due to its close relationship to government and Federal Reserve policy. It is more likely that when presented the choice, our leaders choose high inflation over debt default and depression. How this all is going to play out is anyone's guess. It seems for now our leaders are trying to kick the can down the road for as long as possible. If hyperinflation hits, the silver price will reach extraordinary heights.

Silver is in the Down TrendHello Traders
In This Chart XAGUSD HOURLY Forex Forecast By FOREX PLANET
today XAGUSD analysis 👆
🟢This Chart includes_ (XAGUSD market update)
🟢What is The Next Opportunity on XAGUSD Market
🟢how to Enter to the Valid Entry With Assurance Profit
This CHART is For Trader's that Want to Improve Their Technical Analysis Skills and Their Trading By Understanding How To Analyze The Market Using Multiple Timeframes and Understanding The Bigger Picture on the Charts
