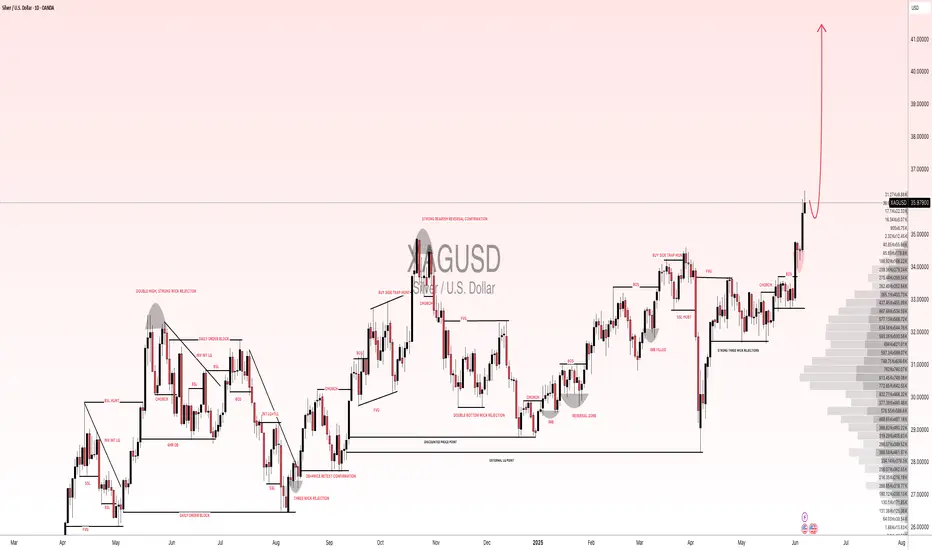
#XAGUSD(SILVER): Price is likely to drop at $41 area. The current trading price of XAGUSD (SILVER) is at an all-time high. This is attributed to global uncertainty and the decline of the US Dollar. However, the lack of significant volume to support this level suggests a potential rapid decline. This decline could facilitate the price reaching a key level of $41.
There are two potential benefits from this drop. Firstly, it would allow for maximisation of trading by selling. Secondly, when the price reaches this level, we can purchase at the discounted price.
We wish you the best of luck and trade safely.
Team Setupsfx_
Silveranalysis

Silver 6% FallSilver corrected by 6% yesterday after a beautiful recent rally.
It touched 23.6% of Fibonacci. Expecting some consolidation now for say 2-3 days before hopefully bouncing back.
Let's see the opening of Monday !!!
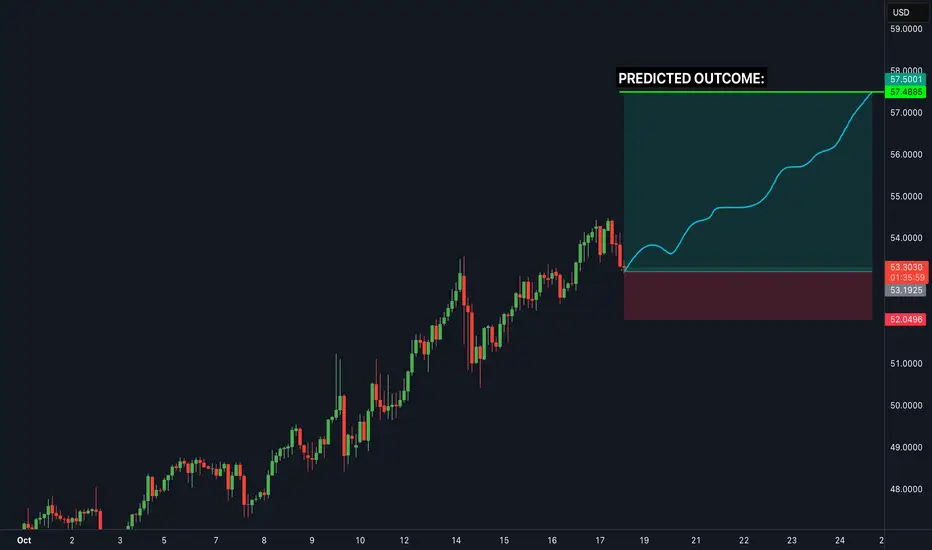
Silver Market Update Easy Breakdown!Silver’s been showing some strong moves lately ⚡ but it’s at a key decision point right now.
Here’s what I’m watching:
📉 If silver drops below 51.2, we could see a pullback toward 49.30–49.00 before the next push higher.
📈 For silver to reach the next big highs around $70, it needs to break above 52.60 first.
If that happens, the next targets are 54.60 and 57.00.
💡 So short-term dips? Totally normal.
Long-term silver still looks strong if it can clear those resistance levels.
Want to see how I’m reading these moves and what I’m watching next before it happens?
💬 DM me “SILVER” and I’ll share my private breakdown and targets directly.
Mindbloome Exchange
Trade Smarter Live Better

BUY SILVER! Perfect trade setupBased on deep analysis we can see silver is heading to the upside... this is a perfect risk to reward trade setup. Low risk high reward
Silver - Can it go to 50$? We like to hedge by Buying Silver and selling Gold:
Gold is already at all time highs , but Silver is not even half of it's previous highs (2011)
Silver, the 'Cinderella Gold' is a semiconductor - thus rises with technology
Silver rises and drops togethjer with Gold, thus allowing us to have a beautiful hedging opportunity for the next few months

Setupsfx_ | SILVER: Preparing For Another Bullish Move! There are two buying areas we believe could reverse the price trend, which would be a significant move in silver price history. We may even see it go above $40 for the first time. Silver is becoming a secondary best option to invest in the global market, but it will never surpass gold at least for now.
Good luck and trade safely!
Team Setupsfx_

Silver (XAGUSD) – Bearish Momentum Building#Silver (#XAGUSD H4) – Bearish Momentum Building
Current price: $52.46
Silver is showing early signs of a downside continuation after a completed corrective rebound. The structure suggests a potential shift toward a new impulsive leg lower.
🧩 Technical Overview
• Price reversed from the $53.00 resistance zone after completing a local correction.
• The rising channel was broken, confirming weakness and early downside momentum.
• Market structure now favors a decline, with the trend shifting toward lower highs and lower lows.
📉 Scenario
If price confirms a downward continuation:
• Stop-loss: above the recent high near $53.00.
• Once a clear H4 fractal forms, the stop should trail above the most recent fractal high.
• The main downside targets are aligned with Fibonacci levels from the previous swing:
– First zone: $50.50 (initial reaction area)
– Next support: $47.20–$47.40
– Extended target: $44.10–$44.30
– Major accumulation zone: $41.20
⚙️ Market Context
• The overall bullish impulse from mid-September appears exhausted.
• Lower timeframe momentum confirms growing pressure from sellers.
• A clean break below $50.50 would confirm continuation of the downward leg.
🧭 Summary
Silver remains in a corrective decline phase, showing potential for deeper retracement if sellers maintain control.
As long as price stays below $53.00, the bias remains bearish, with focus on $47.20–$44.00 as the key reaction zones.

Silver - Expecting Bullish Continuation In The Short TermH4 - Strong bullish momentum.
No opposite signs.
Until the two Fibonacci support zones hold I expect the price to move higher further.
If you enjoy this idea, don’t forget to LIKE 👍, FOLLOW ✅, SHARE 🙌, and COMMENT ✍! Drop your thoughts and charts below to keep the discussion going. Your support helps keep this content free and reach more people! 🚀
--------------------------------------------------------------------------------------------------------------------

Silver Price Reaches Record HighSilver Price Reaches Record High
The previous peak was set in 1980, but this week the price of silver rose above $53 for the first time ever, as shown on the XAG/USD chart.
Bullish sentiment has been driven by political factors, sustained demand from central banks, and the metal’s growing use in modern industries such as renewable energy.
Meanwhile, media reports are adding to the sense of market frenzy, noting:
→ shortages in physical supply;
→ forced liquidation of short positions (the “short squeeze” effect);
→ bold analyst forecasts — with a CNBC survey suggesting silver could double from current levels to reach $100.
Technical Analysis of the XAG/USD Chart
In earlier analysis of the XAG/USD chart, we:
→ identified an upward channel;
→ noted that silver’s rise was slowing around the $48.75 level, though new record highs in gold could spur the “silver bulls”.
That slowdown has proved to be merely a pause before a breakout to fresh 45-year highs. The ascending channel has maintained its slope but widened upward — notably, the current all-time high sits along the upper boundary of this expanded channel.
Key observations:
→ A sharp drop of more than 5% over the past two candles signals strong selling pressure, likely linked to profit-taking after a roughly 17% rise over the past 30 days.
→ Long lower wicks on the recent wide candles (as indicated by the arrow) show active buying interest.
→ The rise in the ATR indicator became evident as the market broke through the key psychological level of $50 per ounce.
The increase in volatility means traders may need to adjust their strategies — it can also signal that a market reversal could be nearing, as extreme price swings often mark the end of prolonged trends.
For now, however, demand remains strong enough to keep the market within its upward channel:
→ bulls are likely to view the $50–50.50 area as key support;
→ bears may look to reassert control if XAG/USD attempts to climb further above $53.
This article represents the opinion of the Companies operating under the FXOpen brand only. It is not to be construed as an offer, solicitation, or recommendation with respect to products and services provided by the Companies operating under the FXOpen brand, nor is it to be considered financial advice.

Silver Shines — But Caution Ahead?Silver Shines — But Caution Ahead?
- Silver has just hit a fresh all-time high of $51.70, breaking past its 2011 record.
- However, the monthly RSI is racing toward the extreme 85.00 zone, a level that previously marked major tops in 2006, 2008, and 2011.
Momentum remains strong, but history suggests (as shown in the monthly Silver Chart) that when RSI enters this zone, sharp pullbacks tend to follow.
I don't mean, the the rally is over — but it's just a reminder that every time a steep vertical move is often followed by high volatility (volatility might invite pullbacks).

Silver will Make a New All Time HighHello Traders
In This Chart XAGUSD HOURLY Forex Forecast By FOREX PLANET
today XAGUSD analysis 👆
🟢This Chart includes_ (XAGUSD market update)
🟢What is The Next Opportunity on XAGUSD Market
🟢how to Enter to the Valid Entry With Assurance Profit
This CHART is For Trader's that Want to Improve Their Technical Analysis Skills and Their Trading By Understanding How To Analyze The Market Using Multiple Timeframes and Understanding The Bigger Picture on the Charts

#XAGUSD: A Strong Bullish Move, Possible Target at $45?Silver is currently experiencing a correction, but the overall price remains bullish. Analysing the data, we can see a potential price reversal in our area of interest. Following the recent higher high, price is poised to create another record high. We should closely monitor volume and price behaviour. A strong volume signal would indicate a potential bullish move in the future.
Good luck and trade safely.
Like and comment for more!
Team Setupsfx_

Silver Cup &Handle Formation:Potential Breakout Towards $50–$100📊 Silver Technical Outlook (Long-Term View)
Looking at the chart, Silver is forming a **massive cup-and-handle pattern** that has been developing for over a decade. This is one of the strongest bullish continuation patterns in technical analysis.
🔑 Key Takeaways:
1. Support Zone ($40–$42):
* This area is acting as strong support on both weekly and daily timeframes.
* A swing trade from here can easily deliver 18–20% returns.
2. Resistance Breakout ($49–$50):
* If Silver gives a solid weekly/monthly close above its all-time high ($49.7) , it opens the door for a massive rally.
* The upside potential could extend towards $100 (almost 100% gains).
3. Trend Structure:
* Price action shows a steady uptrend since the 2020 lows.
* The blue curve highlights the accumulation-to-breakout phase, signaling strong bullish momentum.
4. Strategy for Traders:
* Short-Term Swing: Look for longs near $40–$42 with targets around $48–$50.
* Long-Term Position: A confirmed breakout above $50 could be held for a much larger move towards $75–$100.
⚠️ Risk Note: Always manage position sizing—false breakouts are possible before the big move.

$50 Silver and $4000 GoldCongratulations, everyone! 🎉
Silver has finally reached our long-term target $50, marking a new historical high. It’s been quite a ride!
From here, in the $50–$56 range, I’d start gradually locking in some profits, carefully and patiently.
In case we get a correction, I’m looking at the $39–$42 zone as a potential retracement area.
The best mid-term scenario would be a healthy consolidation between $45 and $50, followed by another leg higher.
The worst case scenario would be a drop toward $34, which could coincide with a broader stock market correction, considering that 55–60% of silver demand comes from industrial use.
Cheers! 🍻

Silver will Make a New All Time HighHello Traders
In This Chart XAGUSD HOURLY Forex Forecast By FOREX PLANET
today XAGUSD analysis 👆
🟢This Chart includes_ (XAGUSD market update)
🟢What is The Next Opportunity on XAGUSD Market
🟢how to Enter to the Valid Entry With Assurance Profit
This CHART is For Trader's that Want to Improve Their Technical Analysis Skills and Their Trading By Understanding How To Analyze The Market Using Multiple Timeframes and Understanding The Bigger Picture on the Charts

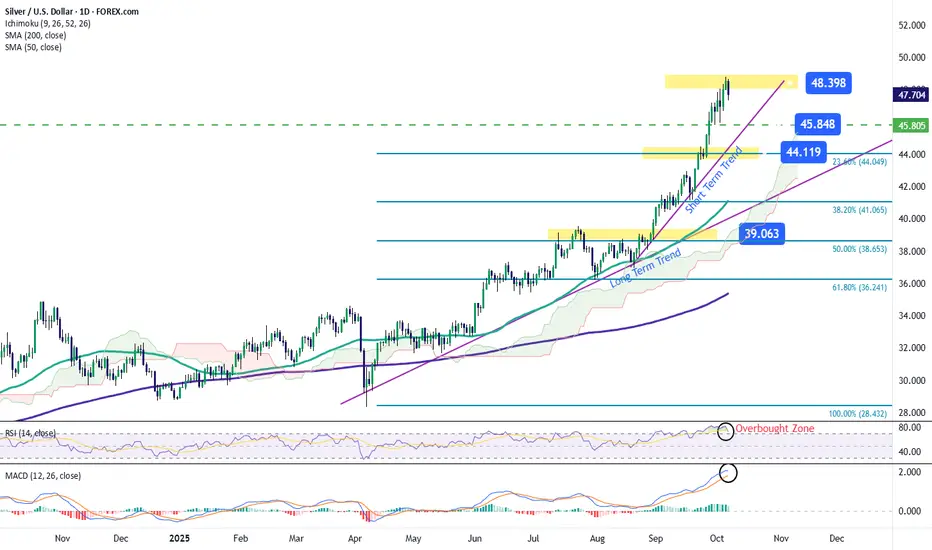
Silver Pulls Back from Recent HighsDuring the current session, silver has started to retreat from its recent highs, posting a decline of more than 2.4% in the short term. This movement has led to a renewed bearish bias in price action, driven mainly by the strengthening of the U.S. dollar. The DXY Index, which measures the dollar’s performance against other major currencies, remains above the 98-point level, reflecting a renewed firmness of the greenback. This strength has reduced investor appetite for precious metals, limiting silver’s upward momentum. If the dollar continues to strengthen, selling pressure on silver could intensify in the coming sessions.
Short-Term Uptrend Remains Intact
Since late August, silver has maintained a pronounced upward trend that remains dominant in the short term. Although some bearish corrections have been observed, they have not yet signaled a structural change in the trend. Therefore, as long as no clear selling signals emerge, the bullish structure continues to be the key pattern to watch at this stage.
RSI
The RSI line continues to hover near the overbought level (70), reflecting an imbalance caused by the recent surge in buying momentum. This could lead to price exhaustion and short-term downward corrections if the overbought condition persists.
MACD
The MACD histogram remains above the zero line, confirming a dominant bullish momentum in recent sessions. However, the MACD and signal lines are beginning to converge, which could foreshadow a bearish crossover and indicate exhaustion in the upward impulse. If this crossover occurs, the market could enter a period of indecision, leaving room for more pronounced pullbacks in the short term.
Key Levels to Watch:
$48 per ounce – Resistance: Corresponds to the recent peak reached by silver. A sustained move above this level could trigger a stronger bullish trend and reinforce a dominant buying bias.
$45 per ounce – Intermediate Resistance: Represents a technical barrier that could limit upside momentum and serve as a potential pivot zone for short-term corrections.
$44 per ounce – Key Support: Aligns with the 23.6% Fibonacci retracement level, acting as the most relevant short-term support. A break below this level could threaten the current bullish trend and shift the outlook toward a more pronounced bearish bias.
Written by Julian Pineda, CFA – Market Analyst
XAGUSD(SILVER):To $60 the silver is new gold, most undervaluedSilver has shown remarkable bullish behaviour and momentum, in contrast to gold’s recent decline. Despite recent news, silver remains bullish and unaffected by these developments. We anticipate that silver will reach a record high by the end of the year, potentially reaching $60.
There are compelling reasons why we believe silver will be more valuable in the coming years, if not months. Firstly, the current price of silver at 36.04 makes it the most cost-effective investment option compared to gold. This presents an attractive opportunity for retail traders, as gold may not be suitable for everyone due to its nature and price.
Silver’s price has increased from 28.47 to 36.25, indicating its potential to reach $60 in the near future. We strongly recommend conducting your own analysis before making any trading or investment decisions. Please note that this analysis is solely our opinion and does not guarantee the price or future prospects of silver.
We appreciate your positive feedback and comments, which encourage us to provide further analysis. Your continuous support over the years means a lot to us.
We wish you a pleasant weekend.
Best regards,
Team Setupsfx
Silver - Eventually new all time highs!🪚Silver ( TVC:SILVER ) might soon break out:
🔎Analysis summary:
If we look at the bigger picture, Silver has been consolidating for the past couple of decades. But with the recent strong rally of about +50%, Silver is once again heading back to the previous all time highs. Despite a potential short term correction, Silver remains totally bullish though.
📝Levels to watch:
$42, $34
SwingTraderPhil
SwingTrading.Simplified. | Investing.Simplified. | #LONGTERMVISION

Silver Price: October Kicks Off with a 14-Year HighSilver Price: October Kicks Off with a 14-Year High
As the XAG/USD chart shows, today silver prices climbed above the $47.50 per ounce mark for the first time since 2011. Since the beginning of the month, silver has appreciated by approximately 15%.
Why is silver rising?
According to media reports, demand for so-called safe-haven assets has intensified amid the US government shutdown, which officially began on 1 October. President Trump has placed the blame on Democrats, while maintaining optimism that the shutdown could be leveraged to streamline the work of federal agencies.
Trading Economics further highlights that the Silver Institute forecasts a deficit in the global silver market. Production is expected at 844 million ounces – around 100 million ounces short of demand, which continues to be driven by the expansion of solar energy, consumer electronics, and data centres.
Technical analysis of the XAG/USD chart
On 22 September, when analysing the XAG/USD chart, we:
→ Drew a long-term upward blue channel, along with a steeper orange channel indicating accelerated growth.
→ Noted that the silver price had broken above the upper boundary of the blue channel and suggested that XAG/USD was in a vulnerable position for a potential correction.
Shortly thereafter (as shown by the red arrow), the price encountered resistance. However, it was insufficient to trigger a pullback, as the upper boundary of the blue channel acted as support (S), allowing silver to continue its ascent within the orange channel.
Yesterday, when reviewing the gold chart, we noted a sharp decline in precious metals at the start of Monday’s session. Although bulls managed to recover during the US session (signalling robust demand), bears remain present – underscored by today’s failure to hold above Monday’s high (marked by the black arrow).
Applying any oscillator (such as RSI) will likely reveal signs of bearish divergence, pointing to a weakening bullish momentum.
Taking the above into account, we could assume that:
→ The market remains bullish. While demand forces may be losing steam, the momentum of the rally could continue to play a significant role.
→ A correction is possible – for example, towards the lower boundary of the orange channel (S2), which is reinforced by a bullish FVG (an imbalance zone favouring buyers).
This article represents the opinion of the Companies operating under the FXOpen brand only. It is not to be construed as an offer, solicitation, or recommendation with respect to products and services provided by the Companies operating under the FXOpen brand, nor is it to be considered financial advice.

Silver Rally Faces Profit-Taking PressureSilver has staged a strong rally throughout September, pushing prices into overbought territory across the daily, weekly, and monthly charts. As the month comes to a close, the market is showing signs of exhaustion, with traders likely to engage in profit-taking, a pattern often seen after extended bullish runs.
The key resistance remains at USD 47.50, a level that has capped upside momentum in the past. Failure to decisively break and hold above this zone could pave the way for a corrective retracement. A natural pullback toward USD 42.00 appears likely, as this level previously acted as a strong technical pivot and now serves as the next major support.
Other factors are adding to the case for near-term weakness:
- Strong U.S. dollar performance is creating headwinds for precious metals, limiting further upside in Silver.
- Bond yields ticking higher reduce the appeal of non-yielding assets like Silver, especially after an extended rally.
- From a technical perspective, momentum oscillators show overbought readings, reinforcing the risk of a corrective move.
- Seasonally, the end of the month and quarter often brings portfolio rebalancing and profit-taking, which could accelerate downside moves.
While the long-term trend for Silver remains constructive, traders should be cautious in the short term. Unless Silver breaks above USD 47.00 with conviction, a deeper retracement toward USD 42.00 or even lower levels cannot be ruled out.

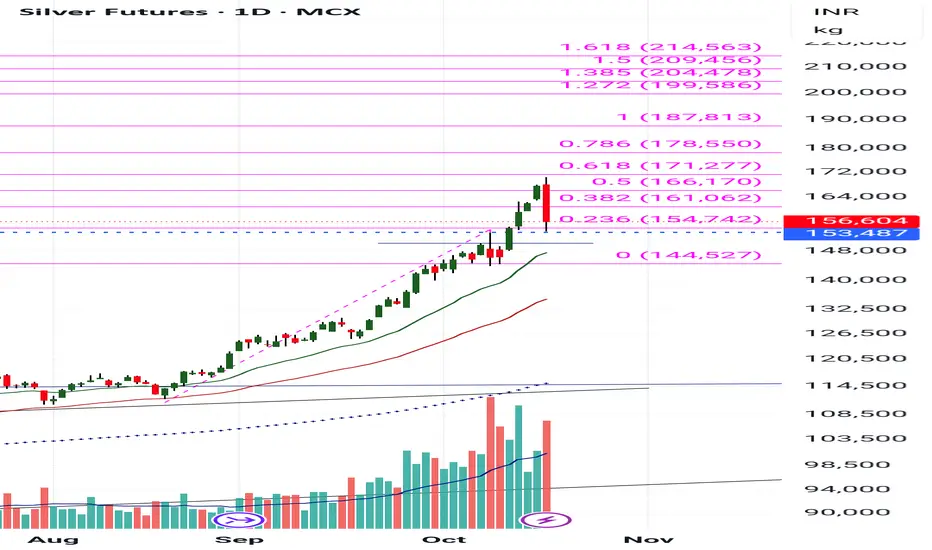
Buy Silver ETF @91Buy SILVER in all dips
Can be Multibagger!!
Target1 - 101
Target2 - 118
Target3 - 150
Disclaimer :-
I am not SEBI registered. The information provided here is for education purposes only.
I will not be responsible for any of your profit/loss with this channel suggestions.
Consult your financial advisor before taking any decisions

Potential long for XAGUSD/SilverLooking for a new potential entry for silver. Silver is really bullish, and im looking to buy and ride the price up to potential new ATH

Silver will Make a New All Time HighHello Traders
In This Chart XAGUSD HOURLY Forex Forecast By FOREX PLANET
today XAGUSD analysis 👆
🟢This Chart includes_ (XAGUSD market update)
🟢What is The Next Opportunity on XAGUSD Market
🟢how to Enter to the Valid Entry With Assurance Profit
This CHART is For Trader's that Want to Improve Their Technical Analysis Skills and Their Trading By Understanding How To Analyze The Market Using Multiple Timeframes and Understanding The Bigger Picture on the Charts
