Silver Futures (COMEX) – Bullish Structure with Pullback & UpsidSilver Futures on the 1H timeframe are maintaining a strong bullish market structure. Price has respected the ascending trendline and reacted well from the support zone, forming a rounded accumulation before the impulsive upside move. After hitting the resistance zone, the market showed a healthy pullback and created a BOS (Break of Structure), confirming buyers are still in control.
Currently, price is consolidating above the last low, which acts as a key demand area. As long as this level holds, the bias remains bullish. Short-term volatility and minor pullbacks are expected, but the overall structure favors a continuation towards higher highs and a potential breakout above resistance.
Silverfutures

Silver Weekly TimeFrame Analysis 01/02/2021as we can see we have few resistance areas and a heavy zone before reaching our Fibonacci projection parallel leg levels and we have specified it as our TP areas
if the price continue its rally in the specified Chanel the Arrows so does the date for our TP occur ON time as we have specified them by Fibonacci time Zones
i believe this commodity is under valued so we have some chance to purchase it and invest on it
it has a long term horizon yet worth of thinking abut it
please comment your opinon

Silver pump vs the Algo - Who will win?COMEX:SI1! COMEX_MINI:SIL1! TVC:SILVER
The algorithm has reached a terminal exhaustion state at the 4.0 Standard Deviation Macro-Extension effectively completing the parabolic expansion cycle initiated from the 2024 lows.
The current price action represents a 'Distribution Node' at the 60.00 psychological event horizon where the Smart Money is actively offloading inventory into late retail buyers before initiating a high-velocity repricing event to the 54.020 algorithmic equilibrium.
Entry: 58.850 (Market Execution / Sell Limit)
Stop loss: 60.150 (1.300 points)
Take profit: 54.020 (4.830 points)
Risk to reward ratio: 3.71R
The Opportunity
The Monthly chart reveals the absolute truth: Price has struck the 4.0 Standard Deviation projection. In the realm of IPDA, this is the 'Statistical Extremity'—a zone where the probability of continued vertical expansion collapses to near zero and the probability of a mean reversion increases exponentially.
The market has left a massive 'Liquidity Void' between 54.00 and 58.00. This is not structural support; it is thin air. The algorithm abhors this vacuum. The 54.020 level identified is not merely a support level; it is the 'Fair Value' origin of the final impulse leg. The market must return here to close the circuit and validate the breakout.
The Entry
Entering short at the 58.850 region capitalizes on the 'bull trap' formed by the failure to displace above 59.50. The 8-hour chart shows a loss of momentum and the formation of a 'Rounded Top' distribution profile.
The algorithm is currently holding price up solely to induce 'Fear of Missing Out' (FOMO) longs. Once the Asian/London liquidity is swept, the floor will be removed, and the price will seek the path of least resistance: down through the vacuum.
The Invalidation
The bearish causal chain is ontologically corrupted if price achieves a daily close above the 60.150 Omega Point.
A breach of this level would imply that the market has entered a 'Hyper-Inflationary' discovery mode, ignoring standard deviation constraints.
This would shift the probability manifold to the Primary Antithetical Chain targeting the 62.00-65.00 vector.
Key Trajectory Waypoints
Target 1: 57.200 | Type: Immediate Structural Low | Probability: 85% | ETA: 24-48 Hours
Target 2: 55.500 | Type: 1.5 SD / Mid-Void | Probability: 70% | ETA: End of Week
Target 3: 54.020 | Type: The Great Rebalance | Probability: 55% | ETA: 1-2 Weeks
The Shadow Reality
A 20% probability exists for the antithetical reality: The Flag Continuation.
In this scenario, the 58.00 level acts as a 'High Tight Flag' support, and the market consolidates sideways to burn time before one final thrust to 61.00.
This reality is confirmed if price refuses to trade below 57.80 for 48 hours.

Silver Market Update Easy Breakdown!Silver’s been showing some strong moves lately ⚡ but it’s at a key decision point right now.
Here’s what I’m watching:
📉 If silver drops below 51.2, we could see a pullback toward 49.30–49.00 before the next push higher.
📈 For silver to reach the next big highs around $70, it needs to break above 52.60 first.
If that happens, the next targets are 54.60 and 57.00.
💡 So short-term dips? Totally normal.
Long-term silver still looks strong if it can clear those resistance levels.
Want to see how I’m reading these moves and what I’m watching next before it happens?
💬 DM me “SILVER” and I’ll share my private breakdown and targets directly.
Mindbloome Exchange
Trade Smarter Live Better

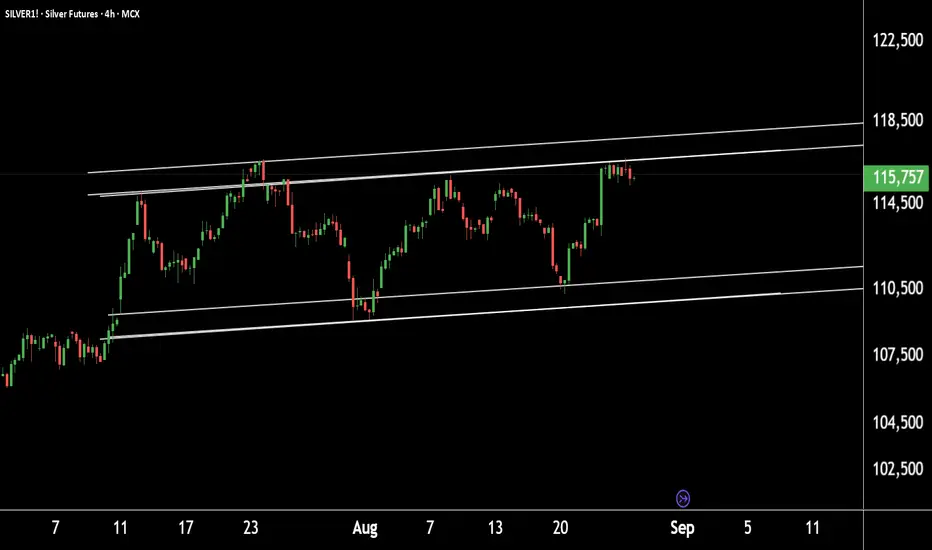
SILVER1! at resistance zone – confirmation before entryDaily Chart Update: SILVER1!
SILVER1! is currently sustaining near its resistance zone at 116000–117700.
If the resistance holds, we may see lower prices ahead.
However, if this level is breached, SILVER1! has the potential to move towards 120000.
Thank you !!
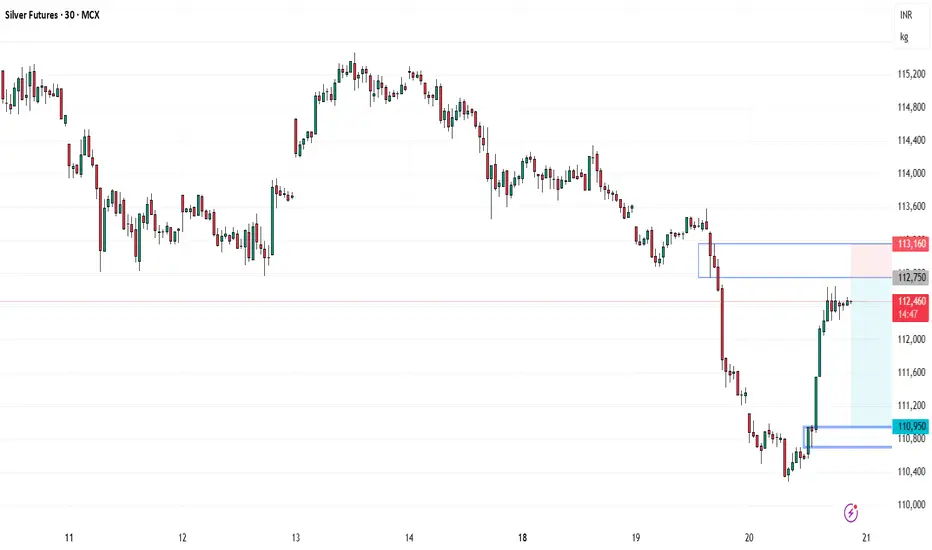
Silver FUT short setupSilver FUT short setup
Entry - 112750
Stop loss - 113160
Target - 110950
Risk Reward - 1:4.39
SILVER BUY BUY BUY...TARGET 40Silver price rose to multiyear high today morning at $36.35/oz as the price finally closed above its key resistance of 35.05-35.45. Price is in a strong bullish trend to target the upper trendline of yellow ascending channel at 36.75 which will act as temporary resistance and may trigger a pull back towards 35.50 region before bouncing back.
Stability above 35.05-35.45 will send price soaring towards 37.50 followed by 40.00-41.00 region.
Break below 35.05 will trigger correction towards 33.60-34.20 area.
On medium term basis Silver's bullish trend will remain valid till the price is stable above 33.60. Break and stability below 33.60 will send the price towards 32.70, 31.80 and 29.20 levels.

XAG/USD "The Silver" Metal Market Bearish Heist Plan🌟Hi! Hola! Ola! Bonjour! Hallo! Marhaba!🌟
Dear Money Makers & Robbers, 🤑💰🐱👤🐱🏍
Based on 🔥Thief Trading style technical and fundamental analysis🔥, here is our master plan to heist the XAG/USD "The Silver" Metal Market. Please adhere to the strategy I've outlined in the chart, which emphasizes short entry. Our aim is the high-risk Green Zone. Risky level, oversold market, consolidation, trend reversal, trap at the level where traders and bullish thieves are getting stronger. 🏆💸Book Profits Be wealthy and safe trade.💪🏆🎉
Entry 📈 : "The heist is on! Wait for the breakout (32.0000) then make your move - Bearish profits await!"
however I advise placing Sell Stop Orders below the breakout MA or Place Sell limit orders within a 15 or 30 minute timeframe. Entry from the most recent or closest low or high level should be in retest.
I Highly recommended you to put alert in your chart.
Stop Loss 🛑: Thief SL placed at 32.8000 (swing Trade Basis) Using the 2H period, the recent / swing high or low level.
SL is based on your risk of the trade, lot size and how many multiple orders you have to take.
Target 🎯: 31.2000 (or) Escape Before the Target
Scalpers, take note 👀 : only scalp on the Short side. If you have a lot of money, you can go straight away; if not, you can join swing traders and carry out the robbery plan. Use trailing SL to safeguard your money 💰.
📰🗞️Fundamental, Macro, COT, Sentimental Outlook:
XAG/USD "The Silver" Metal Market is currently experiencing a Neutral trend., driven by several key factors.
🔱Fundamental Analysis
Fundamental factors driving XAG/USD include supply-demand dynamics, industrial usage, and monetary policy.
Interest Rates:
U.S. Federal Reserve: Rates likely at 3-3.5% in Feb 2025, with cuts from 2024 highs (4.5-5%). Lower real yields support silver, though a strong USD caps gains.
Impact: Neutral to mildly bullish for silver as yields decline.
Inflation:
U.S.: Inflation at ~2.5-3%, above the Fed’s 2% target, driving safe-haven and inflation-hedge demand for silver.
Impact: Bullish, though tempered by industrial demand sensitivity.
Industrial Demand:
Silver’s use in solar panels, electronics, and EVs remains strong. Global green energy push (e.g., U.S. infrastructure spending) boosts demand.
Supply: Mining output stable, but disruptions (e.g., Peru strikes) could tighten supply.
Impact: Strongly bullish if industrial growth persists.
Geopolitical Factors:
U.S.-China trade tensions and Trump’s 2025 tariff policies may enhance silver’s safe-haven appeal while boosting Japan/EM currencies, indirectly pressuring USD.
Impact: Mildly bullish.
Gold Correlation:
XAU/USD (gold) often leads XAG/USD. If gold holds above $2600, silver benefits from spillover demand.
Impact: Bullish if gold trends higher.
🔱Macroeconomic Factors
Broader macro trends influencing XAG/USD:
USD Strength: A strong USD (DXY ~100-102) pressures silver, but Fed easing could weaken it to 98-99, supporting XAG/USD.
Global Growth: Projected at 3% for 2025 (per Morgan Stanley), with U.S./China slowdowns offset by India/EU recovery. Industrial metals like silver benefit.
Commodity Prices: Stable oil (~$70/barrel) and copper prices support industrial metals, indirectly lifting silver.
Risk Sentiment: Risk-off flows (e.g., U.S. recession fears) favor silver as a hybrid safe-haven/industrial asset.
🔱Commitments of Traders (COT) Data
Large Speculators: Net long silver contracts at ~50,000 (down from 70,000 in 2024), suggesting reduced bullish bets but no major unwind.
Commercial Hedgers: Net short ~60,000 contracts, hedging production, indicating steady supply expectations.
Open Interest: ~120,000 contracts, rising slightly, implying growing market interest.
Key Insight: Speculative longs cooling off, but no bearish capitulation—supports range-bound or mildly bullish moves.
🔱Market Sentiment Analysis
Sentiment reflects trader psychology:
Retail Sentiment: Assume 60% of retail traders are long XAG/USD (per broker data), with shorts at 32.5000. Contrarian signals hint at downside risk if longs unwind.
Social Media: Mixed sentiment—bullish posts on industrial demand vs. bearish takes on USD strength.
Broker Data: IG Client Sentiment might show 55% long, suggesting mild overcrowding and potential pullback risk.
🔱Positioning Analysis
Combines COT and sentiment:
Speculative Positioning: Net longs suggest cautious optimism, targeting 33.0000-34.0000.
Retail Crowding: Longs clustered at 32.5000-32.7000, risking a stop-loss flush if price dips.
Institutional Flows: Hedge funds likely balanced, with longs eyeing industrial catalysts and shorts betting on USD resilience.
🔱Next Trend Move Outlook
Technical View: At 32.4000, XAG/USD is near its 50-day SMA (32.3000) and below the 200-day SMA (31.9000), indicating consolidation. Support at 31.8500 (38.2% Fibonacci from 26.50-34.87), resistance at 33.0000.
Short-Term (1-2 Weeks): Range-bound between 31.8500-33.0000 unless Fed rhetoric or industrial data shifts sentiment.
Medium-Term (1-3 Months): Upside to 34.0000 if USD weakens or industrial demand spikes; downside to 30.5000 on risk-off/USD strength.
Triggers: Bullish—strong U.S. PPI data or gold rally; Bearish—hawkish Fed or China slowdown.
🔱Overall Summary Outlook
XAG/USD at 32.4000 reflects a balanced outlook. Fundamentals favor upside from industrial demand and inflation hedging, tempered by USD strength and Fed policy uncertainty. Macro trends support silver via global growth and commodity stability, though risk-off shifts could weigh. COT data shows cautious speculation, while sentiment and positioning hint at short-term choppiness. The next move likely stays range-bound (31.8500-33.0000) short-term, with a medium-term bias toward 34.0000 if bullish catalysts emerge. Watch Fed statements, USD moves, and industrial data for direction.
⚠️Trading Alert : News Releases and Position Management 📰 🗞️ 🚫🚏
As a reminder, news releases can have a significant impact on market prices and volatility. To minimize potential losses and protect your running positions,
we recommend the following:
Avoid taking new trades during news releases
Use trailing stop-loss orders to protect your running positions and lock in profits
💖Supporting our robbery plan will enable us to effortlessly make and steal money 💰💵 Tell your friends, Colleagues and family to follow, like, and share. Boost the strength of our robbery team. Every day in this market make money with ease by using the Thief Trading Style.🏆💪🤝❤️🎉🚀
I'll see you soon with another heist plan, so stay tuned 🤑🐱👤🤗🤩

Weekly Forex Forecast: GOLD & SILVER Are Bearish! SELL Them!This forecast is for the week of DEC. 16 - 20th.
Gold and Silver are both bearish, after raiding the buy side liquidity. Silver is "heavier" than GOLD, so it would be my preferred asset to sell! There is support for lower prices, and no real support for higher prices currently.
Seems like a no brainer.
Wait for a pullback to the -FVG and look for a proper sell setup, my friends.
Check the comments section below for updates regarding this analysis throughout the week.
Enjoy!
May profits be upon you.
Leave any questions or comments in the comment section.
I appreciate any feedback from my viewers!
Like and/or subscribe if you want more accurate analysis.
Thank you so much!
Disclaimer:
I do not provide personal investment advice and I am not a qualified licensed investment advisor.
All information found here, including any ideas, opinions, views, predictions, forecasts, commentaries, suggestions, expressed or implied herein, are for informational, entertainment or educational purposes only and should not be construed as personal investment advice. While the information provided is believed to be accurate, it may include errors or inaccuracies.
I will not and cannot be held liable for any actions you take as a result of anything you read here.
Conduct your own due diligence, or consult a licensed financial advisor or broker before making any and all investment decisions. Any investments, trades, speculations, or decisions made on the basis of any information found on this channel, expressed or implied herein, are committed at your own risk, financial or otherwise.

Will Silver Close at the High This Year?In September, we discussed the potential of silver forming a 'Cup & Handle' pattern, similar to what we observed with gold at the end of 2023. We saw how gold performed in 2024.
If the Silver can settle at around here at the end of this year, establishing this formation, we should be able to see the rising trend of the Silver in 2025.
In this tutorial, we will discuss why silver may close higher towards end of the year.
Silver Futures & Options
Ticker: SI
Minimum fluctuation:
0.005 per troy ounce = $25.00
Micro Silver Futures
Ticker: SIL
Minimum fluctuation:
0.005 per troy ounce = $5.00
Disclaimer:
• What presented here is not a recommendation, please consult your licensed broker.
• Our mission is to create lateral thinking skills for every investor and trader, knowing when to take a calculated risk with market uncertainty and a bolder risk when opportunity arises.
CME Real-time Market Data help identify trading set-ups in real-time and express my market views. If you have futures in your trading portfolio, you can check out on CME Group data plans available that suit your trading needs www.tradingview.com

GOLD and Silver Futures OUTLOOK for the week of Oct. 28, 2024Coming into this week we can see both Gold and Silver are trading away from bullish imbalances, also forming SMT's off those imbalances. We also see that both commodities have CISD's coming off the same lows. In my opinion Gold is showing relative strength, given the fact that it has a failure swing at the lows, while the contrary for Silver. My focus will be towards gold being the stronger pair to long in this scenario. Looking forward to a productive week. Bless.


Silver little bleak and weak now, but will shine later and how. Shadow of Silver today is greyish. As if the fading moon after a full moon day. Silver may consolidate between 82 to 78K levels. If 78K is broken by any chance, the threat of it falling to the levels of 65-68K looms large. If it reaches 65 to 68K level by any chance, Silver become a must accumulate commodity. On a long term time frame (14 to 28 months) Silver looks all set to cross 100K mark. If there is some global event that bring uncertainty, Silver can reach 100K sooner. Keep Watching this commodity. It is an accumulate at lower levels.

DAILY FOREX MARKET WATCH: SILVER IS BULLISH!Silver is the market analyzed.
After respecting the W +FVG, a bullish BOS followed.
The D1 shows another +FVG was formed, a bullish indication.
I am looking for the D1 +FVG to be tested before price heads higher. It would be a great POI to
long from.
If you like the video, give a thumbs up and subscribe!
And thanks!
May profits be upon you.
Disclaimer:
I do not provide personal investment advice and I am not a qualified licensed investment advisor.
All information found here, including any ideas, opinions, views, predictions, forecasts, commentaries, suggestions, expressed or implied herein, are for informational, entertainment or educational purposes only and should not be construed as personal investment advice. While the information provided is believed to be accurate, it may include errors or inaccuracies.
I will not and cannot be held liable for any actions you take as a result of anything you read here.
Conduct your own due diligence, or consult a licensed financial advisor or broker before making any and all investment decisions. Any investments, trades, speculations, or decisions made on the basis of any information found on this channel, expressed or implied herein, are committed at your own risk, financial or otherwise.

SILVER (XAGUSD, SIL1!) Daily Bias.... Turning BULLISH!Price has moved as expected, trading through the failed +FVG to the lower more dependable +FVG.
I believe longs will be high probability from here, only when valid signatures by price present themselves.

Silver Approaching ExtensionWe are looking at Silver approaching the extension.
This is a solid area to start looking for SWING SELLS on Silver.
Share your thoughts below.
The Professor

If Support Breaks, Where Does Silver Go?Gold (June) / Silver (May)
Gold, yesterday’s close: Settled at 2348.4, down 14.0
Silver, yesterday’s close: Settled at 28.052, up 0.068
Yesterday’s warm CPI and weak 10-year auction paved the way for a much-needed consolidation day for Gold and Silver. Still, the precious metals complex battled valiantly, exuding bull market trends within the intraday swings. Geopolitical headlines are certainly helping to stave off indiscriminate selling, but we now look to another slate of inflation data via PPI, coupled with an ECB policy decision this morning and a 30-year Bond auction at noon CT.
Silver futures even went as far as setting a new local high after yesterday’s CPI data, but the broad risk-off undertow was just too much. Construction in Silver out above yesterday’s low of 27.64-27.76 and support aligning with Gold’s low of 2340.1-2343.1 should help fuel a bull continuation into the weekend. In the event of further weakness, we have additional levels of significant support highlighted below.
Bias: Bullish/Neutral
Resistance: 2363.7-2364.1**, 2369.4-2371***, 2380.2-2384.5***, 2400**, 2466.5***, 2539.3-2560.1****
Pivot: 2355
Support: 2348.1-2351***, 2340.1-2343.1***, 2334.2-2337.1***, 2321.7-2325.3***, 2315.7**, 2298.7-2299.6***, 2285.7-2286.2***, 2279-2281.8***
Silver (May)
Resistance: 28.15-28.24**, 28.39-28.44**, 28.57-28.66***, 28.71-28.90**, 29.22***, 29.88-30.35***
Pivot: 28.05
Support: 27.84-27.90**, 27.64-27.76***, 27.34-27.51***, 26.93-26.97***, 26.40-26.48***
Check out CME Group real-time data plans available on TradingView here: www.tradingview.com
Disclaimers:
CME Real-time Market Data help identify trading set-ups and express my market views. If you have futures in your trading portfolio, you can check out on CME Group data plans available that suit your trading needs www.tradingview.com
*Trade ideas cited above are for illustration only, as an integral part of a case study to demonstrate the fundamental concepts in risk management under the market scenarios being discussed. They shall not be construed as investment recommendations or advice. Nor are they used to promote any specific products, or services.
Futures trading involves substantial risk of loss and may not be suitable for all investors. Trading advice is based on information taken from trade and statistical services and other sources Blue Line Futures, LLC believes are reliable. We do not guarantee that such information is accurate or complete and it should not be relied upon as such. Trading advice reflects our good faith judgment at a specific time and is subject to change without notice. There is no guarantee that the advice we give will result in profitable trades. All trading decisions will be made by the account holder. Past performance is not necessarily indicative of future results.

Silver Future Silver Future Weekly chart forming Ascending Triangle Pattern waiting for breakout.. it will make new high so buy silverbees to invest buy every dip..

Options Blueprint Series: Iron Condors for Balanced MarketsIntroduction:
In the nuanced world of options trading, the Iron Condor strategy stands out as a sophisticated yet accessible approach, especially suited for markets that exhibit a balanced demeanor. This strategy, belonging to the "Options Blueprint Series," is designed for traders who seek to harness the potential of stable markets. Iron Condors offer a way to generate profit from an underlying asset's lack of significant price movement, making it an ideal choice for periods characterized by low volatility.
Understanding Iron Condors:
An Iron Condor is a non-directional options strategy that aims to profit from a market that moves sideways or remains within a specific range. This strategy involves four different options contracts, specifically two calls and two puts, all with the same expiration date but different strike prices. It combines a bull put spread and a bear call spread to create a profitable zone.
To construct an Iron Condor, a trader sells one out-of-the-money put and buys another put with a lower strike price (forming the bull put spread), while also selling one out-of-the-money call and buying another call with a higher strike price (forming the bear call spread). The essence of this strategy is to collect premium income from the options sold, with the trade being most profitable if the underlying asset's price remains between the middle strike prices of the calls and puts sold.
The Iron Condor is lauded for its ability to generate returns in a stagnant or mildly volatile market, making it a preferred strategy among traders who anticipate little to no significant price movement in the underlying asset. However, it requires precise execution and an understanding of the underlying market conditions to mitigate risk and optimize potential returns.
Market Analysis:
The current financial landscape often presents scenarios where markets exhibit balanced behavior, characterized by low volatility and minor price fluctuations. In such environments, traditional directional trading strategies might not always offer the desired outcomes due to the lack of significant market movements. This is where the Iron Condor strategy shines, serving as an ideal tool for traders aiming to capitalize on market stability.
Balanced markets are typically observed during periods of economic uncertainty or when major market-moving events are anticipated but have yet to occur. Investors' wait-and-see attitude during these times results in a trading range where prices oscillate within a relatively tight band. Utilizing Iron Condors in these scenarios allows traders to define a price range within which they believe the market will remain over the life of the options contracts. Successfully identifying these ranges can lead to profitable trades, as the sold options will expire worthless, allowing the trader to retain the premiums received.
Implementing Iron Condors under such conditions requires a keen understanding of market indicators and trends. Traders must analyze historical volatility, forthcoming economic events, and overall market sentiment to gauge whether the market conditions are conducive to this strategy. This analysis is crucial in setting the strike prices for the options contracts, determining the width of the Condor's wings, and ultimately, the trade's risk-reward profile.
Introduction to Silver Futures:
Silver Futures represent a standard contract for the future delivery of silver, a precious metal with both investment appeal and industrial applications. Trading on the COMEX exchange, these futures provide a crucial tool for hedging against silver price volatility and speculating on future price movements.
Key Features of Silver Futures:
Contract Specifications: A standard Silver Futures contract on the COMEX division of the New York Mercantile Exchange (NYMEX) typically involves 5,000 troy ounces of silver. The price quotation is in U.S. dollars and cents per ounce.
Point Values: Each tick (0.005) movement in the silver price represents a $25 change in the value of the Silver Futures contract. This point value is critical for calculating potential profits and losses in silver trading.
Trading Hours: Silver Futures are traded almost around the clock (23 hours per day) in electronic trading sessions, providing opportunities to react to global economic events as they unfold.
Margin Requirements: Trading Silver Futures requires a margin deposit, a form of collateral to cover the credit risk. The initial margin is set by the exchange and varies with market volatility. The current recommendation set by COMEX is $8,000 per contract.
Options on Silver Futures:
Options on Silver Futures offer traders the right, but not the obligation, to buy (call options) or sell (put options) the futures contract at a specified price before the option expires. These instruments allow for strategies like Iron Condors, providing additional flexibility in managing silver price exposure.
Applying Iron Condors to Silver Futures Options:
Implementing Iron Condors within the realm of Silver Futures Options requires a strategic selection of strike prices that reflect a balanced market's expected trading range. By capitalizing on Silver's historical volatility patterns and current market analysis, traders can construct Iron Condors to optimize their chances of success.
Trade Setup:
Underlying Asset: Silver Futures (Symbol: SI1!)
Market Conditions: Anticipation of a stable to mildly volatile market environment.
Strategy Components:
Sell Put Option: Strike Price $22.50
Buy Put Option: Strike Price $21.95
Sell Call Option: Strike Price $23.85
Buy Call Option: Strike Price $24.30
Net Premium Received: 0.2680 points = $1,340
Maximum Profit: Net Premium Received $1,340 per contract
Maximum Loss: Difference between strike prices minus net premium received = 0.55 / 0.005 x 25 – 1,340 = $1,410 per contract
Trade Rationalization:
This trade setup is designed to profit from a range-bound market, where the price of silver is expected to remain between key support and resistance price levels until the options' expiration. The selected strike prices reflect a balanced view of the silver market, aiming to maximize premium income while limiting risk exposure. The trade's success hinges on silver prices staying within the defined range, allowing all options to expire worthless and the trader to retain the collected premiums.
Trade Management:
Managing risks associated with Iron Condors involves closely monitoring silver prices and being prepared to adjust the strategy in response to significant market movements. This may include rolling out positions to different strike prices or expiration dates, or closing out the position to mitigate losses. Understanding the nuances of Silver Futures and their options is crucial for effective risk management in this strategy.
Risk Management:
Effective risk management is paramount when employing Iron Condors, particularly in the volatile commodities market. The Iron Condor strategy, by design, limits the maximum potential loss to the difference between the strike prices of the inner options minus the net premium received. However, market conditions can change swiftly, leading to potential challenges that necessitate proactive risk management techniques.
Monitoring Market Conditions: Continuous observation of market dynamics is essential. Significant economic announcements, geopolitical events, or changes in supply and demand can impact silver prices drastically. Traders should stay informed and ready to act if the market moves against their position.
Adjusting Positions: In the event of unfavorable market movements, traders may need to adjust their positions. This could involve closing out the position early to cut losses or 'rolling' the strategy to different strike prices or expiration dates to better align with the new market outlook.
Use of Stop-Loss Orders: While not always applicable in options trading, setting conditional orders to exit positions can help limit losses. For Iron Condors, this might mean closing the trade if the potential maximum loss is approached.
Diversification: Employing Iron Condors as part of a broader, diversified trading strategy can help mitigate risks. No single trade should expose the trader to disproportionate risk.
Conclusion:
The Iron Condor strategy offers a prudent approach for traders looking to capitalize on balanced markets, such as those often encountered with Silver Futures and Options. By selling options with strike prices outside the expected range of movement and protecting the position with further out-of-the-money options bought, traders can receive premium income while having a clear understanding of their maximum risk exposure.
This strategy thrives in environments of low to moderate volatility, where the underlying asset—silver, in this case—is expected to fluctuate within a predictable range. The inclusion of Silver Futures and Options in this strategic framework not only illustrates the versatility of Iron Condors but also underscores the importance of comprehensive market analysis and robust risk management practices.
By meticulously crafting their positions, monitoring market conditions, and being prepared to make adjustments as necessary, traders can effectively navigate the complexities of the commodities market, harnessing the potential of Iron Condors to enhance their trading portfolio.
When charting futures, the data provided could be delayed. Traders working with the ticker symbols discussed in this idea may prefer to use CME Group real-time data plan on TradingView: www.tradingview.com This consideration is particularly important for shorter-term traders, whereas it may be less critical for those focused on longer-term trading strategies.
General Disclaimer:
The trade ideas presented herein are solely for illustrative purposes forming a part of a case study intended to demonstrate key principles in risk management within the context of the specific market scenarios discussed. These ideas are not to be interpreted as investment recommendations or financial advice. They do not endorse or promote any specific trading strategies, financial products, or services. The information provided is based on data believed to be reliable; however, its accuracy or completeness cannot be guaranteed. Trading in financial markets involves risks, including the potential loss of principal. Each individual should conduct their own research and consult with professional financial advisors before making any investment decisions. The author or publisher of this content bears no responsibility for any actions taken based on the information provided or for any resultant financial or other losses.


SI1! (Silver Futures) SHORT to $18.50In a few days COMEX:SI1! will probably break down MA 200 on 1W and go down to first $18.50 price target in its long way to $13-$16.
Technically Silver Futures finishes C wave in its big correction move.

Gold up from here! Its gonna be the big oneYou can see very clearly why gold will break into its mew price territory. I used my own method of triangulation that has proven to be fairly accurate up to most of the time. I think that gold will become very expensive and soon become 5000 dollars but not before it bounces off of 3000 first then back up to test ath. 5000 next move take pay. Wave 2 8500 expected march 2023. Like and follow

SILVER, Ascending-Wedge COMPLETED, Determinations and Targets!Hello There!
Welcome to my new analysis about SILVER on several timeframe perspectives. As I pointed out in my previous ideas SILVER is in a more bearish condition with the bonds market being up as well as the DXY being up. These factors already point to a more bearish global term perspective for SILVER. Now a major consideration is the local term as well as there can be a major turning within the local term also and as I recently detected SILVER now completed a major formation as well as several other signs of an substantial reversal to setup and elevate important dynamics that should not be underestimated. Currently there is a massive volatility move to be considered within the upcoming dynamics.
As when looking at my chart, SILVER recently showed up with this determining bearish momentum, this momentum broke out below the lower boundary of the ascending triangle-formation and printed an determining bearish spike towards the downside from where SILVER is now approaching the initial target-zones and is likely to continue with the bearish continuations as there are still several resistances within the area especially determined by the descending-resistance-line. The fact that SILVER now completed the major ascending-wedge-formation and already increased the bearish momentum activated the target-zones at 23.65, 23.25, and 22.85 as they are marked in my chart.
Currently the DXY is setting up a major breakout into higher spheres as I mentioned in recent ideas, this means that such a breakout within the DXY is validating the bearish cause for SILVER. Also net short-positions held by institutionals increased further within the recent times which is also supporting a major drop in the price-action. Within the whole dynamics SILVER now continued with the origins of the ABC-wave-count with the wave A already completed as SILVER broke out below the lower boundary, the wave B is likely to pullback off the upper resistance if they are reached otherwise the wave B could also have a contracted amplitude.
Once the target have been reached further considerations about the price-action need to be made and therefore we are putting SILVER on the watchlist for the upcoming price-action considerations. On the global term there is still a major formational structure developing which could point to an even larger breakout dynamic and volatility momentum once it has been validated.
Thank you for watching my analysis. Support from your side is greatly appreciated.
VP
