Micro Silver Futures Rally Into Supply With Potential Pullback
This is a 2-hour Micro Silver Futures (COMEX) chart** showing price action from mid-December into early January 2026.
Trend context:
Price previously moved higher within an upward channel, indicating a strong bullish phase. That trend later transitioned into range-bound and corrective price action.
Supply zone (upper red band ~79–80)
The chart highlights a clear **supply/resistance area** where price was previously rejected. Current price is again approaching this zone, suggesting selling pressure may re-emerge.
Support zone / 1st target (~71–72)
A well-defined **support zone is marked below current price. This area acted as a reaction base multiple times and is labeled as the **first downside target** if price pulls back.
Lower support / 2nd target (~64–65)
A broader and deeper **demand/support zone** is identified as a **second downside target**, representing a more significant correction level.
Indicator structure:
The blue stepped lines (likely a volatility or channel-based indicator) show price oscillating between upper and lower boundaries, reinforcing the idea of **mean reversion between supply and support**.
* **Overall bias illustrated:**
The chart visually suggests **upside is limited near supply**, with arrows indicating a **potential downward move** toward the first support zone, and possibly the second if momentum weakens further.
In summary, the chart presents a market **testing resistance after a strong advance**, with clearly mapped **support levels below** that may come into play if a pullback occurs.
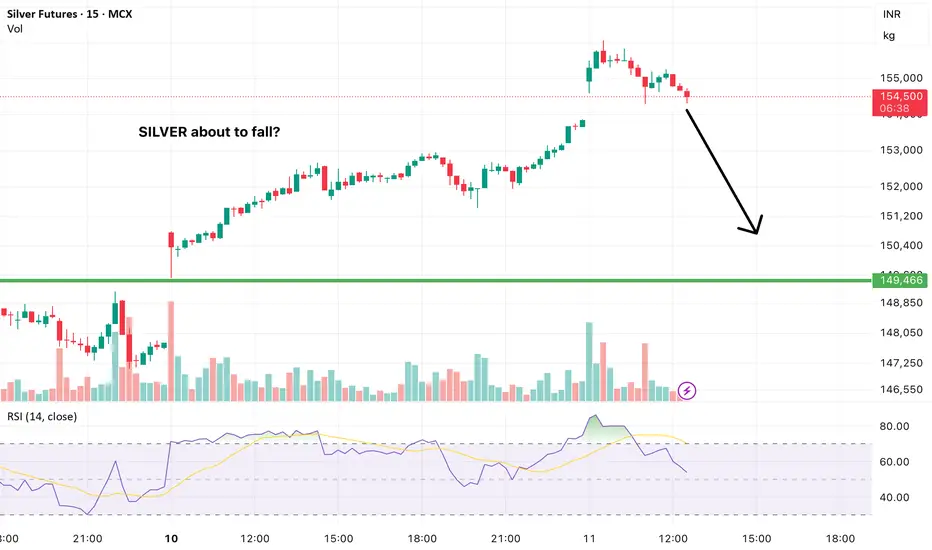
Silvershort

SILVER SHORTING DOUBLE TOPSilver shorting chance.
Top formation (Double top pattern)
Current price : 78.50 USD
Short at : 78 USD
Expected fall : 30%
Use Trailing SL to protect capital and minimize loss.
Rest Idea mentioned on the chart

SilverSilver prices found support around $75, and if they rebound from there, they could potentially reach new highs.
However, they will also encounter resistance around $78 and $81.
If the support level is broken, prices will fall back to between $72 and $69.

Silver Shorting IdeaSilver going to fall like it has done before. Idea shared as Text on the chart itself.
Shorting Idea.


XAG/USD: Price at the Upper Boundary of an Ascending ChannelAnalyzing the XAG/USD chart, we can identify a well-defined ascending channel that contains the broader uptrend originating in early September.
Within this structure, several important technical observations stand out:
The median line of the channel acted as dynamic support and triggered a bullish reaction on December 4.
The line that divides the upper half of the channel into quarters has demonstrated a clear role reversal: it served as resistance earlier in the month and later turned into support around December 10.
The current silver price is trading near the upper boundary of the channel, which may function as a significant resistance level — similar to what was observed in mid-October.
Given these factors, it is reasonable to assume that the market may be extremely overheated, increasing vulnerability to a corrective move. If this scenario unfolds, a bearish break of the steep ascending trajectory cannot be ruled out, especially considering that silver has rallied by approximately 30% from the November 21 low.

Si1! - A "Short" Silver Heads-UpWhat we see on these two charts are two different Andrews Pitchforks.
- same time window
- different time period
- different pitchfork placement
The left chart maps the pendulum swings.
The right chart maps the real swings.
LEFT CHART
The market has almost reached the maximum stretch point, arriving at the U-MLH. A reversal toward the centerline is very likely, as the market tends to seek balance after such an extreme stretch. Classic mean reversion.
RIGHT CHART
Here we see that silver has reached the centerline - the classic 80% target for a pitchfork trader. From here, the market can break/zoom through the centerline, retest it, and continue upward. In the LEFT chart, this would correspond to a larger stretch toward Warning Line 1. Or the market may turn at the centerline because it has found its balance, which in the LEFT chart would confirm the stretch-and-turn scenario.
Either way, caution is warranted. I would at least take partial profits (50% is always good) and treat myself to an enjoyable Christmas party!
Anyone who would like to learn more about pitchforks, please read my bio here on TradingView.
Happy profits to you Silver Arrows §8-)

Silver Rally Stalls: Correction Zone Targets $59.95📉 Silver Analysis — Pullback Setup Active
Silver has completed a strong breakout from a long consolidation box and pushed into the 61.00–61.40 resistance zone, where bullish momentum is now slowing. The chart shows:
Strong rally channel broken on the upside.
Price stalling at resistance, forming an M-top rejection pattern.
Ichimoku cloud below, offering the next major support zone.
Projected drop targets the 59.90–59.95 area, aligning with the cloud support and previous breakout retest.
🔻 Bearish Expectation
If price continues rejecting around 61.00–61.40, Silver is likely to retrace back to the 59.95 support zone.
📌 Key Levels
Resistance: 61.00 – 61.40
Immediate Support: 60.50
Main Target: 59.95
🎯 Bias: Short-Term Bearish
Momentum is cooling, breakout overstretched, and clouds support the pullback scenario.

The AI Boom's Unsung HeroThe rise of artificial intelligence isn’t just shaking up tech companies it’s quietly transforming the global silver market in a big way. As major players like NVIDIA, Google and others ramp up their AI infrastructure silver is becoming more critical than ever. Why? Because silver, thanks to its unmatched electrical conductivity, plays a key role in powering the hardware behind AI.
Silver is the most conductive metal on Earth. That makes it perfect for high-performance computing something AI needs a lot of. It’s especially important in data centers and advanced semiconductors, where both electrical and thermal performance are mission-critical.
What’s really interesting is that AI servers tend to use two to three times more silver than traditional data center servers. That’s because AI workloads are more power-hungry, generate more heat and require more complex cooling and electrical systems. Simply put, more AI means more silver.
If there’s one company at the heart of this trend it’s NVIDIA. Analysts at Morgan Stanley expect NVIDIA to consume a staggering 77% of all silicon wafers used for AI accelerators in 2025 up from 51% in 2024. That adds up to around 535,000 300-mm wafers a year each of which contains silver in key components.
All of this AI growth is showing up in the numbers. Industrial silver demand hit an all-time high of 680.5 million ounces in 2024. The electronics industry alone uses around 250 million ounces per year and AI is now the fastest-growing part of that.
Despite all this demand, silver supply just isn’t keeping up. The market’s been in deficit for four straight years, with a total shortfall of 678 million ounces between 2021 and 2024. That’s roughly ten months of global mine output gone missing from the balance sheet.
It’s no surprise, then, that silver prices have been climbing fast. As of July 2025 silver’s up nearly 30% for the year. Looking further ahead I see room for silver to keep climbing:
In the short term (2025): $36–$42 per ounce seems realistic
By 2026: Potential for $50+ as more AI growth stays strong
AI isn’t just changing how we work, communicate, or compute—it’s literally reshaping the commodities that make this technology possible. Silver, once thought of mainly in the context of jewelry or coins, is now a backbone material for the AI revolution.

Silver: A Sell Signal?COMEX: Micro Silver Futures ( COMEX_MINI:SIL1! )
What happened to the silver market? A previous all-time-high (ATH) record of $49.95 per ounce was set on January 17, 1980, and stood for 45 years until silver broke $50 in October 2025. Since then, silver prices kept climbing nonstop and setting new ATH records almost daily. Last Friday, November 28th, silver reached $56.86.
COMEX Silver Futures ( AMEX:SIL ) locked in an impressive 98% return year-to-date, which makes silver the top performer across all major asset classes year to date.
The strength of silver is supported by a confluence of factors including inflows into bullion-backed ETFs and expectations of a potential Federal Reserve interest rate cut. Investors rotated assets out of stock amid recent market weaknesses, benefiting the safe-haven assets gold and silver. In addition, gold purchases have slowed in recent months due to the record high prices. Some investors may choose silver as an alternative hedging asset.
However, a key metric suggests that the tide is about to change.
A Refresher:
In my writing published on April 28th, I introduced the Gold-Silver Ratio, a financial term that measures the relative value of gold to silver. The Gold-Silver Ratio may be used as a buying or selling signal.
When to Buy Silver : A high Ratio, typically above the 95:1 mark, suggests that silver is undervalued relative to gold. This is often interpreted as a buying signal for silver.
• Recalling that in the April 28th writing, we explored the idea of buying silver at $33 when the Ratio stood at 100. Silver prices went up 72% since then.
When to Sell Silver : When the Ratio is low, say around 80:1, it indicates that silver is relatively expensive. Investors might consider selling silver and buying gold.
• As silver caught up with gold with its recent rally, the Ratio is declining all the way down to 74. This is a level indicating silver is very expensive relative to gold. From a mean-reversing point of view, the Ratio may rebound back to the 80-90 range soon.
In my opinion, gold could show more strength compared to silver in the new year.
• Global central banks have slowed gold purchases recently. Gold getting expensive did not cause the pause. Annual budget depleting may be a more plausible reason. A new year comes with new budget, and I expect central bank buying to resume in 2026.
• Silver is part precious metal and part industrial metal. Global GDP in 2026 is projected to slow to 2.9% to 3.1%, with downside risks from geopolitical tensions and trade policy uncertainty, according to the IMF. Industrial use of silver could slow as well.
• Expectations of Fed rate cuts are rising. The stock market could rally again, causing investors to rotate money out of safe-haven assets. In my opinion, gold could stand its ground better than silver, with central bank purchases serving as a key support. In this scenario, the Ratio rises because silver falling faster than gold.
Trade Setup with Micro Silver
Traders could apply the insights from the Gold-Silver Ratio with trading strategies using COMEX Micro Silver Futures ( AMEX:SIL ). There are a number of reasons why shorting silver makes sense:
• Traders expect mean-reversion of the Gold-Silver Ratio will occur soon.
• Investors expect Fed rate cuts to be bullish for stocks and bearish for precious metals.
• Traders with portfolio of spot silver or silver ETF want to hedge their positions.
The big advantages of using futures contracts are capital efficiency and leverage. Micro Silver contracts have a notional value of 1,000 troy ounces of silver. With Friday settlement price of $57.455, each January contract (SILF6) has a notional value of $57,455. Buying or selling one contract requires an initial margin of $4,000 at the time of writing. This suggests a built-in leverage of 14.4 (= 57455/4000) for futures contracts.
By putting a deposit equivalent to 70 ounces, traders could gain the full exposure of 1,000 ounces of silver. If silver prices move down by 10%, a short position in Micro Silver futures would gain 144% (= (57455*0.1) / 4000).
Micro silver futures (SIL, 1000 oz) and standard-size silver futures contracts (SI, 5000 oz) contracts together form a deep liquidity pool. On November 28th, SI had trade volume of 109,967 contracts and an open interest (OI) of 155,222 contracts. SIL had volume and OI of 79,015 and 14,900 contracts, respectively, according to data from CME Group.
To hedge the risk of rising silver prices, a trader could set a stoploss on his short-silver order. For illustration, a short order is executed at 57.455 with a stoploss at 59.0. If silver goes up 10% to $63.2, the maximum loss will be $1,545 (= (59-57.455)*1000), well within the margin account balance of $4,000.
Happy Trading.
Disclaimers
*Trade ideas cited above are for illustration only, as an integral part of a case study to demonstrate the fundamental concepts in risk management under the market scenarios being discussed. They shall not be construed as investment recommendations or advice. Nor are they used to promote any specific products, or services.
CME Real-time Market Data help identify trading set-ups and express my market views. If you have futures in your trading portfolio, you can check out on CME Group data plans available that suit your trading needs www.tradingview.com

SilverXAGUSD
- Bullish Channel as an corrective pattern in Long Time Frame
- Change of Characteristics
- Break of Structure
- Completed " 12345 " Impulsive Waves
- Demand Zone

Silver (XAGUSD) — Breakdown Setup After Double TopSilver has printed a clear Double Top at a major resistance zone, showing signs of trend exhaustion after a strong bullish rally. Recent structure and momentum signals now point toward a potential deeper correction.
🔹 Key Bearish Signals
Double Top at major resistance
Shift from Higher High (HH) to Lower High (LH)
Bearish RSI divergence on 1D and 4H
Multiple rejections at the same resistance level
Support zone has been tested several times → increasing breakdown probability
🔻 Trade Plan
Sell Stop below the support zone
SL: Above recent LH
TP: Next major demand area (clean downside structure)
🎯 Why This Setup Matters
Double Top + LH confirms early trend reversal
RSI divergence reinforces weakening momentum
1D and 4H confluence adds confidence
A support break could trigger a sharp move down with strong R:R potential

#XAGUSD(SILVER):Is Bull Run Over? Major Correction On the Way? Dear Traders,
Silver has experienced a significant decline since the DXY began to recover. The price is likely to continue falling and we believe this may be the commencement of a major decline. We anticipate a smooth drop based on previous price reactions.
**Potential Entry Zone:**
- Enter when the price reaches the FVG area marked with a white box. The initial take profit can be set at $45 and the swing trade at $40.
**Support:**
- We would appreciate your support by liking and commenting on our ideas which will encourage us to post more in the future.
Team Setupsfx

SILVER forming dangerous chart pattern today. Can fall from hereSilver forming negative or weka pattern on 15 minute charts which is indicating pressure from higher levels.
Can fall from here as per this chart pattern
Share this with your friends who trade in Commodities.
This is not an investment advice.
Silver - The catastrophic rejection!🆘Silver ( TVC:SILVER ) is just collapsing:
🔎Analysis summary:
At this exact moment, Silver is retesting the previous all time highs, which were already rejected about 45 years ago. Considering the extremely bearish rejection on the smaller timeframes, Silver simply fails to break out. This will lead to a devastating reversal.
📝Levels to watch:
$50
SwingTraderPhil
SwingTrading.Simplified. | Investing.Simplified. | #LONGTERMVISION

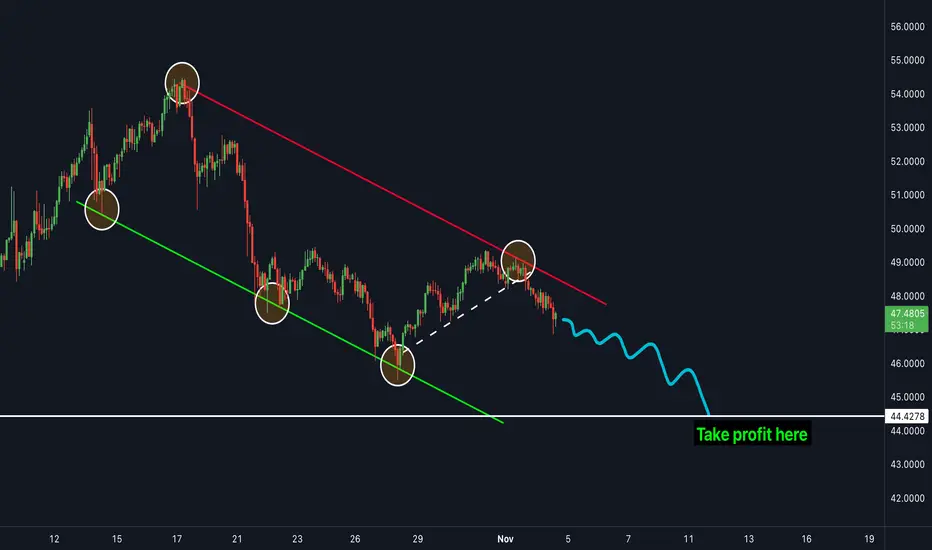
SILVER is ready to drop more - SELL NOW!Silver has been in a clear downtrend for the last few weeks and has struggled to move to the upside. The price is currently in between a bearish channel and is bouncing in-between both resistance and support zones. The price broke the most recent trendline (shown in white) which acted as a support zone. The next target is the white line shown on the chart as "take profit". This is the next major support zone which the price is very likely to hit next.
Short in silverAs you can see there is shorting opportunity in silver as well as gold so what is your view on this??????

SilverXAGUSD
- Completed " 12345 " Impulsive Waves
- Demand Zone
- Fibonacci Level - 50.00% / 61.80%
- RSI - Divergence
- Bullish Channel as an corrective pattern in Short Time Frame

#XAGUSD(SILVER): Price is likely to drop at $41 area. The current trading price of XAGUSD (SILVER) is at an all-time high. This is attributed to global uncertainty and the decline of the US Dollar. However, the lack of significant volume to support this level suggests a potential rapid decline. This decline could facilitate the price reaching a key level of $41.
There are two potential benefits from this drop. Firstly, it would allow for maximisation of trading by selling. Secondly, when the price reaches this level, we can purchase at the discounted price.
We wish you the best of luck and trade safely.
Team Setupsfx_

Sell Silver @47Sell SILVER @47
Silver will face major resistance at 47-48
Target1 - 40
Target2 - 37.8
Buy Silver at 40-37 only/-
Disclaimer :-
I am not SEBI registered. The information provided here is for education purposes only.
I will not be responsible for any of your profit/loss with this channel suggestions.
Consult your financial advisor before taking any decisions.

SI1! - Dancing on the SILVER Tracks🔱 I like risk. Specially when it's skewed to my favor 🔱
WL1 has been reached, and the market is wildly overextended.
Is it crazy to stand in front of this speeding train?
Absolutely — if you don’t know when to jump.
I’ve done my warm-up, and I’m ready to leap off the rails the moment it gets too close, too fast.
My move is with options — that means my risk is defined, my escape route mapped.
I would never short the underlying — not in a million years.
Now let’s see if this setup earns me that Steak & Lobster target.

Silver Shines — But Caution Ahead?Silver Shines — But Caution Ahead?
- Silver has just hit a fresh all-time high of $51.70, breaking past its 2011 record.
- However, the monthly RSI is racing toward the extreme 85.00 zone, a level that previously marked major tops in 2006, 2008, and 2011.
Momentum remains strong, but history suggests (as shown in the monthly Silver Chart) that when RSI enters this zone, sharp pullbacks tend to follow.
I don't mean, the the rally is over — but it's just a reminder that every time a steep vertical move is often followed by high volatility (volatility might invite pullbacks).

Tripple Top Silver now Traded at Triple top zone
51/52$ is supply zone.
So if not close weekly above this level
We seen side ways to Correction in silver
5 to 25% down side seen
