Silver- New challenge of 25?After a first leg up from 22 to 25, Silver entered a period of correction/consolidation.
The price is staying above 22.20-22.50 zone support and I expect this support to hold and a new leg up to follow.
Dips towards this support should be bought for a new challenge of 25 resistance
Silvertrade

Silver- My target remains 26Silver also had a drop yesterday and exactly like Gold, stopped in the interim support at 23.50 in its case.
And although at this point the price looks bearish, my long term outlook hasn't changed.
I will remain bullish as long as the price stays above 23 and I expect 26 to be reached in the medium-term
Dips towards this zone should be bought and only a dive under 22 would change my bullish outlook

SILVER (8HR) - Break-out or Fake-out??True to form for a head and shoulders pattern, the first move outside of its recent pattern has been to the downside. This is one to watch, because if there is a retest of the recent support followed by a rejection, there could be a short-term sell trade on the table.


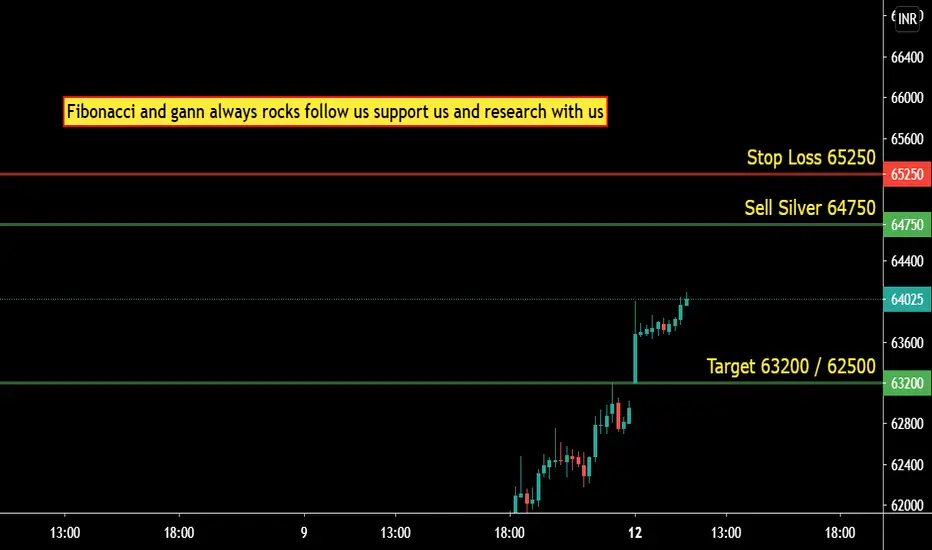
Silver Mini Buy / Sell based on FIBO and GANNSell Silver M 64750 Stop Loss 65250 Target 63200 / 62500
Fibonacci and Gann always rocks follow us support us and research with us
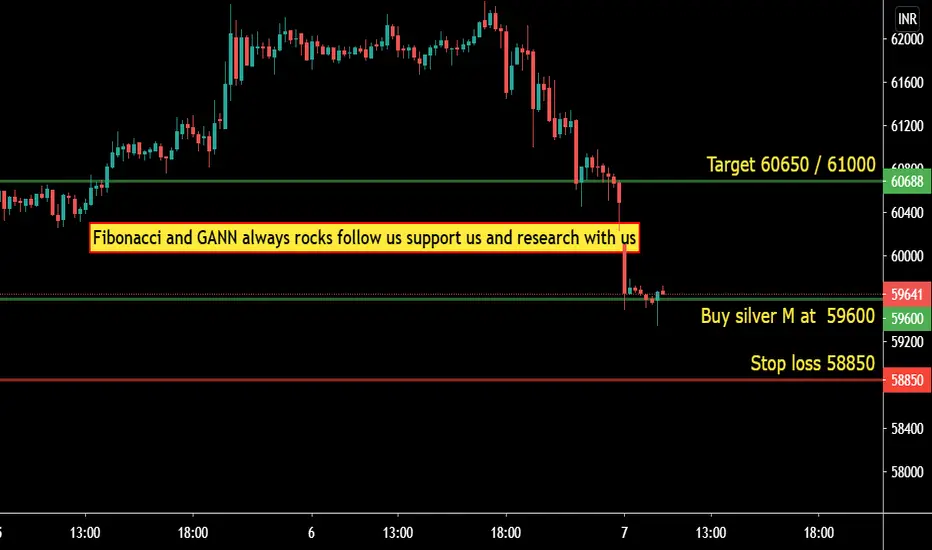
Silver Mini Buy / Sell based on FIBO and GANNBuy at 59600 Stop loss 58850 Target 60650 / 61000
Fibonacci and GANN always rocks follow us support us and research with us
Silver Mini Buy / Sell based on FIBO and GANNBuy silver mini 61050 Stop loss 60700 Target 61880 / 32900
Fibonacci and GANN always rocks follow us support us and research with us

SILVER 1D-TIMEFRAME ANALYSIS 🥈SILVER 1D-TIMEFRAME ANALYSIS
Hello ladies and gentlemen
My idea the SILVER continues to downtrend
Targets
20
19
I hope my idea is clear
Support me by like and share
Good luck

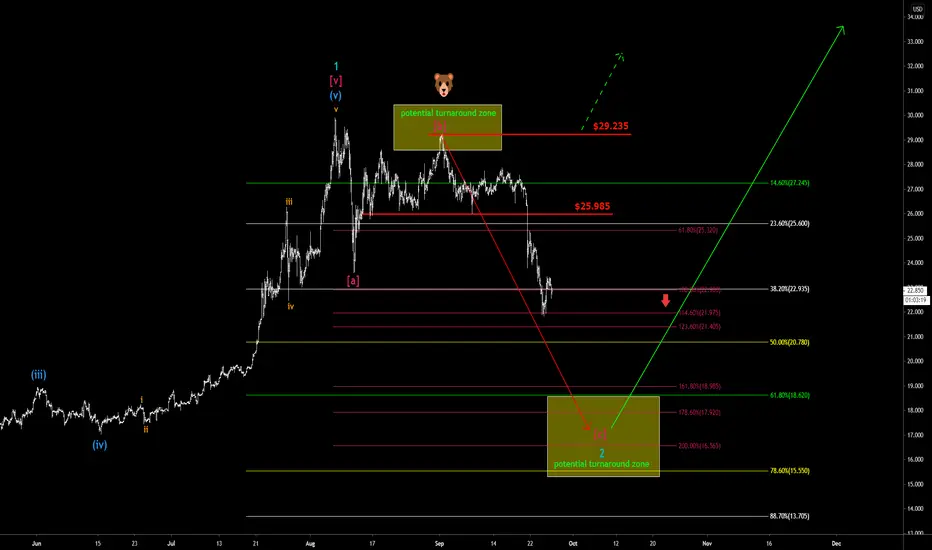
Another 20% for the bears! 🐻
We updated our target for the correction in silver. Due to the breach of the $23 area, we have to expect further downward movement. The new target for a turnaround is between $19 and $15.50. A yellow box indicates the zone. This bigger correction leaves us with more potential to the upside after the current correction. We think that we are now ina major wave 2 in blue. This means that after completing the correction, a bull run to prices over $30 could start.
Share your opinion in the comments! Happy Trading!
Silver M Buy / Sell Based on FIBO / GANNRisky can Buy at CMP 56420 stop loss 55990 Target 58050 / 58640
Sell at 58600 Stop loss 59480 Target 58640 / 58060
which ever entry triggers first then go that side and leave the other view
Fibonacci and Gann always rocks support us follow us and research with us

Silver mini Buy / Sell based on FIBO and GANNBuy at 58530 stop loss 58000 Target 59550 / 60081
Sell at 61080 Stop loss 61450 Target 60081 / 59550
which ever entry triggers first then go that side and leave the other view
Fibonacci and Gann always rocks support us follow us and research with us

You heard it here first! 🥇 - DailyMarketUpdate 📉 Silver is tanking!
After reaching our defined turnaround zone in yellow, the bears take over the market. Just as indicated in our first Silver post (👇🏿 hyperlinked below 👇). The support level at $25.78 is broken, and the downtrend accelerates. The next support to watch out for is at $23.58. At around $23, we expect the next major countermove.
Happy Trading! Feel free to discuss!

SILVER is ready for another BIG BULLISH TRIANGLE breakout!SILVER is ready for another BIG BULLISH TRIANGLE breakout!
That's a big bullish triangle, let's smoke some hopium and pray it breaks up! 65% Chance it breaks up, 35% chance it breaks down.
Trade safe my friends...
TVC:SILVER

SILVER ANALYSIS AND FORECAST FOR NEXT WEEK UNTIL 28th OF AUGUST Please share with me your thoughts,
Regards

XAG/USD: LONG trade setupit is about to turn extremely volatile. but the destiny to take this one uP


SILVER is in a BULLISH FLAG !SILVER is in a BULLISH FLAG !
Extracted two measurements for two possible pole measurements..
TVC:SILVER


Massive Green Engulfing! (SILVER)Green arrow points to where your signal was to go long on silver.
This one was analyzed around mid $14 for a buy entry on a long term move.
The 3day is a beautiful green impulse.
Now we are creating distance from the initial buy, more space = better trade.
No stress with this one as I will hold for a long term hold.
Will update this if I see any key signs for any reversal.
For now, we are solid. ✌😁🥇

Keep Breaking Levels. (SILVER)Current channel proceeding with no slowing down after breaking up for the high highs.
This position is going well. Love this price movement as the candles fire green!
Let's keep it running bulls!
Have an awesome day 😁

