Silverusd

XAGUSD BuyThis one is a bit tricky, scenario still needs more time to clarify the structure. However, short term buy and then wait to see if there will be a new low or keep going up. Only buys on Silver.

XAGUSD: Consolidation before the main move.Silver is consolidating on 1D (RSI = 45.850, Williams = -48.527, CCI = 32.7856, Highs/Lows = 0.000) after finding support at 14.890. The very same pattern has been spotted another 2 times in 2017 and 2018 leading us to assume that the behavior is cyclical. This suggests that the current consolidation has at least 1 more Lower High to give before breaking either towards February's top or December's low. Our TP is 15.470.
** If you like our free content follow our profile (www.tradingview.com) to get more daily ideas. **
Comments and likes are greatly appreciated.

XAGUSD: Bullish formation.Silver is on a 1D Channel Up (RSI = 57.653, MACD = 0.076, Highs/Lows = 0.0566). 4H is also on a bullish Channel (RSI = 57.109, Highs/Lows = 0.0000) but more neutral which offers the necessary support. The pattern behavior is quite clear and as soon as this Channel breaks upwards 16.215 at least will be tested. Our TP is 16.200.
** If you like our free content follow our profile (www.tradingview.com) to get more daily ideas. **
Comments and likes are greatly appreciated.

Silver (SI1!) - 2019 will be the year of the Silver BullsThere is no denying that commodity futures market are on fire with the surge in Gold and Palladium. Silver is riding that train finding a technical bottom Nov 18' at $13.85. Silver has since moved out of the descending channel and tested its all important 61.8 in Feb, getting rejected, but confirming the top of the channel as support.
Silver Bulls are now testing the 618 level again.
Near term resistance zone: 16.80 - 17.39
Support: 15.20-15.60.
Indicators: Silver is not as overbought as Gold and Palladium so I'm expecting a successful push this time above the 618 testing those near term resistance levels.
RSI - 63. Bulls in control of momentum. There is a slight divergence however on RSI so bulls really need to make this next leg up count.
Stochastic - rolling over bullish
DMI - ADX at 20. We prefer to see around 25, however, +DI is trending in a positive direction.
Its nice seeing a resurgence in Silver after being stuck in a descending channel since June 2016. 2019 is expected to be more bullish with industrial demand on the rise for silver as well as more coins being minted as well.
Let's see if silver bulls have it in them over the coming weeks!
Regards,
Bobby

SILVER TRADING PLAN $$$Good evening guys, I hope you are well.
On the week commencing 18th February, along with GOLD I will also be looking at SILVER for a trading opportunity.
The price has jumped marginally off the SUP2 dotted line and the rising trend-line. This confirms a potential uptrend continuation.
I will be looking at RES1 to see if the price breaks above this line or repels.
TP @ RES2 SL @15.6

Silver: Aiming at the next Resistance. Bullish.Silver is close to crossing through its previous High and being on a strong (RSI = 69.203) but stable (MACD = 0.030, Highs/Lows = 0.0739, B/BP = 0.0990) 1D uptrend, it is expected to test the 1W Resistance at 16.200, which is our long TP. After that is will most likely enter into consolidation on a similar candle sequence it traded on during the first 6 months of 2018.
** If you like our free content follow our profile (www.tradingview.com) to get more daily ideas. **
Comments and likes are greatly appreciated.

Silver: Bearish within a 4H Channel Down.Silver has broken through the previous Low into an emerging Channel Down on 4H (RSI = 40.361, MACD = -0.033, Highs/Lows = -0.0364, B/BP = -0.1060). The dashed lines however keep the price for the time being inside a Falling Wedge with 15.600 as the Resistance. If the price breaks the wedge downwards, the immediate target is 15.300. If it pulls higher and then reverses we will set two targets: 15.420 and naturally 15.300.
** If you like our free content follow our profile (www.tradingview.com) to get more daily ideas. **
Comments and likes are greatly appreciated.

Silver: How high can it go?Following Silver's aggressive rise in recent weeks, it is useful to examine how far this rise can extend to. From a technical perspective, Silver has been trading within a descending parabolic channel after its 2011 All Time Highs. In recent years, the channel is following a more distinct Lower High pattern, which as seen on the chart produces 1M Falling Wedges within the parabola (MACD = -0.432) that eventually break the pattern to the upside in order to reach the third in succession Lower High, only to be rejected and form the next Falling Wedge.
We believe a similar candle sequence can be followed (if the Falling Wedge breaks (the dashed line) upwards), which may take the price close to 17.900. The 18.550 - 19.100 zone is the maximum extension within the channel.
** If you like our free content follow our profile (www.tradingview.com) to get more daily ideas. **
Comments and likes are greatly appreciated.

Why Silver's bubble hasn't reached a long term bottom.This is a simple study for investors who want to take a long term position on Silver, making use of Jean-Paul Rodrigue's Stages of a Bubble.
Although the "Fear" and "Capitulation" staged last longer than the theoretical pattern, the similarities are obvious through Silver's Bubble phase. It is also more likely that the "Despair" phase hasn't been entered yet and that the metal will continue to decline in the coming years 3 - 4 years until it starts returning to the "Mean".
** If you like our free content follow our profile (www.tradingview.com) to get more daily ideas. **
Comments and likes are greatly appreciated.

SILVER - BUYSilver is a very important commodity, in fact it is even more useful that Gold. As only about 10% of produced Gold is used in various manufacturing, rest 90% goes for jewelry and just as safe haven, where Silver's 50% goes for manufacturing as an example your touch-screens, solar energy and medical sectors... But I'm not here to predict future of humanity :)
Key things to note before analysis:
- Top countries producing silver are Mexico, China, Peru, Russia, Australia, etc. Take into account their relationships with US, tariffs, their currencies vs USD. AUD/USD for instance, started to rebound already and has a huge way up to go. USD even if strong (as always) may strengthen a bit more, but has to go for correction anytime very soon.
- Commodity market, for ex. Gold have shown reversal. Now Gold is a "Buy on dips" for majority and by far not many want to trade against its Bullish trend.
- Assuming the average production price globally is $11.74 price still can go down, despite already some smaller producers are selling for a cheaper price (as their production cost is around $15). That is ok(ish) because the demand has lowered during last 2 years. But, India (which is major buyer) has increased its demand this year.
- Demand will keep rising for Silver, but producers will definitely not want to increase production. For example Jewelry demand has already risen. "Why would I buy expensive gold jewelry during these crisis times. I want to save. Also silver is useful for health, it kills one-cell bacteria..." ;)
- If commodity currencies rise, commodities prices will rise. Duh?!
Ok, now the chart:
Please pay attention to corrections, how they are broken and movements inside the channels. I have marked with red arrows price action which is less likely to happen and blue arrows show most likely to happen. So, I am expecting the price to test $16 latest by Feb 2019 and reach around $20.30 by April. The buy zone is reached for me and will SL at around key levels. If $13.58 is broken, I will look to start adding more at around $12 So this is a longer term trade. Please comment, share and like.

XAGUSD: Sideways within a Rectangle. Bigger downside. Short.Silver is trading within a 14.500 - 14.800 1D Rectangle (RSI = 52.138, STOCH = 53.739, ADX = 17.520, CCI = 1.5082, Highs/Lows = 0.0000) that is dictating the movement for the better part of the month. However as long as the 14.895 Resistance holds, the downside potential towards the 14.220 Support will be greater. Short TP = 14.265.

Silver 12hr Squeeze + Momentum Divergence Silver is squeezing on the 12hr with momentum currently to the upside, the momentum divergence looks pretty decent too. We do have to watch for a potential rollover and short fire so track the squeeze by getting the Maxx Momentum indicator
To add to this silver is currently in a beautiful weekly short, I am looking for it to roll over. So this is a counter trend trade, but the set up looks good. Trade safe!!

Silver Analysis Welcome Back!
Today I wanted to take a look at silver to find the next area of accumulation.
Taking a look at the monthly, silver has been retracing for the last 5 years and it doesnt look like its quite done yet.
Prices recently broke out of a descending traingle, indicating further bearish continuation.
However, 3 waves are often short lived so the best thing to do is buy support.(Genius I know)
My buy zone is going to be the $8-$10
God Bless,

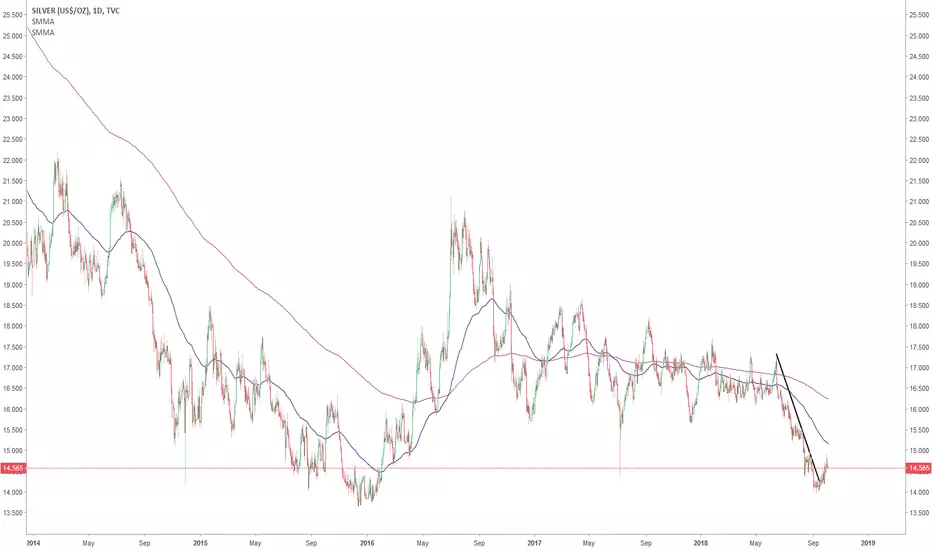
Silver Past & Present Bull Run/Bear Market Analysis. Is RSI Key?This month's observations and discussion points are as follows:
+ Looking at the RSI, 200 MA and candles, it would not be unreasonable to believe there is more down time ahead.
+ Buying when the RSI is oversold on the monthly chart is not a bad good idea (not financial advice) as after the ONLY two previous times, bull runs have followed.
Crunching the Data
Bull Run & Bear Market A vs B
Bull Run A >>> Dec 1971 ~ Jan 1980 (8 years & 1 month) Bear Market A>>> Feb 1980 ~ Feb 1991 (11 years)
Bull Run B>>> Mar 1991 ~ Apr 2011 (20 years & 1 month) Bear Market B>>> May 2011 ~ Sep 2018... (7 years & 4 months...)
Bull Run A>>> $1.39 ~ $38.20 (x27.48) Bear Market A>>> $35.12 ~ $3.62 (-89.70%)
Bull Run B>>> $3.75 ~ $49.71 (x13.26) Bear Market B>>> $48.15 ~ $14.16...(-70.60%...)
Notes: Bull Run A was x2.07 larger in price than Bull Run B.
Notes: Bear Market A has so far decreased 19.10% more than the current Bear Market B.
Final Calculation & Summary
Bull Run A was x2.07 larger than Bull Run B, so it's logical to expect Bear Market A to also be x2.07 longer than Bear Market B.
89.70% / 2.07 = 43.33%
Following this assumption, the current bear market needs to go 43.33% down from Bull Run A's ATH and at this point should become oversold on the monthly RSI and ready to begin a new bull run. It's currently already down 70.60% from the ATH of Bull Run B so I GUESS ALL OF THIS RESEARCH WAS A COLOSSAL WASTE OF TIME! I guess every bull run is different and shouldn't be compared?

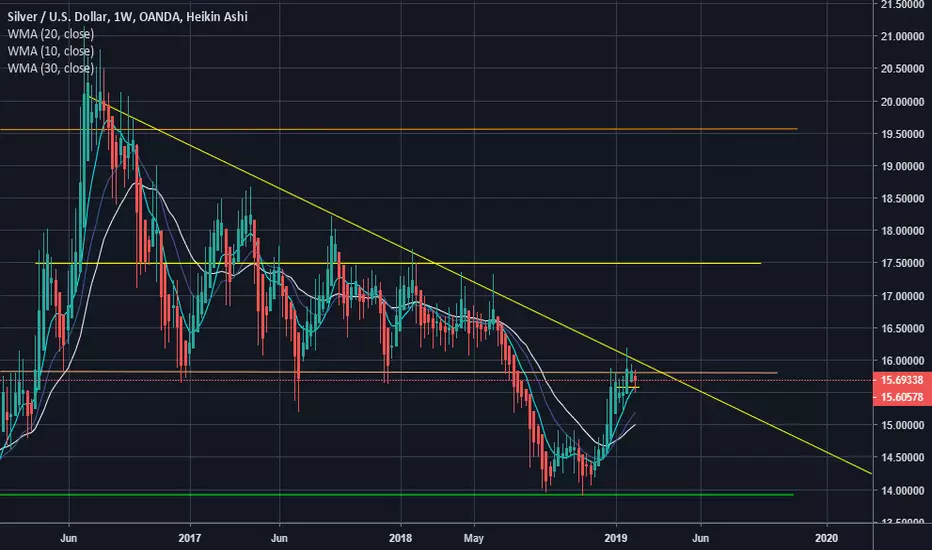
Silver updateThe precious metals show very weak signs. Within only approx 8 Weaks the neutral trend changed to a negative trend and several supports haven been broken since then. Even the long descending trend line has been broken so that we´re now in the older downtrend.
Silver (in $) has reached a swing trend line at ~14.85$ - this could be seen as support. Also it is on the lower limit of the falling trend channel. RSI is about to leave the bearish to the oversold zone, MACD also negative and the singal line has been triggered to the bottom.
IF !! - the swing trend line (orange) holds, then Silver could rise to the upper limit of the mentioned trend channel (~ 15,15$).
Actually the fight around the swing trend line and on the lower limit of the trend channel continues and one cannot say whether the downtrend would be stopped or not.
To give new bullish signs Silver has to leave the trend channel to the top! And above 15.50$ (fib retracement 23.6%) Silver would be back in neutral zone!
Silver BUY can't get any better!!!Rebounded off strong support. Doji formed followed by a bullish candle.
TP1: 16.50
TP2: 20.70
SL: Below the wicks @ 14.00
Good Luck and Trade Safe!

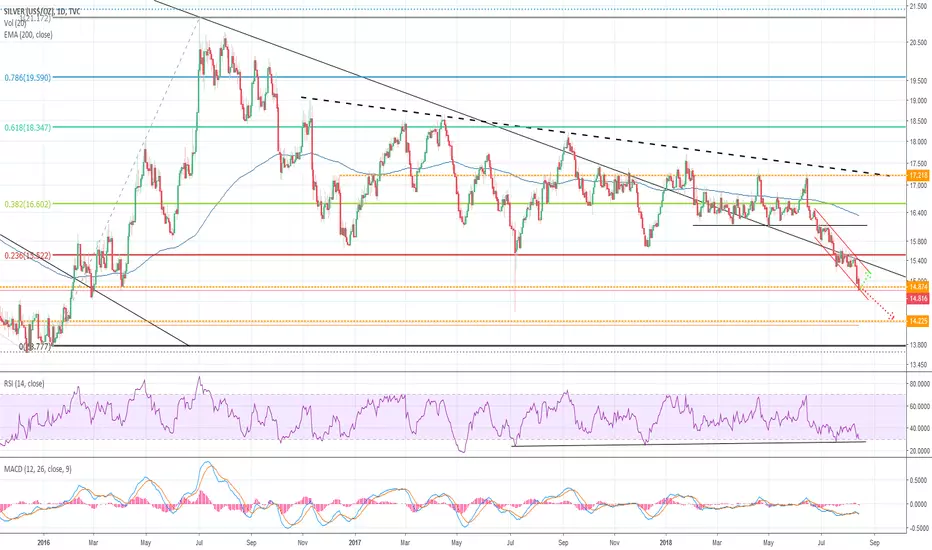
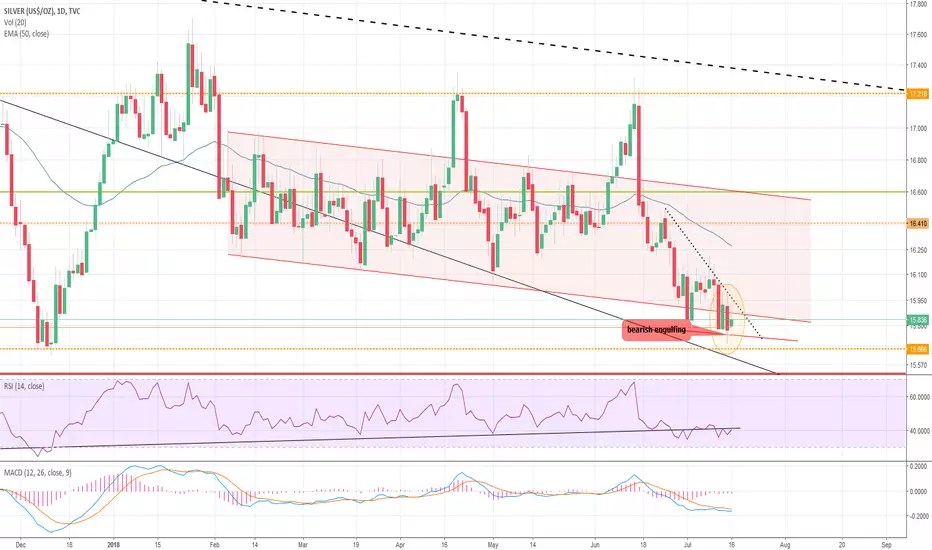
Silver shows weaknessSilver has not only left the negative trend channel to the bottom but also has had a bearish engulfing (2018-07-13) just after having a small recovering.
There is a new support line, parallel to the existing trend channel and this should not be broken.
RSI is in bearish zone, the trend shows a sideways move.
MACD is clearly negative.
To give new bullish signals Silver has to jump again into the trend channel, break the trend line (dotted), RSI has to turn up and MACD has to be triggered.
The big picture for silver stays negative as well (weekly candles).
For the moment to reason to invest but also no shorting.
This no trading advice!
Silver buy!The price of Silver ($) touched the lower limit of the trend channel and rebounded!
This is a good sign, because it shows that the trend channel is strong and active.
Now the silver-price can climb up to 16.59$ before reaching the upper limit of the trend channel and also the resistance line, formed by a fib retracement 38,2%. Some gains to make in short time.
BUT , the trend is still negative, as long as the channel hasn´t been broken to the top. And even if, there are two following resistance-lines:
1) swing trend line at 17,2$ - a strong resistance where silver rebounded twice in the last weeks
2) the falling trend line (dotted) - a resistance that hasn´t been broken since november 2016

Silver 1 Week ChartI love silver more than gold...WHY
Well looking at the chart and technology, gold is very manipulated and silver is almost 10x less than gold
Plus not to mention 1 oz of silver will get you 6 months of food in Venezuela, not that you are gonna go to Venezuela.
Right now it still needs to complete the weekly rising/ ascending triangle.
I would not be buying right now, although this is worth a long term investment.

Is Silver going to brake bullish out of the current Pennant?It is a matter of time for Silver to brake the current Pennant.
Due to numerous reason (check the attached idea) my opinion is that it will brake bullish. The only question is if it will have a false brake down before the pump starts. in case of a brake down, I see the levels of 15.575 and 14.630 as strong horizontal support
