Simple

Bitcoin Short Term AnalysisHey so as we can see Bitcoin slipped outside the double yellow lines and was brought back in by quick wick which tends to indicate that the price point will likely come down to the lower band of the yellow lines in the short term near that 20,500 level.
This is not financial advice and please do your own research as this is simply my opinion
drop a boost and follow for regular technical analysis

GBPAUD SELL/ShortThe pair has reach the H4 high or resistance. This pair is forming a double a top. Thie will push the price to 1.783202 being take profit
The pair has no news that affected the price movement of the pair.

SO range bound, it looks FAKE! #ESAt strong, clear ~2 year support level. Low downside risk if SL is set tight and known upside price target.

this is a long ideaif it break thw upper blue line which is yesterdays high then i am buying this is too easy

XAUUSD Analysis Nice bullish flag pattern execution.
great seeing some bullish pressure.
Happy Tuesday Traders!
The Less You Want the Richer Your are.

EURJPY (sell)Short term bearish bias. See if we can get a pullback to the golden Fibonacci level of 0.618.
Plain and simple ❤️
Happy trading

EURGBP ANALYSISEURGBP is going lower. My point of view is the same as my other post.
DISCLAIMER: This is not a financial advice.

US30 Order Block Strategy 1-12 RR BUY ExampleENTERTAINMENT PURPOSES ONLY
Another super simple explanation of this strategy.
Beautiful 50% retest of the Order Block before a 1:12RR move. Test it and tweak it for yourself!

BTC pennant, plan still remains the same.Nice and simple view of BTC rn.
a nice pennant forming, and range remains unbroken.
lose this area though and 30k gulag time.
Markets all round are a bit all over the place, so very interested to see direction of market.

BTCUSD: Decision Time 2022The markets, while particularly jostled and unstable, are also as equally unsure. We've seen MASSIVE gains for both crypto and the stock market through 2020 and 2021.
But what will happen in 2022? MANY predict a continued downtrend. Some predict a massive crash. Others, fueled by hope, think much higher highs are to be made.
Is inflation bad for markets after all? Will war boost or stunt the market? Can crypto outpace Oil anytime this year? Is it time to buy gold instead? Keep your eyes peeled, friends.

Two day shortTaking a position for a two-day short with this rather simple concept. Broken near-term channel floor guides us to a bearish posture. The conjoining channel patterns indicate a target price at levels 40200 - 38800. An overextension to 38000 is possible in accordance with an underlying fib at that level and untested support between 40-38k area.
The timeframe is Feb 13. - 15.

XAUUSD LONG SIMPLE SETUP!As you can see in the set up there is a symmetrical triangle which gold is respecting in the weekly and daily time frame.
The trendlines have been drawn in blue and the support and resistance is marked in red I believe gold will be bullish towards the 1840 area this area is where the trendline and resistance meets this is also a strong zone 0.786 fib zone
Entry around; 1831
Tp;1840.39
Sl; 1829.17

Quick 1:5 Risk Reward trade on GbpJpyI took this perfect trade today at the New York session and I'm posting this as journal or learn purposes.
If you have any questions about this trade setup you can contact me.

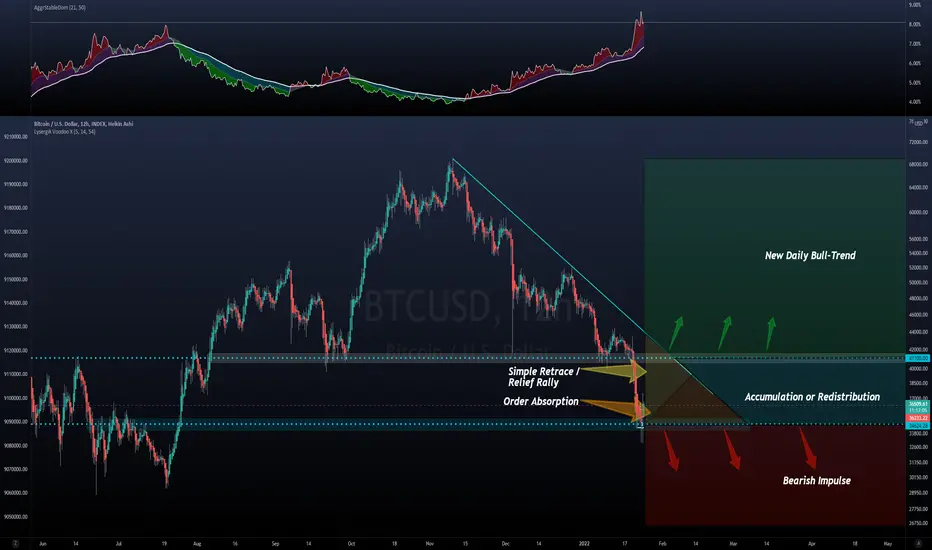
41k or 30k first? Here's what I see.We've had a bit of bull-spring / short-squeeze at 34k, and now have some small potential to reverse the daily bear trend by breaking above 41k. This will however require a ton of bullish pressure for an extended period of time for that to happen.
As long as we remain in the yellow zone, having higher low but staying below 41k / the blue downtrend resistance trendline you see here, then we are simply in a relief rally.
If we stay under 41k and the resistance trendline, but we start moving more sideways into the orange zone and making lower highs as implied by the descending resistance, then we will be slowing be eating up all the demand at ~34.5k until the bears come in to drop us into another bearish impulse.
But if we go into the orange area and eventually fail to break the 34.5k area (failing to make it a new resistance), then we break above the trendline resistance and do one of two things most likely. We may either accumulate or distribute in the blue zone, depending on how sentiment develops in that 34 to 41k range.
Finally, naturally, if we break above 41k and the trendline, we will have bulls back in control again and we could begin expecting each higher high to be a followed by a higher low; a bull-trend on this scale.
Bitcoin HTF TLWill wait for confluence of a bounce or break from this simple HTF TL for the next potential trade.


$BTC K.I.S.S analysisreasons for the bullish side:
-we have 2 support lines that are looking pretty strong(2 red lines)
-0.618 fib retracement that usually is a important level
reasons for short side:
-after making a new high, the price reversed back under the previous high aggressively ...
I would wait for more price action to make a decision

Nasdaq Support LevelIf it doesn't hold above $15,543, look out below.
Markets are overvalued relative to interest rates when rates are expected to rise.

bullish coming up to halving eventnot a buy signal, better projects out there,
btc chart bullish too

ICT OTE example breakdown, Looking at the chart as evidence. here we go again another ICT OTE in the NY session.
I know the charts a bit messy so lets simplify.
1. Order block is in higher TF structure
GREEN BOX
2. we are working against a HTF trend (pushing up when the Daily and 4 hour bias is down)
3. We are at extensions of the Sunday range, (price is looking for that sell high discount)
4. price shows us it has the backing to extend back to mitigate the order
5. price hits the order, DISCOUNT, HTF BIAS IN FAVOUR 79 percent entry (some people use this as a more reserved entry, Even the 62 is still not stopped out, could have entered again at 79 better price depending on Risk management and your flavour.
6. short break of structure to upside again, Trend line broken and stops hunted.
7. 3-1 easy.....5-1 if you held it.
Simplify, Things are easier to see when you simplify....
money doesn't care about your fancy indicators or rituals or mathematical calculations, The trade is an investigation, The chart IS THE EVIDENCE LEFT IN THE CRIME SCENE..
ill keep dropping them in, so that people can see examples, Drop a like and let me know they are helping.
designate target, Aim ... fire.

#SHIBUSDT W8 for it to buyhello this is my first idea on trading view
I'm glad to read your suggestions to improve my ideas
My idea about Shib/Usdt :
there are two channels here in 4h, although I prefer the blue one
I think it would be touch the bottom of the blue channel (+ strong support zone) and then start a bullish trend
entry price : 0.00006000
stop loss : 0.00005502
take profit : midline of the blue channel in the resistance zone ( highest high )

US30Rules:
-If price break Point 2, 4, or 6 cancel the setup
-Price needs to break Point 1, 3, and 5 to confirm the setup
When price reach the 100FE it normally does a pullback or reversal
The market can Truncate
