NZDCAD: Bullish Continuation
The charts are full of distraction, disturbance and are a graveyard of fear and greed which shall not cloud our judgement on the current state of affairs in the NZDCAD pair price action which suggests a high likelihood of a coming move up.
Disclosure: I am part of Trade Nation's Influencer program and receive a monthly fee for using their TradingView charts in my analysis.
❤️ Please, support our work with like & comment! ❤️
Smartmoney

AUDUSD: Long Signal Explained
AUDUSD
- Classic bullish pattern
- Our team expects retracement
SUGGESTED TRADE:
Swing Trade
Buy AUDUSD
Entry - 0.6552
Stop - 0.6540
Take - 0.6575
Our Risk - 1%
Start protection of your profits from lower levels
Disclosure: I am part of Trade Nation's Influencer program and receive a monthly fee for using their TradingView charts in my analysis.
❤️ Please, support our work with like & comment! ❤️

NZDCHF: Market Sentiment & Price Action
Our strategy, polished by years of trial and error has helped us identify what seems to be a great trading opportunity and we are here to share it with you as the time is ripe for us to sell NZDCHF.
Disclosure: I am part of Trade Nation's Influencer program and receive a monthly fee for using their TradingView charts in my analysis.
❤️ Please, support our work with like & comment! ❤️

GOLD: Short Trade Explained
GOLD
- Classic bearish formation
- Our team expects fall
SUGGESTED TRADE:
Swing Trade
Sell GOLD
Entry Level - 3972.9
Sl - 3987.4
Tp - 3944.7
Our Risk - 1%
Start protection of your profits from lower levels
Disclosure: I am part of Trade Nation's Influencer program and receive a monthly fee for using their TradingView charts in my analysis.
❤️ Please, support our work with like & comment! ❤️

NZDJPY — Waiting for the Sweep Before the ImpulseThe market is setting its own stage.
The green ABC correction is approaching its final C-leg — right into a cluster of confluence: trendline support, an internal order block, and a liquidity pocket resting beneath the prior lows.
I’m waiting for that final sweep into the OB/trendline area before stepping in to ride the pink impulsive C-leg toward the upper channel and buyside liquidity zone near 88.6 – 88.8 .
The plan is simple:
– Let the algorithm complete its cleanup below.
– Watch for an MSS and fair-value-gap confirmation.
– Ride the next displacement toward the liquidity resting above.
Invalidation:
If price violates the order block decisively and structure fails to shift, the setup expires.
Strengths:
– Clear multi-timeframe wave alignment (green correction → pink impulse)
– Strong OB + trendline + liquidity sweep confluence
– High reward potential once the pink C-leg activates
Weaknesses:
– Early entries before sweep risk being trapped
– Yen volatility can disrupt lower-timeframe confirmations
Summary:
Patience before precision. I’m waiting for the sweep to finish — then decoding the next wave of chaos.

EUR/GBP – Corrective C Wave in PlayPrice already tapped the black BC, suggesting the first correction leg is done.
Now, the pink wave’s C target aligns perfectly with both the descending trendline and the order block — a strong confluence zone likely to induce liquidity before a deeper retracement of the black wave.
Setup remains valid as long as the black B isn’t broken. A break above B would invalidate the sequence and shift market structure bullish.
Strengths:
Trendline + order block + C target alignment
Internal correction forming cleanly within larger structure
Clear invalidation and strong confluence logic
Weaknesses:
Liquidity sweeps may occur before confirmation
Requires patience for MSS confirmation before entry

EURUSD | Bias Shift & QML Zone in FocusThe previous setup has been invalidated as the market showed a clear Change of Character (ChoCh), flipping the structure and order flow to bullish.
With that shift, my bias has now turned bullish, and I’ve marked the QML (Quasimodo Level) zone as my area of interest.
I’ll be waiting for price to tap into this zone and show confirmation before considering any execution.
Adaptability is part of discipline — the market evolves, and so should the bias.
⚠️ Disclaimer: This analysis is for educational purposes only. Always manage your risk and trade responsibly.

NZDUSD FREE SIGNAL|LONG|
✅NZDUSD Price bounced from the demand level after a liquidity sweep below the lows, confirming bullish order flow continuation toward the upper range.
—————————
Entry: 0.5762
Stop Loss: 0.5748
Take Profit: 0.5788
Time Frame: 2H
—————————
LONG🚀
✅Like and subscribe to never miss a new idea!✅

CAD-CHF Short From Supply Area! Sell!
Hello,Traders!
CADCHF Price has reacted from a horizontal supply area, showing early signs of distribution. A short-term retracement is expected as liquidity below the recent swing lows gets targeted. Time Frame 2H.
Sell!
Comment and subscribe to help us grow!
Check out other forecasts below too!
Disclosure: I am part of Trade Nation's Influencer program and receive a monthly fee for using their TradingView charts in my analysis.

GBPAUD RISKY LONG|
✅GBPAUD Price created a triple-bottom formation at discount levels, signaling strong bullish rejection from demand. Expect a short-term rally targeting liquidity above the recent highs. Time Frame 2H.
LONG🚀
✅Like and subscribe to never miss a new idea!✅

EURAUD WILL GROW|LONG|
✅EURAUD Price tapped into the demand zone and showed a bullish reaction, confirming short-term accumulation. Expect continuation higher toward the next liquidity pocket near the target zone. Time Frame 2H.
LONG🚀
✅Like and subscribe to never miss a new idea!✅

EUR-GBP Free Signal! Sell!
Hello,Traders!
EURGBP formed a clean double-top structure at premium pricing and broke below the neckline with momentum, signaling bearish intent. The move targets a key imbalance zone below.
-------------------
Stop Loss: 0.8818
Take Profit: 0.8783
Entry: 0.8804
Time Frame: 1H
-------------------
Sell!
Comment and subscribe to help us grow!
Check out other forecasts below too!
Disclosure: I am part of Trade Nation's Influencer program and receive a monthly fee for using their TradingView charts in my analysis.

AUDCAD: Bears Will Push Lower
The recent price action on the AUDCAD pair was keeping me on the fence, however, my bias is slowly but surely changing into the bearish one and I think we will see the price go down.
Disclosure: I am part of Trade Nation's Influencer program and receive a monthly fee for using their TradingView charts in my analysis.
❤️ Please, support our work with like & comment! ❤️

NZDUSD: Bearish Continuation & Short Trade
NZDUSD
- Classic bearish formation
- Our team expects pullback
SUGGESTED TRADE:
Swing Trade
Short NZDUSD
Entry - 0.5800
Sl - 0.5808
Tp - 0.5786
Our Risk - 1%
Start protection of your profits from lower levels
Disclosure: I am part of Trade Nation's Influencer program and receive a monthly fee for using their TradingView charts in my analysis.
❤️ Please, support our work with like & comment! ❤️

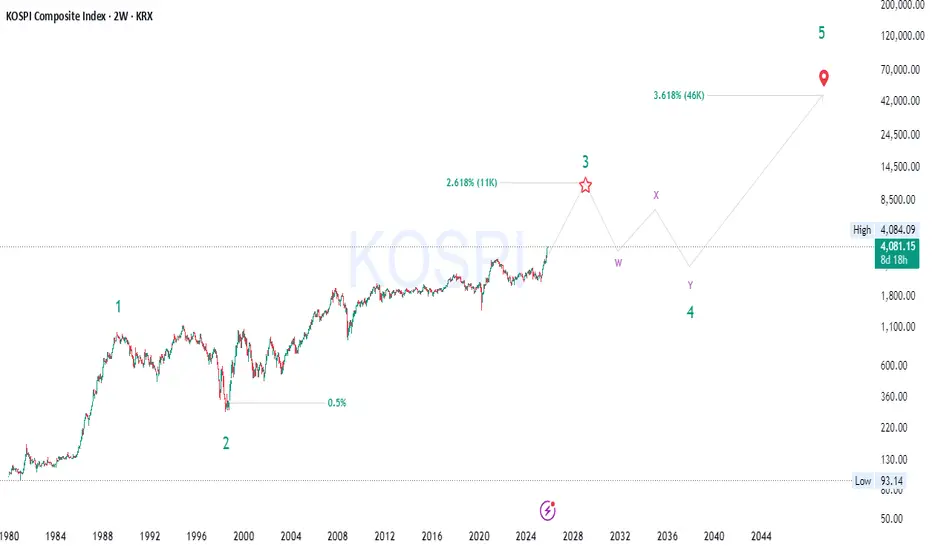
KOPSI 4K → 11K → 46K | The Wave Map Nobody’s Talking About🚀 KOSPI | Supercycle Loading… 🌊💥
⚡️ Data → Discipline → Destiny → KOSPI’s Next Chapter 📊
The KOSPI isn’t done yet — it’s just getting started.
We’re mid-flight in a macro Wave (3) aiming for that 2.618 Fib zone (~11K) before a clean reset into Wave 4 , then liftoff to the 3.618 extension (~46K) 😳
💎 Smart Money Accumulation:
Big players have been quietly loading — liquidity grabs, higher lows, and BOS after BOS 👀
This isn’t noise… it’s reaccumulation before expansion .
📈 Price Action + Market Structure:
Every dip is defended, demand zones respected, and momentum building — textbook continuation setup ⚡️
🌍 Fundamentals Align:
Tech strength, export growth, and AI expansion — the macro story finally matches the wave count 📊
🌀 The Supercycle Is Alive.
Those who see it early… ride it legendary.
#KOSPI #ElliottWave #SmartMoney #Fibonacci #MacroCycle #MarketStructure #TradingView
CRUDE OIL Local Short! Sell!
Hello,Traders!
CRUDE OIL is reacting from the horizontal supply area after liquidity above previous highs was taken. Expect continuation to the downside as the market rebalances toward the target level.
Sell!
Comment and subscribe to help us grow!
Check out other forecasts below too!
Disclosure: I am part of Trade Nation's Influencer program and receive a monthly fee for using their TradingView charts in my analysis.

XLMUSD — Bullish Continuation Valid While Red B HoldsFrom the top-down view, XLM completed a deep corrective structure that bottomed inside the previous WCL (blue box). The current sequence builds a new bullish cycle , with the red ABC wave mapping cleanly against both structural and liquidity geometry.
Price reacted strongly from the red BC demand zone , producing a local yellow ABC micro-sequence. The setup anticipates continuation toward the upper WCL region (0.38 – 0.42) .
The re-entry area sits near the mid-trend retest—confirmation required via MSS + FVG displacement.
Invalidation:
This idea remains bullish until the red B low is broken . Violation of that pivot voids the wave count and resumes the broader correction.
Strengths: – Multi-timeframe alignment (macro + micro)
– BC demand reaction with displacement
– Defined invalidation under red B (lowest-risk logical stop)
Weaknesses:
– Correlation drag if majors retrace
– Shallow pullbacks may induce premature MSS signals
Summary:
Bulls control the rhythm while red B stands. Break B — and the music stops.

EURCHF: Bearish Continuation is Expected! Here is Why:
It is essential that we apply multitimeframe technical analysis and there is no better example of why that is the case than the current EURCHF chart which, if analyzed properly, clearly points in the downward direction.
Disclosure: I am part of Trade Nation's Influencer program and receive a monthly fee for using their TradingView charts in my analysis.
❤️ Please, support our work with like & comment! ❤️

BTCUSDT Review October 29 2025Short-term price movement ideas.
The price reached the weekly zone of interest and, within it, performed a daily liquidity sweep, which triggered a bearish move. After the daily sweep, we received confirmations on the 4H timeframe, and now the nearest zone to watch is the 4H Break to Structure (BtS). If this zone gets tested and confirmed on a lower timeframe, we can then consider opening a short position targeting a new low.
Be flexible, adapt to the market, and the results will come quickly. Good luck to everyone.

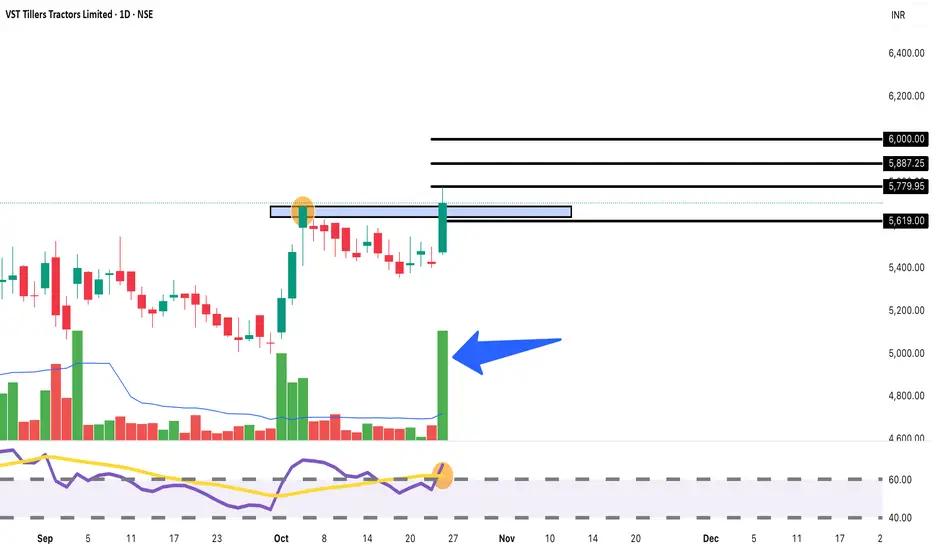
VST Tillers: Explosive Volume Breakout! Target 5,900+BUY Setup 🚜
Entry: ₹5,703-5,720 (Current Level)
Target 1: ₹5,779-5,800
Target 2: ₹5,887-5,900
Target 3: ₹6,000+ (Extended)
Stop Loss: ₹5,620
Technical Rationale:
Massive volume spike (8.71K) - highest in recent period, highlighted with blue arrow
Strong bullish momentum with +5.23% surge today
Breaking out from consolidation range (5,460-5,700)
Price moving above resistance zone marked at 5,700
Rounding bottom formation visible - classic bullish reversal
RSI around 65, showing strength with room for upside
Volume confirmation is exceptional - institutional buying evident
Agricultural/tractor sector showing renewed interest
Two major resistance levels clearly marked at 5,779 and 5,887
Support established at breakout zone (5,650-5,680)
Risk-Reward: Strong 1:3+ ratio
Pattern: Rounding bottom breakout with exceptional volume - highly reliable bullish signal
Strategy: Short to medium-term swing - Book 30% at T1 (5,790), 30% at T2 (5,890), trail remaining with SL at 5,720 after T1
Key Catalysts:
Volume explosion indicating smart money accumulation
Agricultural sector tailwinds
Festive season demand
Key Levels:
Strong Resistance: 5,779, 5,887
Support: 5,650, 5,620, 5,600
education purpose only
GOLD BEARISH BIAS|SHORT|
✅XAUUSD is reacting from a major supply level after a clean rejection of premium territory. Expect bearish continuation as price seeks to close the imbalance toward the marked target zone. Time Frame 4H.
SHORT🔥
✅Like and subscribe to never miss a new idea!✅

GOLD Free Signal! Sell!
Hello,Traders!
GOLD reacted precisely from the horizontal supply area, showing displacement and lower-timeframe structure breaks. A bearish move is expected as liquidity above the previous high was swept.
-------------------
Stop Loss: 3,993$
Take Profit: 3,882$
Entry: 3,938$
Time Frame: 3H
-------------------
Sell!
Comment and subscribe to help us grow!
Check out other forecasts below too!
Disclosure: I am part of Trade Nation's Influencer program and receive a monthly fee for using their TradingView charts in my analysis.

DXY RISING TRENDLINE BELOW|LONG|
✅DXY Price is respecting the rising trendline, showing consistent higher lows. Expect bullish continuation toward the target zone after the retest, as price seeks to rebalance inefficiency left from prior impulsive moves. Time Frame 7H.
LONG🚀
✅Like and subscribe to never miss a new idea!✅
