USD-CHF Supply Level Above! Sell!
Hello,Traders!
USDCHF Price is approaching a horizontal supply area but hasn’t confirmed a retest yet. Smart money may seek liquidity sweep above before reacting lower toward the target zone. Time Frame 4H.
Sell!
Comment and subscribe to help us grow!
Check out other forecasts below too!
Disclosure: I am part of Trade Nation's Influencer program and receive a monthly fee for using their TradingView charts in my analysis.
Smartmoneyconcept

EUR-AUD Bullish Bias! Buy!
Hello,Traders!
EURAUD Price has tapped into a clean horizontal demand area after an extended bearish leg. Smart money shows absorption of sell-side liquidity, hinting at a potential short-term bullish move toward the target.
-------------------
Stop Loss: 1.7580
Take Profit: 1.7660
Entry Level: 1.7624
Time Frame: 4H
-------------------
Buy!
Comment and subscribe to help us grow!
Check out other forecasts below too!
Disclosure: I am part of Trade Nation's Influencer program and receive a monthly fee for using their TradingView charts in my analysis.

GBPCAD FREE SIGNAL|LONG|
✅GBPCAD :a clear double-bottom formation confirms the exhaustion of sellers after the extended downtrend. Buyers are reclaiming structure, hinting at a potential bullish reversal toward the target zone.
—————————
Entry: 1.8413
Stop Loss: 1.8359
Take Profit: 1.8496
Time Frame: 1H
—————————
LONG🚀
✅Like and subscribe to never miss a new idea!✅

AUD-NZD Free Signal! Sell!
Hello,Traders!
AUDNZD Price is reacting from a clean horizontal supply zone where previous liquidity was taken. Smart money is now showing rejection signs — expecting a short move toward the downside target zone.
-------------------
Stop Loss: 1.1447
Take Profit: 1.1416
Entry: 1.1431
Time Frame: 4H
-------------------
Sell!
Comment and subscribe to help us grow!
Check out other forecasts below too!
Disclosure: I am part of Trade Nation's Influencer program and receive a monthly fee for using their TradingView charts in my analysis.

NZDUSD FREE SIGNAL|LONG|
✅NZDUSD bounced strongly from the defined demand level, confirming bullish order flow. The pair may continue climbing toward the target zone as liquidity above recent highs gets cleared.
—————————
Entry: 0.5725
Stop Loss: 0.5709
Take Profit: 0.5744
Time Frame: 2H
—————————
LONG🚀
✅Like and subscribe to never miss a new idea!✅

NZD-USD Long From Demand Area! Buy!
Hello,Traders!
NZDUSD tapped into a horizontal demand area with strong rejection wicks. Expecting a short-term bullish reaction toward the next liquidity pocket at the target level.Time Frame 2H.
Buy!
Comment and subscribe to help us grow!
Check out other forecasts below too!
Disclosure: I am part of Trade Nation's Influencer program and receive a monthly fee for using their TradingView charts in my analysis.

EURUSD BEARISH BIAS|SHORT|
✅EURUSD broke structure below the supply level, confirming bearish order flow. After a minor pullback into imbalance, more downside is expected as price seeks liquidity resting below recent lows. Time Frame 3H.
SHORT🔥
✅Like and subscribe to never miss a new idea!✅

AUDNZD FREE SIGNAL|SHORT|
✅AUDNZD is reacting from a clear supply level, showing early rejection wicks and loss of momentum. A short-term bearish leg is expected toward the nearest imbalance before potential continuation.
—————————
Entry: 1.1433
Stop Loss: 1.1445
Take Profit: 1.1410
Time Frame: 3H
—————————
SHORT🔥
✅Like and subscribe to never miss a new idea!✅

GBP-CAD Free Signal! Sell!
Hello,Traders!
GBPCAD formed a double-top around a horizontal supply area, showing clear distribution signs. Expecting continuation lower as liquidity under recent equal lows becomes the next draw.
-------------------
Stop Loss: 1.8436
Take Profit: 1.8325
Entry: 1.8392
Time Frame: 5H
-------------------
Sell!
Comment and subscribe to help us grow!
Check out other forecasts below too!
Disclosure: I am part of Trade Nation's Influencer program and receive a monthly fee for using their TradingView charts in my analysis.

EURAUD LOCAL LONG|
✅EURAUD tapped into a well-defined demand level and is showing signs of accumulation. With liquidity taken below previous lows, a short-term bullish reaction toward the next imbalance zone is likely. Time Frame 3H.
LONG🚀
✅Like and subscribe to never miss a new idea!✅

EUR-USD Bearish Breakout! Sell!
Hello,Traders!
EURUSD has broken below the horizontal supply area, confirming a bearish structure shift. A short-term pullback could provide premium entries toward the next liquidity pool below.Time Frame 4H.
Sell!
Comment and subscribe to help us grow!
Check out other forecasts below too!
Disclosure: I am part of Trade Nation's Influencer program and receive a monthly fee for using their TradingView charts in my analysis.

AUDCAD FREE SIGNAL|LONG|
✅AUDCAD reacted from a clean demand level with strong bullish intent. Liquidity beneath previous lows has been swept, suggesting a possible continuation toward the next imbalance zone.
—————————
Entry: 0.9162
Stop Loss: 0.9145
Take Profit: 0.9182
Time Frame: 3H
—————————
LONG🚀
✅Like and subscribe to never miss a new idea!✅

NATGAS CORRECTION AHEAD|SHORT|
✅NATGAS after rallying into a high-timeframe supply level, price shows signs of exhaustion and potential mitigation before retracement. Liquidity sits below the recent swing lows. Time Frame 5H.
SHORT🔥
✅Like and subscribe to never miss a new idea!✅

GOLD LOCAL SHORT|
✅XAUUSD is tapping into a fresh supply level after an impulsive rally, signaling potential bearish rejection toward the short-term imbalance zone below. Time Frame 2H.
SHORT🔥
✅Like and subscribe to never miss a new idea!✅

GOLD Free Signal! Sell!
Hello,Traders!
GOLD Price has reached a horizontal supply area after a corrective move upward. Bears are likely to step in, targeting the previous low for liquidity.
-------------------
Stop Loss: 4,052$
Take Profit: 3,997$
Entry: 4,027$
Time Frame: 2H
Setup Risk: High
-------------------
Sell!
Comment and subscribe to help us grow!
Check out other forecasts below too!
Disclosure: I am part of Trade Nation's Influencer program and receive a monthly fee for using their TradingView charts in my analysis.

NZD-USD Bearish Breakout! Sell!
Hello,Traders!
NZDUSD broke below its bearish flag pattern, confirming a potential continuation to the downside. The next liquidity target sits near the lower support zone. Time Frame 4H.
Sell!
Comment and subscribe to help us grow!
Check out other forecasts below too!
Disclosure: I am part of Trade Nation's Influencer program and receive a monthly fee for using their TradingView charts in my analysis.

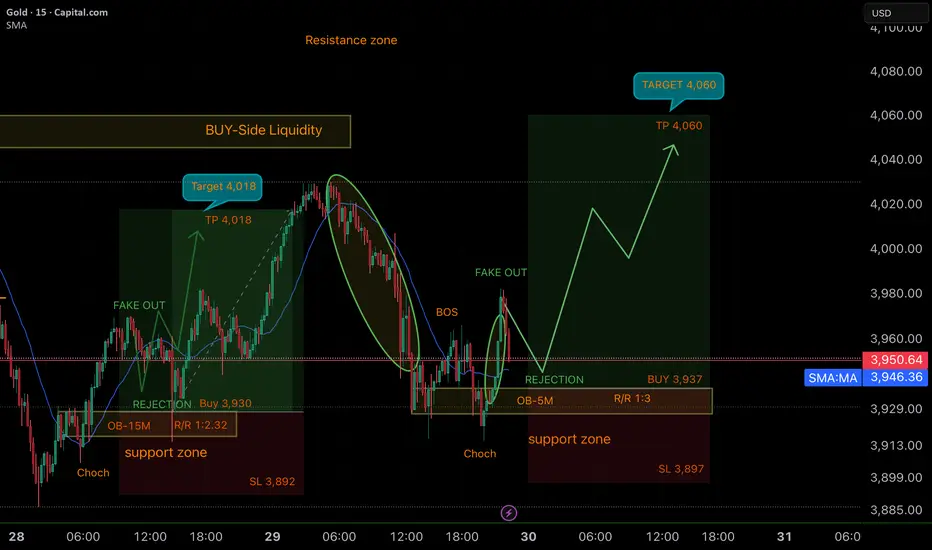
SMART MONEY CONCEPT (SMC)📊 XAU/USD Bullish Analysis (15M)
🔑 Key Points
1. Previous Setup Completed:
The first trade idea (Buy at 3,930 with TP at 4,018) played out perfectly, validating the 15M OB and initial fake out. Price reached the Buy-Side Liquidity and reacted at the resistance zone.
2. New Context (after BOS):
After reaching 4,018, price retraced and created a Break of Structure (BOS), sweeping liquidity to the downside. This cleared orders and set the stage for a fresh bullish leg.
3. Fake Out + Rejection at OB-5M:
A new Fake Out occurred, confirming accumulation.
The 5M Order Block inside the support zone (3,897 – 3,937) serves as the institutional entry area.
4. Trade Plan:
• Buy: 3,937
• SL: 3,897 (below support zone)
• TP: 4,060 (liquidity/resistance target)
• R/R: 1:3 (strong risk-to-reward profile)
5. Bullish Projection:
After rejection from the OB, price is expected to push upward, targeting the liquidity pool around 4,060.
📈 Conclusion
This setup aligns with Smart Money Concepts (SMC):
✅ BOS & liquidity sweep confirmation
✅ OB-5M as precise entry point
✅ Solid R/R ratio of 1:3
Clear structure, strong confirmation, and a well-defined target.
💡 Motivational Note
“Liquidity must be taken before direction is revealed. Patience and precision are what separate good traders from lucky ones. GOOD LUCK TRADERS… 🦾😎🫵🏻
NZDUSD FREE SIGNAL|LONG|
✅NZDUSD Price bounced from the demand level after a liquidity sweep below the lows, confirming bullish order flow continuation toward the upper range.
—————————
Entry: 0.5762
Stop Loss: 0.5748
Take Profit: 0.5788
Time Frame: 2H
—————————
LONG🚀
✅Like and subscribe to never miss a new idea!✅

CAD-CHF Short From Supply Area! Sell!
Hello,Traders!
CADCHF Price has reacted from a horizontal supply area, showing early signs of distribution. A short-term retracement is expected as liquidity below the recent swing lows gets targeted. Time Frame 2H.
Sell!
Comment and subscribe to help us grow!
Check out other forecasts below too!
Disclosure: I am part of Trade Nation's Influencer program and receive a monthly fee for using their TradingView charts in my analysis.

GBPAUD RISKY LONG|
✅GBPAUD Price created a triple-bottom formation at discount levels, signaling strong bullish rejection from demand. Expect a short-term rally targeting liquidity above the recent highs. Time Frame 2H.
LONG🚀
✅Like and subscribe to never miss a new idea!✅

EURAUD WILL GROW|LONG|
✅EURAUD Price tapped into the demand zone and showed a bullish reaction, confirming short-term accumulation. Expect continuation higher toward the next liquidity pocket near the target zone. Time Frame 2H.
LONG🚀
✅Like and subscribe to never miss a new idea!✅

EUR-GBP Free Signal! Sell!
Hello,Traders!
EURGBP formed a clean double-top structure at premium pricing and broke below the neckline with momentum, signaling bearish intent. The move targets a key imbalance zone below.
-------------------
Stop Loss: 0.8818
Take Profit: 0.8783
Entry: 0.8804
Time Frame: 1H
-------------------
Sell!
Comment and subscribe to help us grow!
Check out other forecasts below too!
Disclosure: I am part of Trade Nation's Influencer program and receive a monthly fee for using their TradingView charts in my analysis.

CRUDE OIL Local Short! Sell!
Hello,Traders!
CRUDE OIL is reacting from the horizontal supply area after liquidity above previous highs was taken. Expect continuation to the downside as the market rebalances toward the target level.
Sell!
Comment and subscribe to help us grow!
Check out other forecasts below too!
Disclosure: I am part of Trade Nation's Influencer program and receive a monthly fee for using their TradingView charts in my analysis.
