GBP-USD Free Signal! Sell!
Hello,Traders!
GBPUSD tapped into a horizontal supply area after grabbing buy-side liquidity, confirming bearish intent. Smart Money likely aims for imbalance fill toward 1.3302$ before any rebound.
-------------------
Stop Loss: 1.3335$
Take Profit: 1.3302$
Entry: 1.3322$
Time Frame: 3H
Setup Risk: High
-------------------
Sell!
Comment and subscribe to help us grow!
Check out other forecasts below too!
Disclosure: I am part of Trade Nation's Influencer program and receive a monthly fee for using their TradingView charts in my analysis.
Smartmoneyconcepts

EURAUD BEARISH BIAS|SHORT|
✅EURAUD retraced into a clear supply level after a sharp displacement move. ICT traders anticipate distribution, targeting inefficiency around 1.7830 as price seeks sell-side liquidity. Time Frame 3H.
SHORT🔥
✅Like and subscribe to never miss a new idea!✅

Demand Zone Formed, Bulls Eyeing BSLHello Traders 👋
Hope your week is off to a strong and focused start!
Today on EURUSD, we’ve seen price shifting its fractal bias multiple times—clear signs of market indecision. But here’s where it gets interesting: after the latest shift in fractal structure, price delivered a strong bullish push, forming a fresh demand zone.
With this momentum, I’m anticipating a continued move to the upside, targeting the Break of Structure Liquidity (BSL). That said, LTF (Lower Time Frame) confirmation is essential before entering any buy trades—stay patient and let price validate your setup.
Stay sharp and trade with discipline

EUR-AUD Free Signal! Buy!
Hello,Traders!
EURAUD taps into a horizontal demand area, showing strong displacement to the upside as Smart Money absorbs liquidity below recent lows. A bullish reaction from this level targets 1.7793 for rebalancing.
—————————
Stop Loss: 1.7706
Take Profit: 1.7793
Entry: 1.7751
—————————
Buy!
Comment and subscribe to help us grow!
Check out other forecasts below too!
Disclosure: I am part of Trade Nation's Influencer program and receive a monthly fee for using their TradingView charts in my analysis.

USDUSD BULLISH BIAS|LONG|
✅USDCAD shows clear bullish intent as price expands through a key level, confirming a breakout and potential continuation phase. Liquidity above 1.4050 acts as magnet for Smart Money rebalancing. Time Frame 12H.
LONG🚀
✅Like and subscribe to never miss a new idea!✅

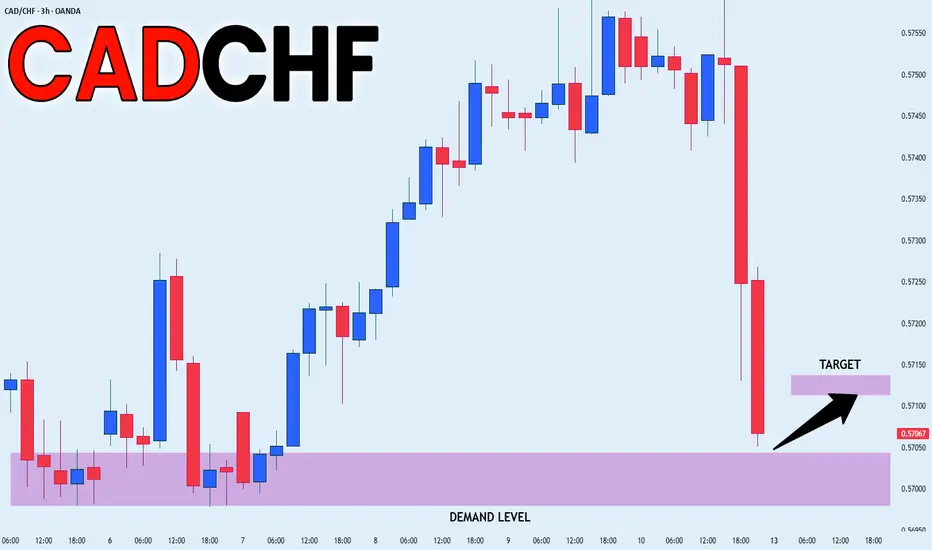
CADCHF RISKY LONG|
✅CADCHF Smart Money targets the demand level where price is likely to react. Liquidity beneath equal lows may soon be swept before expansion toward 0.5715 to rebalance inefficiency. Time Frame 3H.
LONG🚀
✅Like and subscribe to never miss a new idea!✅
EUR-CAD Strong Breakout! Buy!
Hello,Traders!
EURCAD breaks above the key horizontal level, signaling Smart Money expansion after liquidity grab beneath structure. Price may now rebalance inefficiency toward 1.6300, confirming bullish intent. Time Frame 3H.
Buy!
Comment and subscribe to help us grow!
Check out other forecasts below too!
Disclosure: I am part of Trade Nation's Influencer program and receive a monthly fee for using their TradingView charts in my analysis.

DXY Demand Area! Buy!
Hello,Traders!
DXY pulls back into a well-defined horizontal demand area, aligning with ICT displacement logic. A bullish reaction from this level may confirm accumulation before expansion toward 99.10 liquidity. Time Frame 3H.
Buy!
Comment and subscribe to help us grow!
Check out other forecasts below too!
Disclosure: I am part of Trade Nation's Influencer program and receive a monthly fee for using their TradingView charts in my analysis.

EURUSD FREE SIGNAL|LONG|
✅EURUSD breaks above a key level, confirming bullish order flow under ICT principles. Smart Money likely targeting buy-side liquidity above recent highs, with clean displacement suggesting continuation.
—————————
Entry: 1.1614
Stop Loss: 1.1599
Take Profit: 1.1640
Time Frame: 1H
—————————
LONG🚀
✅Like and subscribe to never miss a new idea!✅

EURCAD BULLISH BREAKOUT|LONG|
✅EURCAD shows a clean breakout above the key level, confirming a bullish shift in market structure. ICT concepts suggest a potential retest before continuation toward 1.63000 where buy-side liquidity rests. Time Frame 3H.
LONG🚀
✅Like and subscribe to never miss a new idea!✅

USD-JPY Demand Area Below! Buy!
Hello,Traders!
USDJPY is approaching a wide demand area, where Smart Money may engineer a liquidity grab before reversing. Expect price to react from 150.300 zone, targeting 152.000 as inefficiency gets rebalanced. Time Frame 12H.
Buy!
Comment and subscribe to help us grow!
Check out other forecasts below too!
Disclosure: I am part of Trade Nation's Influencer program and receive a monthly fee for using their TradingView charts in my analysis.

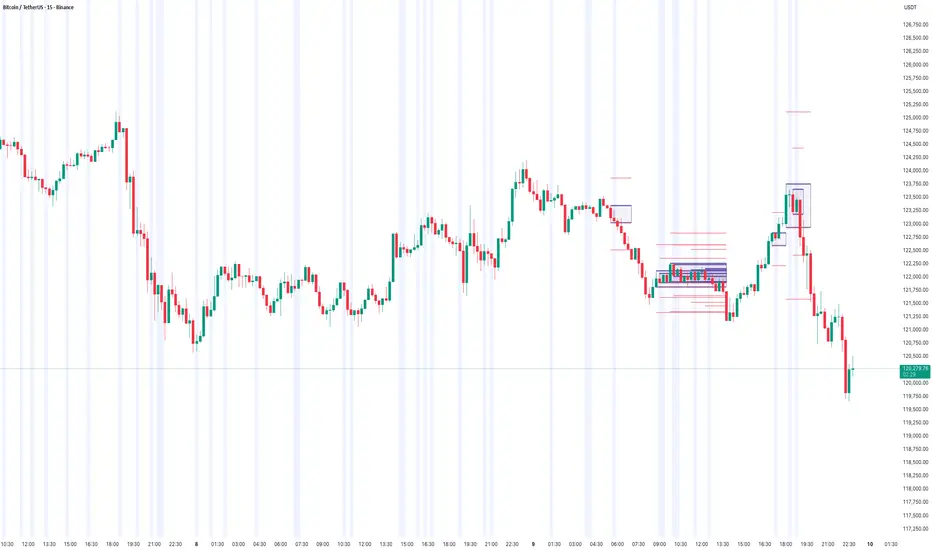
BTC → Correction phase before bullish expansionBTC/USD Report-Based Analysis
Bitcoin is currently in a corrective phase following a structured upward delivery. After showing strength early in the cycle, the market transitioned into a redistribution and consolidation zone, allowing liquidity to rebalance across both sides. This shift suggests that price is undergoing a short-term reaccumulation before the next impulsive move. The recent break of structure (BOS) indicates a temporary bearish delivery, designed to sweep liquidity below prior demand zones. Smart money appears to be collecting positions in discounted price areas, absorbing sell-side liquidity as volatility expands. The clean liquidity pockets under 116,000–114,000 levels highlight potential mitigation zones where larger participants may seek re-entry. The overall structure remains bullish on the higher timeframe. Once the current correction finalizes and liquidity is efficiently collected, BTC may resume its upward expansion, targeting premium zones near 125,000 and above. Momentum confirmation from volume and market flow will be essential for validating this transition back into a bullish delivery phase. In short, BTC is in a controlled correction, aiming to refine liquidity before reinitiating its bullish macro delivery cycle.

CADJPY FREE SIGNAL|LONG|
✅CADJPY forms a bullish structure after reclaiming the demand level, signaling Smart Money interest in premium buys. Liquidity sweep below 108.800 confirms accumulation before a move toward 109.460 target.
—————————
Entry: 109.051
Stop Loss: 108.664
Take Profit: 109.460
Time Frame: 7H
—————————
LONG🚀
✅Like and subscribe to never miss a new idea!✅

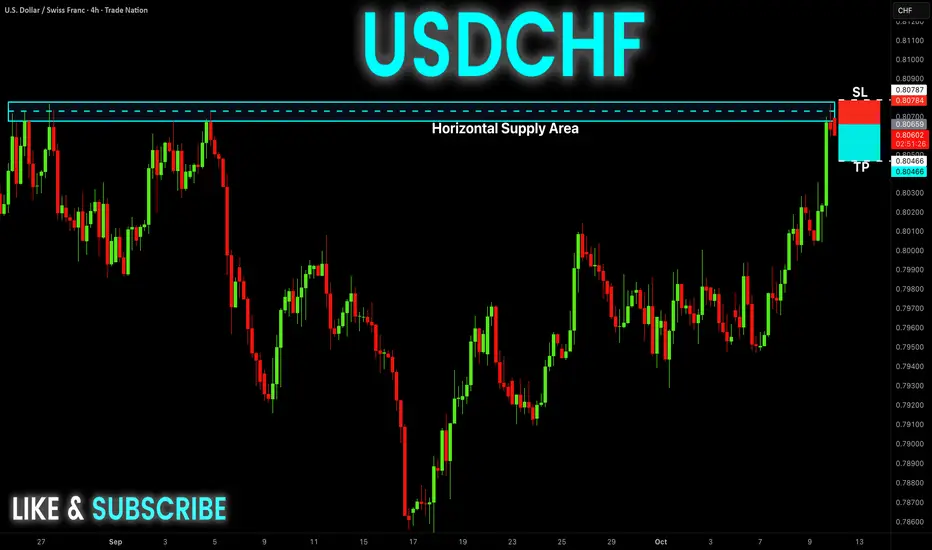
USD-CHF Free Signal! Sell!
Hello,Traders!
USDCHF taps into the horizontal supply area where Smart Money distributes orders. Liquidity above previous highs has been swept, confirming bearish intent with downside target at 0.8046 as imbalance fills. Time Frame 4H.
-------------------
Stop Loss: 0.8078
Take Profit: 0.8046
Entry: 0.8060
Time Frame: 4H
-------------------
Sell!
Comment and subscribe to help us grow!
Check out other forecasts below too!
Disclosure: I am part of Trade Nation's Influencer program and receive a monthly fee for using their TradingView charts in my analysis.
How to use Candle Range Detector – Fibo-Based Volatility mapping🧠 Concept Overview
The Candle Range Detector (CRD) visualizes how market volatility expands and contracts across time.
Instead of using a static multiplier, it applies Fibonacci ratios (0.618, 1.0, 1.618, 2.618, etc.) to dynamically scale candle ranges, helping traders spot where price might react or exhaust.
Each detected candle range forms a zone or band representing potential continuation or reversal interest areas.
This adaptive approach captures market rhythm more naturally than uniform multipliers.
⸻
⚙️ How It Works
1. Range Detection:
The indicator measures the true range (high–low) of key candles and maps them forward on the chart.
2. Fibonacci Expansion Logic:
Instead of a normal “x times range” multiplier, Fibonacci levels are used to project natural extensions and contractions from each candle’s body or wick.
3. Zone Formation:
Each candle’s range forms a rectangular area (as shown on your chart).
• Thicker Boxes: Represent strong impulsive candles or high-volume bars.
• Lighter Boxes: Represent pullback or resting candles.
4. Automatic Overlap Handling:
When two zones overlap, the indicator visually merges them, highlighting confluence where multiple candle ranges align — a sign of strong market memory.
⸻
📊 How to Interpret
• When price revisits a previously detected Fibonacci expansion zone, it often reacts (pause or reversal).
• A cluster of zones at similar levels acts like a dynamic supply/demand region.
• Breakouts beyond upper/lower Fibonacci bands may indicate trend continuation.
• Tight clusters of small ranges suggest compression – potential breakout setup.
⸻
💡 Practical Use-Cases
• Identify where short-term volatility clusters before big moves.
• Spot pullback re-entries aligned with prior expansion zones.
• Detect imbalance areas that later act as resistance/support.
• Enhance confluence with volume, VWAP, or order flow indicators.
⸻
🧩 Customization Tips
• Fib Ratios: You can select or deselect Fibonacci levels from the settings panel. Right now its set to 1.618
• Zone Opacity: Adjust transparency to visualize overlaps better.
• Lookback Range: Control how many historical ranges are plotted for context.
⸻
🏁 Summary
The Candle Range Detector (Fibonacci Mode) transforms traditional range analysis into a visual map of volatility zones.
By using Fibonacci expansion instead of arbitrary multipliers, it synchronizes with natural market rhythm and highlights where liquidity and volatility converge.
NZDCAD WILL GO DOWN|SHORT|
✅NZDCAD trades within the supply level after a corrective pullback, showing signs of distribution. Price is likely to reject this premium area as Smart Money positions short toward the 0.8030 target zone. Time Frame 2H.
SHORT🔥
✅Like and subscribe to never miss a new idea!✅

USD-CHF Bullish Breakout! Buy!
Hello,Traders!
USDCHF breaks above the descending trendline, confirming a bullish shift in market structure. Smart Money likely engineered liquidity below previous lows before expansion, targeting 0.8040$ as the next key objective. Time Frame 7H.
Buy!
Comment and subscribe to help us grow!
Check out other forecasts below too!
Disclosure: I am part of Trade Nation's Influencer program and receive a monthly fee for using their TradingView charts in my analysis.

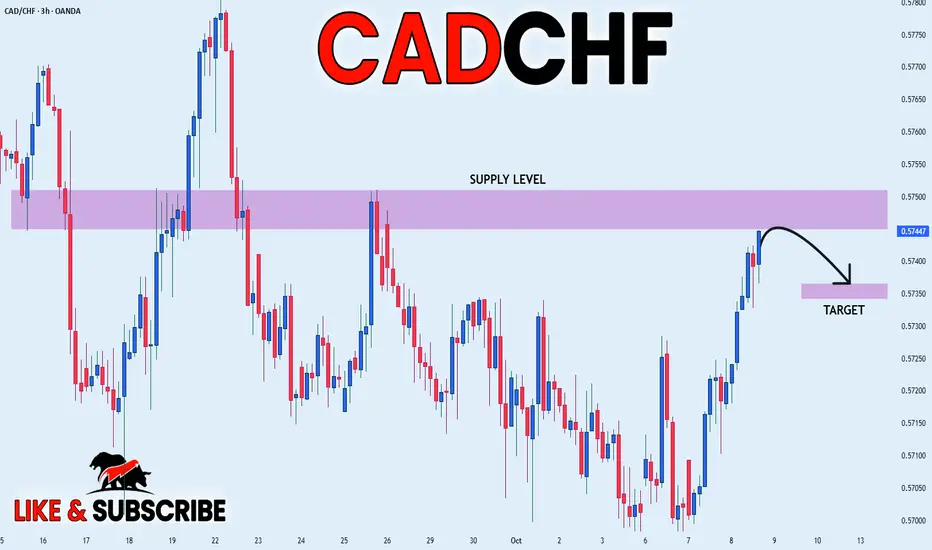
CADCHF SHORT FROM SUPPLY LEVEL|
✅CADCHF is about to retest the supply zone where price previously distributed. Liquidity above equal highs has been engineered, suggesting Smart Money may reprice lower once the zone is mitigated. Time Frame 3H.
SHORT🔥
✅Like and subscribe to never miss a new idea!✅
NZD-CAD Local Short! Sell!
Hello,Traders!
NZDCAD taps into a horizontal supply area after an aggressive bullish move. Price is likely to retrace into premium levels where Smart Money is likely to re-enter shorts, aiming for the 0.8046 target to rebalance inefficiency. Time Frame 3H.
Sell!
Comment and subscribe to help us grow!
Check out other forecasts below too!
Disclosure: I am part of Trade Nation's Influencer program and receive a monthly fee for using their TradingView charts in my analysis.

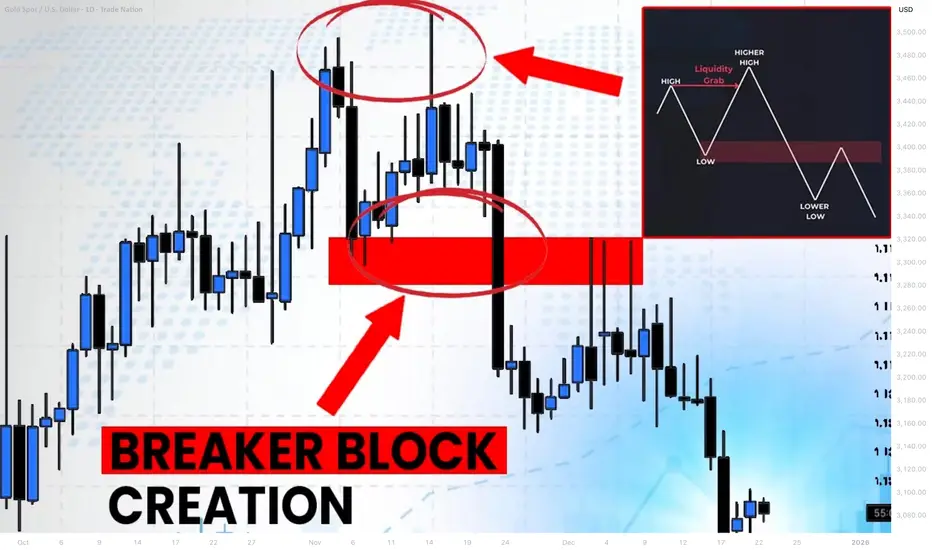
What is Bullish/Bearish Breaker Block & How to Find It Easily
Breaker blocks are easier to find than you think.
In this article, I will share with you very efficient price models for the identification of Order Blocks and Breaker Blocks.
You will learn their meaning, how to draw and use them in trading Smart Money Concepts SMC.
Bullish Trend Model & Breaker Block.
Let's start with an essential theory .
Please, examine a following price model:
In a classic bullish structure where the price consistently updates Higher Highs HH and Higher Lows HH, a bullish order block zone will be the area based on the last Higher How.
I will explain how to draw that zone in the examples below.
In some instances, a bullish order block zone will fail to deliver a bullish wave. Its bearish breakout will follow after its test instead.
It will be a critical event that is called a market structure shift in Smart Money Concepts SMC.
A formation of a new low will signify a violation of a bullish trend and a highly probable change of the market sentiment.
A broken bullish order block zone will turn into a Bearish Breaker Block.
The zone from where the next bearish wave will most likely follow.
It will provide a very safe place to sell from.
Market structure shift in a bullish trend is not a random event.
It usually occurs after a test of a significant supply zone with a liquidity grab.
It can help you to predict the change of the sentiment way before it happens.
That's an example of such a price model on GBPAUD forex pair.
We see a confirmed bullish liquidity sweep in uptrend after a test of a historic supply zone.
A bearish wave followed then and a bullish order block zone was broken.
To draw Order Block Zone, I picked the level of the last higher low as its lower boundary and a low of a body of that candlestick as the upper boundary.
After a breakout, it turned into a Bearish Breaker Block.
A bearish continuation occurred after its test.
Bearish Trend Model & Breaker Block.
Please, check this model:
In a classic bearish structure where the price consistently updates Lower Lows LL and Lower Highs LH, a bearish order block zone will be the area based on the last Lower High.
In some instances, a bearish order block zone will fail to deliver a bearish wave. Its bullish breakout will follow after its test instead.
It will be a significant event that is called a bullish market structure shift in Smart Money Concepts SMC.
A formation of a new high will signify a violation of a bearish trend and a highly probable change of the market sentiment.
A broken bearish order block zone will turn into a Bullish Breaker Block.
The zone from where the next bullish wave will most likely follow.
It will provide a very safe place to buy from.
Market structure shift in a bearish trend is not a random event.
It usually occurs after a test of a significant demand zone with a liquidity grab.
That's a real example of such a price model on WTI Crude Oil.
A bearish structure was violated after a test of a demand zone.
A bearish order block was broken, and it turned into a Bullish Breaker Block Zone then.
(Drawing a bullish order block zone, I picked the level of the last lower high as its upper boundary and a high of a body of that candle as its lower boundary )
A bullish movement followed after a deep test of that.
A proper combination of structure mapping and liquidity analysis will help you to predict a market structure shirt and a breaker block creation before they happen.
The models that I shared will help you to confirm bullish and bearish breaker blocks trading Forex or any other markets with Smart Money Concepts SMC ICT.
❤️Please, support my work with like, thank you!❤️
I am part of Trade Nation's Influencer program and receive a monthly fee for using their TradingView charts in my analysis.
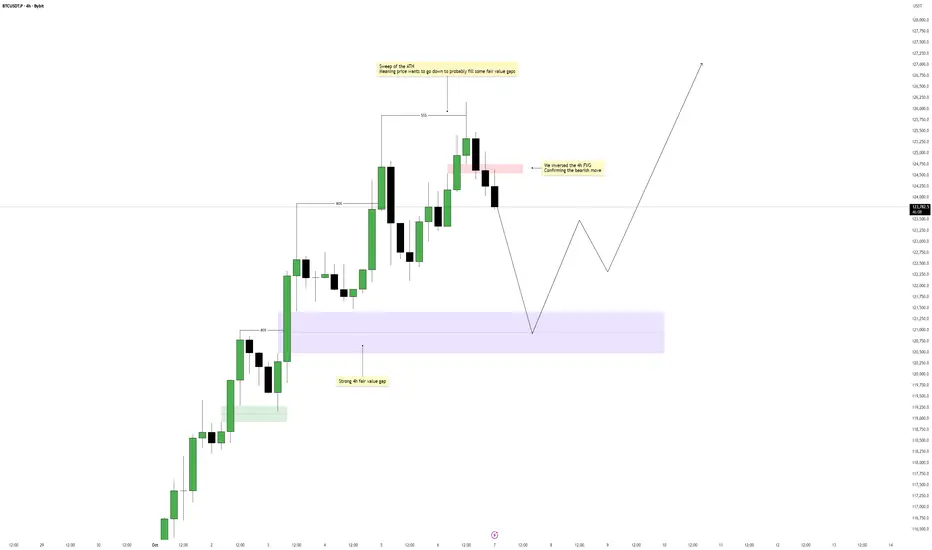
Bitcoin – Short-Term Weakness, Long-Term StrengthBitcoin has recently swept the all-time high, triggering a short-term reaction from liquidity resting above that level. This move often signals that the market has completed its buy-side run and is now seeking to rebalance inefficiencies created during the aggressive push upward. The current structure indicates that price is shifting momentum in the short term, preparing for a deeper retracement before resuming its bullish trajectory.
Imbalance and Structure Shift
Following the liquidity sweep, a clear 4-hour imbalance (IFVG) has formed, acting as the first sign of bearish pressure entering the market. This inefficiency shows that the prior move lacked sufficient counter-orders, meaning price may need to return there to restore balance. The bearish move was further confirmed as price inverted a smaller 4-hour FVG, signaling a potential continuation to the downside in the short term.
Bearish Scenario
If the market continues to respect the newly formed IFVG, we could see a sustained bearish retracement develop. Price may use this imbalance as a draw, seeking to fill deeper inefficiencies left behind during the prior expansion. This corrective phase is not necessarily a trend reversal but rather a short-term redistribution phase before buyers potentially step back in from lower levels.
Bullish Scenario
Once the 4-hour fair value gap below is filled, the market could begin forming a base for a new bullish leg. The liquidity collected from the downside move and the rebalancing of inefficiencies would give price enough fuel for a strong continuation higher. Traders should look for a clean market structure shift or displacement from that demand area as the signal of renewed bullish intent.
Expectations and Outlook
In summary, Bitcoin appears to be in a healthy retracement phase after sweeping liquidity at the highs. The 4-hour imbalance provides a clear short-term target for price to seek, and once filled, the bullish structure could resume. This setup favors patience, waiting for confirmation that the downside rebalancing is complete before anticipating another impulsive rally.
Conclusion
Overall, Bitcoin’s structure suggests a temporary bearish move to fill the 4-hour FVG, followed by a potential bullish continuation once that inefficiency is resolved. Watching how price reacts upon entering that zone will be key in determining whether the next expansion phase begins.
___________________________________
Thanks for your support!
If you found this idea helpful or learned something new, drop a like 👍 and leave a comment, I’d love to hear your thoughts! 🚀
GOLD SHORT FROM ATH 4000$
✅XAUUSD is getting closer to the 4,000$ epic supply level and will soon be forming a potential all-time-high rejection. Liquidity above will be cleared, and Smart Money shows bearish intent toward lower rebalancing levels near 3,920$.
—————————
Entry: 3,982$
Stop Loss: 4,010$
Take Profit: 3,920$
Time Frame: 4H
—————————
SHORT🔥
✅Like and subscribe to never miss a new idea!✅

EUR-USD Will Grow! Buy!
Hello,Traders!
EURUSD taps into a horizontal demand area where Smart Money seeks to accumulate long positions. The strong reaction from discount pricing suggests a probable expansion toward the 1.1700 target level as buy-side liquidity gets cleared. Time Frame 3H.
Buy!
Comment and subscribe to help us grow!
Check out other forecasts below too!
Disclosure: I am part of Trade Nation's Influencer program and receive a monthly fee for using their TradingView charts in my analysis.
