AUD_USD BULLISH BREAKOUT|LONG|
✅AUD_USD is going up
Now and the pair made a bullish
Breakout of the key horizontal
Level of 0.6590 and the breakout
Is confirmed so we are bullish
Biased and we will be expecting
A further bullish move up
LONG🚀
✅Like and subscribe to never miss a new idea!✅
Disclosure: I am part of Trade Nation's Influencer program and receive a monthly fee for using their TradingView charts in my analysis.
Smartmoneyconcepts

GOLD LOCAL LONG|
✅GOLD went down from
The resistance just as I predicted
But a strong support level is ahead at 3380$
Thus I am expecting a rebound
And a move up towards the target of 3400$
LONG🚀
✅Like and subscribe to never miss a new idea!✅
Disclosure: I am part of Trade Nation's Influencer program and receive a monthly fee for using their TradingView charts in my analysis.

NZD-JPY Resistance Ahead! Sell!
Hello,Traders!
NZD-JPY is trading in an
Uptrend but the pair is locally
Overbought so after the pair
Hits the horizontal resistance
Level of 88.900 we will be
Expecting a local bearish
Move down
Sell!
Comment and subscribe to help us grow!
Check out other forecasts below too!
Disclosure: I am part of Trade Nation's Influencer program and receive a monthly fee for using their TradingView charts in my analysis.

CAD-JPY Local Long! Buy!
Hello,Traders!
CAD-JPY made a retest
Of the horizontal support
Level of 107.400 and we
Are already seeing a bullish
Rebound and we will be
Expecting a further local
Bullish move up
Buy!
Comment and subscribe to help us grow!
Check out other forecasts below too!
Disclosure: I am part of Trade Nation's Influencer program and receive a monthly fee for using their TradingView charts in my analysis.

Simple Swing Trading Strategy with Smart Money Concept Explained
I will share with you the essential basics of swing trading forex gold with Smart Money Concepts.
You will learn how to do swing trading with the best SMC strategy.
I will teach you to c ombine order blocks, liquidity zones and imbalances to spot accurate entries and confirmation signals.
If you just started learning swing trading Forex with Smart Money Concepts, I strictly recommend trading with the trend only.
The cases and examples that we will discuss will be strictly trend-following ones.
Swing Trading with SMC in Uptrend
For swing buying any forex pair, we will look for the market that is trading in a bullish trend.
To confirm that the market is rising, you will need to execute structure mapping and find a forex pair that updates Higher Highs HH and Higher Lows HL.
Above is the example how I confirmed that GBPUSD is bullish with structure mapping. You can see that the pair consistently updates the highs.
Once you identified a bullish pair, your next step will be to find the zone from where the next swing move will follow.
According to the rules, the market remains in uptrend till the price is staying above or on the level of the last Higher Low HL.
Here is such a zone on GBPUSD.
It is based on the last Higher Low and current price levels.
We will assume that buying orders will concentrate within that area and from that a bullish rally will follow.
The problem is that this area is extremely wide, and we can not just buy randomly within.
Our next step will be to find liquidity zones within.
To buy, we need demand areas.
I found 4 price action based historic demand zones on GBPUSD.
We will need to wait for the test of one of these zones and then wait for an order block - a place where smart money are placing their buy orders.
The problem is that we don't know in which of these areas the order block is, so we will need to wait for tests of these zones and a consequent imbalance to confirm it.
To confirm a bullish imbalance for swing trading Forex, I recommend analyzing a 4H time frame after a test of a demand zone.
According to Smart Money Concepts, a bullish imbalance can be any sign of strength of the buyers : bullish breakout of a vertical/horizontal resistance, change of character, high momentum bullish candle, bullish price action pattern, etc.
An order block on GBPUSD was confirmed with a breakout of a resistance line of a falling channel on a 4H time frame.
That was the signal that Smart Money are buying, and that is your signal to open a swing long trade.
You place a buy position then with a stop loss below the order block and a target - at least a current high.
Swing Trading with SMC in Downtrend
For swing selling any forex pair, you will need to find a market that is trading in a bearish trend.
I suggest applying structure mapping to identify such a pair.
It simply should update Lower Lows LL and Lower Highs consistently.
USDCAD is trading in a bearish trend.
Structure mapping helps to easily confirm that.
Then, we will need to identify the zone from where the next bearish wave will start.
According to Smart Money Concepts structure mapping rules, the market remains bearish till the price is staying below or on the level of the last Lower High LH.
That's such a zone on USDCAD.
It is based on current prices and the last Lower High.
We will assume that selling orders will be distributed along the entire lenth of our zone.
Of course, we can not sell randomly within that zone because it is relatively extended.
Our next task will be to find liquidity supply zones within.
I found 2 price action based supply zones within our underlined area.
Before we sell, we will need to find an order block.
A place from where smart money are selling big.
To spot that, I suggest waiting for a test of one of our supply zones and wait for a bearish imbalance on a 4H time frame.
According to SMC, a bearish imbalance can be a bearish high momentum candle, a bearish CHoCH, a bearish price action pattern, a bearish breakout of a horizontal/vertical support , etc.
You can see that a lower supply zone was tested on USDCAD.
Our bearish order block confirmation is a bearish Change of Character, a formation of a high momentum bearish candle and a breakout of a rising trend line.
After that we can open a swing sell position and expect a bearish movement at least to a current low.
Stop loss should lie strictly above the order block.
TP should be at least a c urrent low.
That is how a trade should be executed on USDCAD pair.
Remember that there is no guarantee that the order block will be within a liquidity zone. You should learn to track the signs of smart money and their operations.
A proper combination of a trend analysis, liquidity zones and order block is the essential basis of a profitable swing trading Forex.
Mastering that, practice recognizing the imbalances and confirmations for spotting the best swing trading entries.
❤️Please, support my work with like, thank you!❤️
I am part of Trade Nation's Influencer program and receive a monthly fee for using their TradingView charts in my analysis.
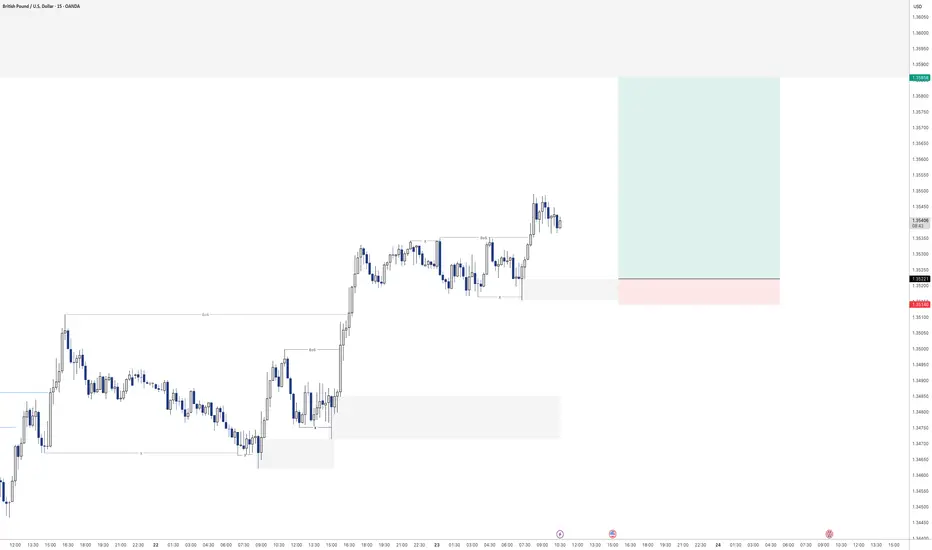
GBPUSD - Buying continuationLooking to keep buying the bullish orderflow on the 15min.
Had a nice sweep of liquidity before creating a new high. Will see how this one plays out over the day
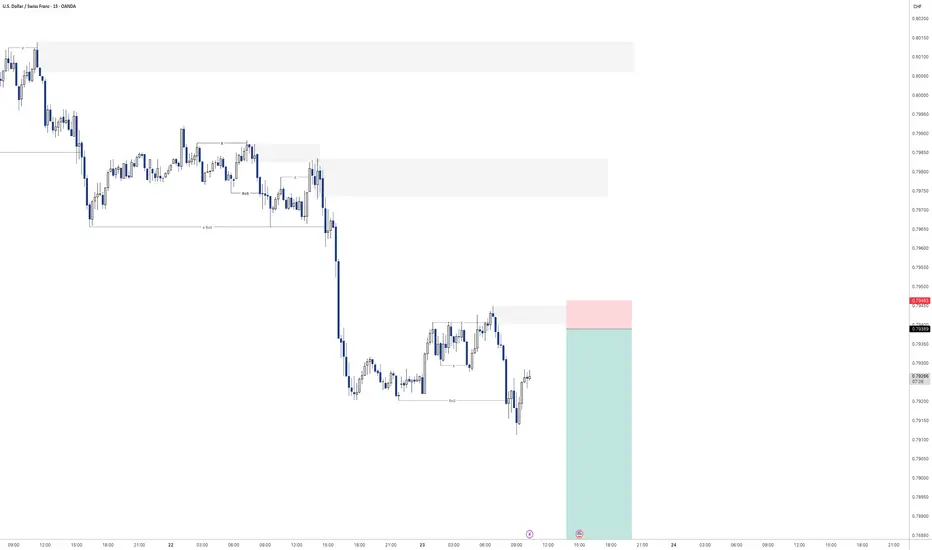
USDCHF - Sell off continuation?Looking for continuation of the selling pressure here on USDCHF
Will see how we play out for the rest of the day
USDJPY 2H Analysis : Trendline Break or Double the Supply?🧠 Market Context:
The market has recently undergone a liquidity grab followed by a temporary bullish reaction, indicating that large players (institutions or market makers) are manipulating price around sensitive zones before committing to a direction.
🧱 Key Technical Zones & Observations:
🟩 1. Liquidity Filled Zone (Smart Money Move)
Location: Around July 17.
Explanation: Price dropped impulsively into a pre-marked liquidity pocket. This filled buy-side liquidity resting below previous lows.
Implication: Smart money has now captured trapped breakout sellers. Expectation of reversal or bullish mitigation.
🟧 2. Central Zone (Supply/Distribution Area)
This zone was tested multiple times, signaling it as a supply-rich region.
Acted as a base for previous strong bearish move.
If the trendline is broken, price may retest this Central Zone, potentially acting as resistance again.
🟩 3. QFL Formation (Quantity Following Line)
Nature: Base breakout with a fast snap-back indicates institutional demand.
The structure signals a failed breakdown or liquidation trap.
Actionable Insight: Strong bounce potential here, ideal for sniper long entries if market structure shifts bullish.
🟦 4. Trendline (Critical Validation Tool)
The descending trendline from July 18 has acted as dynamic resistance.
Multiple rejections validate its significance.
Main Conditional Setup hinges on this trendline:
Break = Bullish structure shift
No break = Trend continuation (retest of demand or breakdown)
🔁 5. Previous Reversal Completed
Price action has printed a reversal model (possibly Wyckoff-style accumulation or spring).
Completion of the pattern aligns with upcoming directional decision.
✅ Conditional Trade Scenarios:
🔺 Condition 1: Bullish Breakout Above Trendline
Setup: Price breaks and closes above the trendline with volume and momentum.
Action: Buy on retest of broken trendline or confirmation candle.
Targets:
Short-term: 147.50
Major: 148.00 – strong resistance/supply zone
Validation: Structure shift + momentum + rejection of prior supply.
🔻 Condition 2: Rejection from Trendline (Trendline Holds)
Setup: Price respects the trendline and fails to break.
Action: Short on bearish engulfing/rejection.
Plan: "Double the supply zone" as per your label.
Targets: 146.20 → 146.00 zone
This respects the previous price memory and liquidity void.
🧠 Deeper MMC Insight:
The market is in indecision phase, balancing between continuation and reversal.
Institutional footprints (QFL + liquidity fills + trendline rejections) suggest preparation for a trap-spring-accumulate or distribution-breakdown move.
Watch for fakeouts around the trendline – MMC logic says market makers often induce both directions before committing.
🧭 Trade Management Tips:
If long: Protect below the QFL base.
If short: Watch for manipulation around the Central Zone.
Wait for confirmation: Don’t pre-enter before structure validates direction.

GOLD SHORT FROM RESISTANCE|
✅GOLD is set to retest a
Strong resistance level above at 3450$
After trading in an uptrend for some time
Which makes a bearish pullback a likely scenario
With the target being a local support below at 3414$
SHORT🔥
✅Like and subscribe to never miss a new idea!✅
Disclosure: I am part of Trade Nation's Influencer program and receive a monthly fee for using their TradingView charts in my analysis.

AUD-JPY Will Grow! Buy!
Hello,Traders!
AUD-JPY already made a
Bullish rebound from the
Strong horizontal support
Of 95.610 and as we are
Bullish biased we will be
Expecting a further bullish
Move up
Buy!
Comment and subscribe to help us grow!
Check out other forecasts below too!
Disclosure: I am part of Trade Nation's Influencer program and receive a monthly fee for using their TradingView charts in my analysis.

XAUUSD Analysis : From Ellipse Demand to Reversal Zone – Target Hello traders!
Let’s decode today’s GOLD setup using the MMC (Mirror Market Concepts) strategy. This is a clean and textbook example of how institutional price delivery works – from demand creation to reversal zones. Let’s go step by step👇
🔵 Previous Ellipse Full Demand – The Accumulation Phase:
The market initially formed an Ellipse structure, which you’ve rightly marked as the Previous Full Demand Zone. This is where smart money started to accumulate long positions after pushing the market into a discounted area.
Price remained inside this ellipse zone for a while, showing slow and controlled price action with multiple rejections from the bottom. This type of price behavior is usually a trap zone, where retail traders are shaken out, and institutions silently build their positions.
💥 FMFR Zone – Where Momentum Begins:
On July 18, a clear FMFR (Fresh Money Flow Reversal) took place. This is the moment where price broke out of the ellipse demand zone with strength.
This FMFR marks the transition from accumulation to markup phase. It signals that the market makers have done their job in collecting liquidity and are now ready to drive price upward.
From this FMFR, the market respected a curved path — a classic MMC parabolic build-up, showing buyer dominance throughout.
📈 One-Time Delivery (OTD) – Clean Impulse:
Following the FMFR, price followed a One-Time Delivery (OTD) move. You’ve marked this beautifully with the vertical box showing the aggressive bullish impulse.
The candles are strong, consecutive, and with minimal pullbacks — a sign that the market is being delivered efficiently by the institutions toward their target.
🟩 Reversal Area – Target Reached:
Price has now entered the Reversal Area (Supply Zone), which was expected based on previous structure and imbalance. The market is reacting to this area already — giving signs of exhaustion.
From an MMC perspective, this is a potential “sell to buy” or “buy to sell” trap zone, where the market could either reverse completely or engineer liquidity before moving again.
⚖️ Central Zone – Balance Area:
Below the current price lies the Central Zone, which is a neutral area where the market may consolidate if it fails to hold higher or reject immediately. This area usually acts as a pause or buffer zone, often seen before the market decides the next leg (up or down).
🔄 Next Reversal Area – Demand Reload Zone:
If price drops, the Next Reversal Area marked below (around the 3,345–3,355 range) will be crucial. This is the zone where you should watch for:
Bullish rejections
FMFR signals
Trap candles (like liquidity wicks)
Expect this area to act as the next “Buy Program”, where institutions might step back in to reload longs.
🧠 Conclusion & Trader Mindset:
✅ Market respected MMC phases: Accumulation ➝ FMFR ➝ Delivery ➝ Reversal
🛑 Currently in a high-probability reaction zone – wait for confirmation before trading.
👁️ Watch how price behaves in the Reversal Area — rejection or continuation?
🔁 If market retraces, Next Reversal Area is your prime hunting zone for long setups.
🔔 Stay Patient – React, Don’t Predict.
Let the market reveal its next move. Whether it’s a pullback to reload longs or a deeper retracement, MMC logic will guide you to stay on the right side.

NZD_JPY RISING SUPPORT AHEAD|LONG|
✅NZD_JPY went down from
The resistance just as I predicted
In my previous analysis but now
The pair is approaching a rising
Support line from where we will
Be expecting a local bullish rebound
LONG🚀
✅Like and subscribe to never miss a new idea!✅
Disclosure: I am part of Trade Nation's Influencer program and receive a monthly fee for using their TradingView charts in my analysis.

GBP_USD RESISTANCE AHEAD|SHORT|
✅GBP_USD has been growing recently
And the pair seems locally overbought
So as the pair is approaching
A horizontal resistance of 1.3520
Price decline is to be expected
SHORT🔥
✅Like and subscribe to never miss a new idea!✅
Disclosure: I am part of Trade Nation's Influencer program and receive a monthly fee for using their TradingView charts in my analysis.

GBP_NZD LOCAL SHORT|
✅GBP_NZD made a retest of the
Local horizontal resistance level of 2.2580
And as you can see the pair is already
Making a local pullback from
The level which sends a clear
Bearish signal to us therefore
We will be expecting a
Further bearish correction
SHORT🔥
✅Like and subscribe to never miss a new idea!✅
Disclosure: I am part of Trade Nation's Influencer program and receive a monthly fee for using their TradingView charts in my analysis.

AUD-CHF Risky Short From Falling Resistance! Sell!
Hello,Traders!
AUD-CHF is trading in a
Downtrend along the falling
Resistance line so we are
Bearish biased and after
The potential retest of the
Falling resistance we will
Be expecting a further
Bearish move down
Sell!
Comment and subscribe to help us grow!
Check out other forecasts below too!
Disclosure: I am part of Trade Nation's Influencer program and receive a monthly fee for using their TradingView charts in my analysis.

CHF-JPY Resistance Ahead! Sell!
Hello,Traders!
CHF-JPY keeps growing in
An uptrend and the pair is
Locally oversold so after the
Retest of the horizontal
Resistance of 186.000
From where we will be
Expecting a local bearish
Pullback on Monday
Sell!
Comment and subscribe to help us grow!
Check out other forecasts below too!
Disclosure: I am part of Trade Nation's Influencer program and receive a monthly fee for using their TradingView charts in my analysis.

NZD_JPY PULLBACK EXPECTED|SHORT|
✅NZD_JPY has been growing recently
And the pair seems locally overbought
So as the pair has approached
A horizontal resistance of 88.900
Price fall is to be expected
SHORT🔥
✅Like and subscribe to never miss a new idea!✅
Disclosure: I am part of Trade Nation's Influencer program and receive a monthly fee for using their TradingView charts in my analysis.

AUD_NZD GROWTH AHEAD|LONG|
✅AUD_NZD fell down sharply
But a strong support level was hit at 1.0910
Thus I am expecting a rebound
And a move up towards the target of 1.0930
LONG🚀
✅Like and subscribe to never miss a new idea!✅
Disclosure: I am part of Trade Nation's Influencer program and receive a monthly fee for using their TradingView charts in my analysis.

EUR-NZD Will Grow! Buy!
Hello,Traders!
EUR-NZD is making a local
Bearish correction while trading
In an uptrend along he rising
Support so after the pair hits
The support line a local bullish
Rebound is to be expected
Buy!
Comment and subscribe to help us grow!
Check out other forecasts below too!
Disclosure: I am part of Trade Nation's Influencer program and receive a monthly fee for using their TradingView charts in my analysis.

NZD-JPY Local Short! Sell!
Hello,Traders!
NZD-JPY has hit a horizontal
Resistance level of 88.851
And we are already seeing
A bearish reaction so we will
Be expecting a local
Bearish move down
On Monday!
Sell!
Comment and subscribe to help us grow!
Check out other forecasts below too!
Disclosure: I am part of Trade Nation's Influencer program and receive a monthly fee for using their TradingView charts in my analysis.

EUR_AUD WILL GROW|LONG|
✅EUR_AUD is trading in an uptrend
With the pair set to retest
The rising support line
From where I think the growth will continue
LONG🚀
✅Like and subscribe to never miss a new idea!✅
Disclosure: I am part of Trade Nation's Influencer program and receive a monthly fee for using their TradingView charts in my analysis.

CAD-JPY Will Keep Growing! Buy!
Hello,Traders!
CAD-JPY keeps trading in
An uptrend and there is a
Rising support below so
We are bullish biased
And we will be expecting
A further bullish move up
Buy!
Comment and subscribe to help us grow!
Check out other forecasts below too!
Disclosure: I am part of Trade Nation's Influencer program and receive a monthly fee for using their TradingView charts in my analysis.

CAD_JPY BULLISH BIAS|LONG|
✅CAD_JPY is trading along
The rising support
And as the pair will soon retest it
I am expecting the price to go up
To retest the supply levels
Above at 108.708
LONG🚀
✅Like and subscribe to never miss a new idea!✅
Disclosure: I am part of Trade Nation's Influencer program and receive a monthly fee for using their TradingView charts in my analysis.
