USD-JPY Free Signal! Sell!
Hello,Traders!
USDJPY a double-top structure has formed near a key supply zone, indicating potential exhaustion of bullish momentum. Smart money may look to reverse liquidity buildup at this level toward lower targets.
-------------------
Stop Loss: 154.459
Take Profit: 153.560
Entry Level: 154.102
Time Frame: 2H
-------------------
Sell!
Comment and subscribe to help us grow!
Check out other forecasts below too!
Disclosure: I am part of Trade Nation's Influencer program and receive a monthly fee for using their TradingView charts in my analysis.
Smartmoneyconcepts

USD-CHF Supply Level Above! Sell!
Hello,Traders!
USDCHF Price is approaching a horizontal supply area but hasn’t confirmed a retest yet. Smart money may seek liquidity sweep above before reacting lower toward the target zone. Time Frame 4H.
Sell!
Comment and subscribe to help us grow!
Check out other forecasts below too!
Disclosure: I am part of Trade Nation's Influencer program and receive a monthly fee for using their TradingView charts in my analysis.

EUR-AUD Bullish Bias! Buy!
Hello,Traders!
EURAUD Price has tapped into a clean horizontal demand area after an extended bearish leg. Smart money shows absorption of sell-side liquidity, hinting at a potential short-term bullish move toward the target.
-------------------
Stop Loss: 1.7580
Take Profit: 1.7660
Entry Level: 1.7624
Time Frame: 4H
-------------------
Buy!
Comment and subscribe to help us grow!
Check out other forecasts below too!
Disclosure: I am part of Trade Nation's Influencer program and receive a monthly fee for using their TradingView charts in my analysis.

NZD-USD Long From Demand Area! Buy!
Hello,Traders!
NZDUSD tapped into a horizontal demand area with strong rejection wicks. Expecting a short-term bullish reaction toward the next liquidity pocket at the target level.Time Frame 2H.
Buy!
Comment and subscribe to help us grow!
Check out other forecasts below too!
Disclosure: I am part of Trade Nation's Influencer program and receive a monthly fee for using their TradingView charts in my analysis.

AUDNZD FREE SIGNAL|SHORT|
✅AUDNZD is reacting from a clear supply level, showing early rejection wicks and loss of momentum. A short-term bearish leg is expected toward the nearest imbalance before potential continuation.
—————————
Entry: 1.1433
Stop Loss: 1.1445
Take Profit: 1.1410
Time Frame: 3H
—————————
SHORT🔥
✅Like and subscribe to never miss a new idea!✅

GBP-CAD Free Signal! Sell!
Hello,Traders!
GBPCAD formed a double-top around a horizontal supply area, showing clear distribution signs. Expecting continuation lower as liquidity under recent equal lows becomes the next draw.
-------------------
Stop Loss: 1.8436
Take Profit: 1.8325
Entry: 1.8392
Time Frame: 5H
-------------------
Sell!
Comment and subscribe to help us grow!
Check out other forecasts below too!
Disclosure: I am part of Trade Nation's Influencer program and receive a monthly fee for using their TradingView charts in my analysis.

EUR-USD Bearish Breakout! Sell!
Hello,Traders!
EURUSD has broken below the horizontal supply area, confirming a bearish structure shift. A short-term pullback could provide premium entries toward the next liquidity pool below.Time Frame 4H.
Sell!
Comment and subscribe to help us grow!
Check out other forecasts below too!
Disclosure: I am part of Trade Nation's Influencer program and receive a monthly fee for using their TradingView charts in my analysis.

NIKE — $31–$11 bottom | Before SuperCycle Wave 3 hits ~$1000⚡ NKE: Micro Wave 4 Bounce Before the Final Flush 👟🔥
Nike ( NYSE:NKE ) has been in a SuperCycle Wave (2) correction since topping near $179 in 2021. This isn’t a collapse — it’s a structured reset that should run into 2027 , forming a large ABC correction before the next SuperCycle Wave (3) bull phase begins.
Right now, price action is inside a micro Wave 4 move within the ongoing Wave A. Micro waves 1, 2, and 3 have completed, and waves A and B of this current wave 4 are also done. What’s likely next is a short-term bounce toward $82 , where equal highs and liquidity sit, before a final Wave 5 decline finishes Wave A around the 0.236 Fibonacci retracement near $31 .
From there, expect a Wave B rebound followed by Wave C down toward the 0.382 retracement around $11 , which could complete the full SuperCycle Wave (2) correction. That zone may become the macro accumulation area ahead of the next explosive SuperCycle rally.
The $82 region aligns with a liquidity grab in Smart Money terms — a trap for breakout buyers before price descends into the deeper $31–$50 institutional value range , matching demand zones from 2016–2018.
This phase is less about panic and more about patience. Once the 2021–2027 correction ends, Nike could begin a multi-year rally that redefines its valuation.
The swoosh isn’t breaking — it’s recharging for its next leap. 👟⚡
#NKE #Nike #ElliottWave #SmartMoneyConcepts #WaveTheory #Fibonacci #PriceAction #MarketCycle #TechnicalAnalysis #TradingViewAnalysis #StocksToWatch

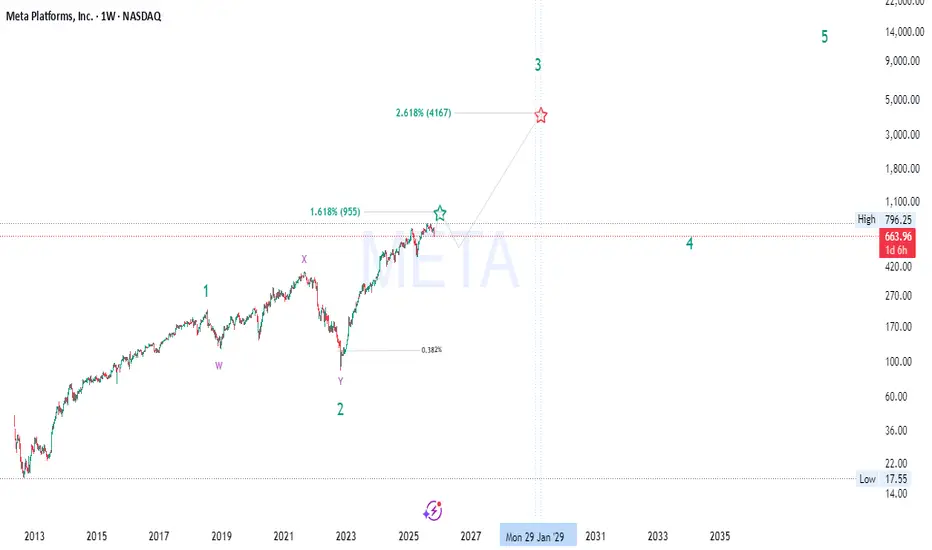
META’s Hidden Fibonacci Path to 4000+ — Don’t Miss Wave 3🚀 META Long-Term Elliott Wave + Smart Money Macro Outlook
🌊 Elliott Wave Structure (662→955→4000+)
META appears to be progressing through a major impulsive 5-wave supercycle on the weekly timeframe:
Wave 1: The initial breakout from accumulation (2015–2021), fueled by growth in advertising dominance and metaverse expansion narratives.
Wave 2: Deep corrective W–X–Y structure into the 2022 low around $90 — a classic multi-year liquidity sweep and re-accumulation phase.
Wave 3 (in progress): This is typically the strongest and most extended wave , with Fibonacci projections aligning near the 2.618 extension ≈ $4,160 , targeting 2028–2029 based on current momentum.
Wave 4: Expected to form a macro re-distribution or range between ~$900–$1,000 before the final parabolic Wave 5, likely extending toward $10K+ .
💡 Wave Confluence:
1.618 Fib extension of Wave 1 → Wave 3 aligns around $955 , acting as the first major resistance (and your current high zone).
2.618 Fib extension → next macro target $4,160 , confirming bullish impulsive momentum.
🧠 Smart Money Concepts (SMC)
The 2022–2023 bottom represents a “Displacement + Re-accumulation” phase , with institutions absorbing liquidity beneath previous demand zones.
Current price action (mid-2025) shows a premium range reaction , where smart money is likely taking partial profits before the next accumulation leg.
Expect a retracement into the 0.382–0.5 Fib zone ($420–$500) to rebalance inefficiencies before continuation toward macro Wave 3 targets.
Key Reaccumulation Zone: $420–$500 — watch for BOS (Break of Structure) confirmation and liquidity sweeps below equal lows.
🔍 Fibonacci Alignment
0.382 retrace marks ideal Wave 4 re-entry.
1.618 & 2.618 extensions align perfectly with the Wave 3 and 5 confluences — textbook impulsive expansion.
Each extension zone has been confirmed with prior liquidity sweeps and displacement candles, increasing Fibonacci reliability 📈.
📊 Market Structure & Price Action
META maintains a strong bullish market structure of Higher Highs (HH) and Higher Lows (HL) since 2023.
The recent 9% correction (-$69) is likely a short-term liquidity grab — not structural weakness.
As long as price holds above $420 , macro bullish market structure remains intact.
Volume profile shows heavy accumulation between $300–$450 , suggesting smart money is still positioned long-term bullish.
💰 Fundamental Confluence
META’s fundamentals are catching up with technicals:
Massive AI CapEx and ad recovery boosting EPS growth 📊
Metaverse burn rate shrinking , improving profitability
Share buybacks providing a floor for price corrections
Macro environment supports tech leadership rotation , and META remains a key beneficiary of the AI + social data synergy cycle 🔄
🔮 Market Cycle View
We’re entering the “Expansion Phase” of the broader innovation cycle.
2018–2022 = Accumulation/Disbelief
2023–2025 = Early Markup / Smart Money Entry
2025–2029 = Public Participation Phase (Wave 3) 💥
Post-2029 = Euphoria / Distribution (Wave 5) 😱
⚙️ Key Levels to Watch
Support Zones: $420 – $500 (Wave 4 re-entry)
Resistance Levels: $955 → $4,160 (Wave 3 targets)
Invalidation: Sustained break below $300 on weekly close
📈 Summary
META remains one of the strongest macro bullish charts in big tech — with perfect alignment across Elliott Wave, SMC, Fibonacci , and fundamental cycle theory .
We’re currently witnessing the mid-phase of Wave 3 , with institutional repositioning before the next vertical leg. Patience and precision around the reaccumulation zone ($420–$500) could provide the golden setup before the next expansion wave 🚀🌕
#META #ElliottWave #SmartMoneyConcepts #Fibonacci #Wave3 #BullMarket #AIStocks #TechnicalAnalysis #TradingView
NZDUSD FREE SIGNAL|LONG|
✅NZDUSD Price bounced from the demand level after a liquidity sweep below the lows, confirming bullish order flow continuation toward the upper range.
—————————
Entry: 0.5762
Stop Loss: 0.5748
Take Profit: 0.5788
Time Frame: 2H
—————————
LONG🚀
✅Like and subscribe to never miss a new idea!✅

GBPAUD RISKY LONG|
✅GBPAUD Price created a triple-bottom formation at discount levels, signaling strong bullish rejection from demand. Expect a short-term rally targeting liquidity above the recent highs. Time Frame 2H.
LONG🚀
✅Like and subscribe to never miss a new idea!✅

AUDUSD – corrective math in motion.Price retraces into the prior order block that broke structure, completing a textbook ABC correction inside a premium zone. Liquidity pools just above IDM hint at a sweep before continuation toward 0.63.
Strengths :
Confluence between wave symmetry, premium retracement, and liquidity structure. Clear invalidation point above IDM keeps risk defined.
Weaknesses :
AUD fundamentals (RBA policy shifts, USD softness) could disrupt structure-based setups. No confirmed momentum shift yet on lower timeframes — patience required.
SmellyTaz — decoding chaos .

ADAUSDT — Dual Wave ConfluenceTwo independent cycles now point to the same liquidity zone.
The wine wave (macro) has entered its BC retracement phase, and its BC target aligns perfectly with the green micro-wave’s C-target , forming a rare dual confluence at the same level. This overlap creates a liquidity magnet — a structural point where both wave systems expect equilibrium before a bullish expansion.
Price is currently reacting inside the BC demand zone , finalizing the correction before expansion toward the macro C projection at 0.7575 .
The alignment between both scales confirms that momentum and liquidity are synchronized for continuation.
Strengths :
Perfect alignment of macro BC and micro C targets
Discount entry within structural demand
Defined invalidation below BC low
High asymmetric RR toward 0.7575
Weaknesses :
Requires bullish displacement confirmation from demand zone
Possible short-term inducement before expansion
Invalidation if structure breaks below BC
Bias : Bullish continuation
Target : 0.7575 (macro C projection zone)

ASTER — OB Tap → WCL Retrace → Macro DownASTER is forming a clean ABC correction within a larger bearish structure. Price hasn’t yet tapped the order block — I expect a final dip to complete the C-leg before retracing toward the WCL zone. From there, the broader bearish wave should resume.
However, if Bitcoin continues its upward expansion, correlations could invalidate this structure and pull ASTER higher, overriding the current wave bias.
High-timeframe trend stays bearish, but intent always belongs to the present.
Strengths:
• Fractal alignment between macro and micro waves.
• Logical liquidity flow between OB and WCL.
• Flexible bias — corrective long, then macro short continuation.
Weaknesses:
• Requires precise OB tap and strong reaction.
• Bitcoin-driven expansion could neutralize bearish context.
• LTF volatility may distort confirmation signals.
SmellyTaz — decoding chaos

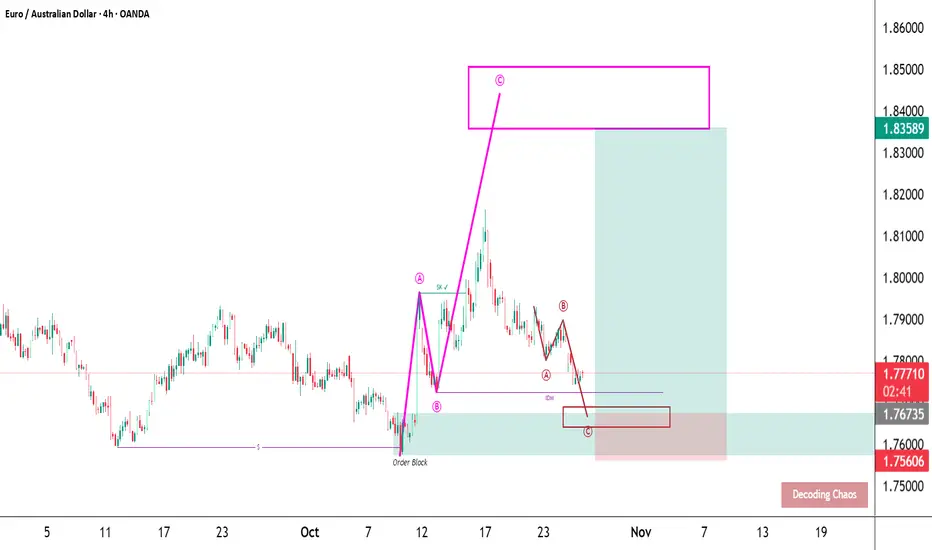
EURAUD – structure breathes in waves.Price retraces toward a clean order block within a discount zone after a strong impulsive leg. Correction is forming a precise ABC pattern, likely to complete near 1.767 before the next wave resumes toward 1.835.
Strengths:
Wave symmetry, confluence with order block, and IDM liquidity structure all align. Setup maintains bullish context from higher timeframe while defining risk clearly below C.
Weaknesses:
Momentum confirmation pending; daily RSI could signal exhaustion if recovery stalls. EUR fundamentals remain sensitive to data shocks that can distort technical structure.
SmellyTaz — decoding chaos.
GBP-NZD Will Go Down! Sell!
Hello, Traders!
GBPNZD broke the ascending trendline, confirming a structural shift to bearish order flow. Price has already mitigated the last bullish candle before the drop, creating an optimal entry zone for continuation lower. Time Frame 4H.
Sell!
Comment and subscribe to help us grow!
Check out other forecasts below too!
Disclosure: I am part of Trade Nation's Influencer program and receive a monthly fee for using their TradingView charts in my analysis.

EURAUD FREE SIGNAL|LONG|
✅EURAUD is reacting from the higher-timeframe demand area after engineering liquidity beneath recent equal lows. The impulsive bullish candle confirms a shift in market structure, signaling intent to retrace toward the inefficiency gap above 1.7780.
—————————
Entry: 1.7749
Stop Loss: 1.7724
Take Profit: 1.7780
Time Frame: 4H
—————————
LONG🚀
✅Like and subscribe to never miss a new idea!✅

EURCHF Free Signal! Buy!
Hello, Traders!
EURCHF SMC-based setup shows price respecting the horizontal demand area after internal liquidity was swept. A bullish displacement confirms a potential move toward higher liquidity above the previous swing high.
-------------------
Stop Loss: 0.9251
Take Profit: 0.9276
Entry: 0.9262
Time Frame: 2H
-------------------
Buy!
Comment and subscribe to help us grow!
Check out other forecasts below too!
Disclosure: I am part of Trade Nation's Influencer program and receive a monthly fee for using their TradingView charts in my analysis.

SILVER LIKELY TO GO HIGHER|LONG|
✅SILVER is currently trading within a bullish dealing range between the demand and supply areas. After engineering liquidity beneath internal equal lows, strong displacement confirms bullish order flow. Expect continuation toward external liquidity above 50.50$. Time Frame 4H.
LONG🚀
✅Like and subscribe to never miss a new idea!✅

GOLD Strong Bullish Bias! Buy!
Hello,Traders!
GOLD has made a strong correction last week but found a liquidity pool at the lower levels, and we are seeing a local accumulation phase. Then a bullish breakout is likely with the price moving towards the higher liquidity levels again following a strong uptrend!
Buy!
Comment and subscribe to help us grow!
Check out other forecasts below too!
Disclosure: I am part of Trade Nation's Influencer program and receive a monthly fee for using their TradingView charts in my analysis.

AUDCHF CLOSING THE GAP|SHORT|
✅AUDCHF After engineering liquidity below the previous low, price is now retracing into the imbalance created during the impulsive move up. The market is likely to close the fair value gap and resume bearish order flow. Time Frame 4H.
SHORT🔥
✅Like and subscribe to never miss a new idea!✅

NZD-CHF Local Short! Sell!
Hello,Traders!
NZDCHF tapped into a horizontal supply area, showing signs of rejection after a liquidity grab above previous highs. Smart Money likely distributing before a move toward the next target zone.Time Frame 3H.
Sell!
Comment and subscribe to help us grow!
Check out other forecasts below too!
Disclosure: I am part of Trade Nation's Influencer program and receive a monthly fee for using their TradingView charts in my analysis.

NZDJPY GROWTH AHEAD|LONG|
✅NZDJPY has reacted from a clean demand level after engineering sell-side liquidity beneath equal lows. Market structure shifted bullish with displacement confirming a potential continuation phase. Time Frame 5H.
LONG🚀
✅Like and subscribe to never miss a new idea!✅
