GBPAUD FREE SIGNAL|SHORT|
✅GBPAUD ran buy-side into 4H supply and delivered a sharp rejection, confirming bearish displacement. With order flow shifting lower, price is expected to seek sell-side liquidity at the marked target.
—————————
Entry: 2.0307
Stop Loss: 2.0351
Take Profit: 2.0240
Time Frame: 4H
—————————
SHORT🔥
✅Like and subscribe to never miss a new idea!✅
SMC-ICT

GBPUSD MOVE DOWN AHEAD|SHORT|
✅GBPUSD is retracing into 2H supply after a clean sell-side sweep. A rejection here would confirm bearish displacement, opening the way for price to seek sell-side liquidity at the marked target zone.Time Frame 2H.
LONG🚀
✅Like and subscribe to never miss a new idea!✅

GBPCHF SUPPLY AREA AHEAD|SHORT|
✅GBPCHF is approaching the 4H supply where buy-side liquidity sits. A rejection from this zone could trigger bearish displacement, sending price lower toward the sell-side liquidity resting at the marked target level. Time Frame 4H.
LONG🚀
✅Like and subscribe to never miss a new idea!✅

USOIL BEARISH BIAS|SHORT|
✅CRUDE OIL rejected the 3H supply after taking buy-side liquidity, producing strong bearish displacement. With order flow turning lower, price is likely to seek the sell-side liquidity resting at the marked target zone. Time Frame: 3H
LONG🚀
✅Like and subscribe to never miss a new idea!✅

AUDNZD FREE SIGNAL|SHORT|
✅AUDNZD rejected the 2H supply after taking buy-side liquidity, showing bearish displacement. With order flow shifting lower, price is likely to target the sell-side liquidity resting at the marked demand zone.
———————————
Entry: 1.1510
Stop Loss: 1.1524
Take Profit: 1.1490
Time Frame: 2H
———————————
SHORT🔥
✅Like and subscribe to never miss a new idea!✅

GBP-CHF Free Signal! Sell!
Hello,Traders!
GBP-CHF is reacting inside the horizontal supply after collecting buy-side liquidity. Bearish displacement suggests sellers may take control, targeting the sell-side liquidity resting at the TP zone.Time Frame 3H.
--------------------
Stop Loss: 1.0626
Take Profit: 1.0555
Entry: 1.0598
Time Frame: 4H
--------------------
Sell!
Comment and subscribe to help us grow!
Check out other forecasts below too!
Disclosure: I am part of Trade Nation's Influencer program and receive a monthly fee for using their TradingView charts in my analysis.

EURJPY WILL GROW|LONG|
✅EURJPY tapped the 2H demand, sweeping sell-side liquidity and showing early bullish displacement. If demand holds, price may retrace upward toward the buy-side liquidity resting at the marked target zone. Time Frame 2H.
LONG🚀
✅Like and subscribe to never miss a new idea!✅

GOLD FREE SIGNAL|LONG|
✅GOLD respected the local demand after sweeping sell-side liquidity, showing bullish displacement. With short-term order flow shifting upward, price may aim for the buy-side liquidity resting at the higher supply zone.
—————————
Entry:4,071$
Stop Loss: 4,030$
Take Profit: 4,135$
Time Frame: 2H
—————————
LONG🚀
✅Like and subscribe to never miss a new idea!✅

EURUSD PULBACK AHEAD|SHORT|
✅EURUSD rejected the 4H supply after taking buy-side liquidity, showing strong bearish displacement. With order flow shifting lower, price is expected to target the sell-side liquidity resting at the marked zone. Time Frame 4H.
LONG🚀
✅Like and subscribe to never miss a new idea!✅

NZDCAD BEARISH BIAS|SHORT|
✅NZDCAD NZDCAD rejected the 2H supply after collecting buy-side liquidity, forming strong bearish displacement. With order flow shifting lower, price is expected to drive toward the sell-side liquidity at the marked target zone. Time Frame: 2H
SHORT🔥
✅Like and subscribe to never miss a new idea!✅

EURUSD Approaching a Key Demand Zone After Structural BreakAfter the EURUSD broke an important structure on the H1 timeframe, the recent downward movement appears to be driven by a clear intention to capture the liquidity resting below the previous swing low of the bearish structure. This type of price behavior is typical when the market seeks to collect orders before deciding its next larger directional move.
Despite this short-term weakness, the pair is still respecting the overall bullish structure on the Daily timeframe, which means the downward pressure we are seeing may simply be a deeper corrective phase within the broader uptrend.
At the moment , a potential reaction could occur around the 1.14943 level. However, from my perspective, any bounce from this zone is expected to be relatively weak, as the price still seems drawn toward the deeper liquidity pool sitting near 1.14693, which represents an important daily low as well as an area where many traders are likely positioned.
If the market continues pushing lower into this Zone, I will be closely reassessing the pair from the Daily timeframe to determine whether the bullish structure will continue to hold and provide a new long opportunity, or whether the pair is preparing for a more meaningful structural shift to the downside.
Overall, this area will be crucial for understanding the next major move, especially considering how price has been aggressively clearing liquidity pockets during the recent decline.

EURNZD LOCAL SHORT|
EURNZD retested a premium supply zone again and we are already seeing a strong rejection, so we are bearish biased and we will be expecting a move down.Time Frame 2H.
SHORT🔥
✅Like and subscribe to never miss a new idea!✅

EURUSD 19 Nov – Bullish Structure IntactEURUSD remains in a bullish structure, as the low at 1.15629 has not been broken yet. This increases the likelihood that the level will hold, with a potential price reaction around 1.15665, which also aligns with a downtrend line that has recently been broken
If buyers step in, the first target would be a break above 1.15972
Whether the pair will continue higher beyond that level will depend on the market’s reaction once the price reaches this zone.

EURJPY FREE SIGNAL|LONG|
✅EURJPY broke cleanly above the key level with strong bullish displacement, confirming a shift in orderflow. A retracement into the breakout zone can offer premium entry before targeting the inefficiency above.
—————————
Entry: 180.071
Stop Loss: 179.785
Take Profit: 180.499
Time Frame: 2H
—————————
LONG🚀
✅Like and subscribe to never miss a new idea!✅

NZDCHF STRONG BREAKOUT|LONG|
✅NZDCHF broke above the 2H demand, taking sell-side liquidity and showing strong bullish displacement. With structure shifting upward, price is likely to extend toward the buy-side liquidity resting at the marked target zone.Time Frame 2H.
LONG🚀
✅Like and subscribe to never miss a new idea!✅

USDJPY LOCAL LONG|
✅USDJPY is retracing into the 2H demand after sweeping sell-side liquidity. With bullish displacement intact, price is expected to react from demand and expand upward toward the buy-side liquidity at the marked target zone. Time Frame 2H.
LONG🚀
✅Like and subscribe to never miss a new idea!✅

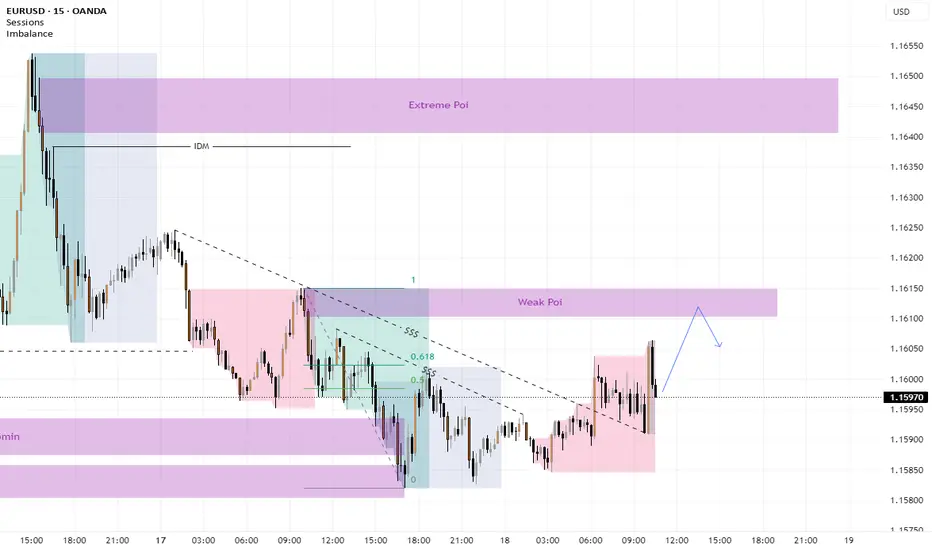
EURUSD 18 Nov – Reversal PossibilityEURUSD may decline from the 1.16104 level, but a clear rejection signal is required before considering any sell position. The pair could still continue pushing higher to capture more liquidity, potentially reaching the Extreme Orderblock around 1.16407.
This upper zone is expected to act as a strong selling area, and a reaction from that level could initiate a deeper bearish move.
XAUUSD 18 Nov – CHoCH PotentialGold may potentially rebound after a CHoCH (Change of Character), as it left a significant liquidity void during the recent decline. If this scenario plays out, a rebound could occur from the 4017.16 zone, targeting 4139.95.
Should price reach this level quickly, it would create another liquidity void, providing a potential short-selling opportunity if a bearish reaction forms from that area.

EURUSD 18 Nov – Bullish SetupEURUSD may potentially rise from the 1.15763 level, which aligns with the recent break of the overall downtrend, targeting the Extreme imbalance zone.
The optimal entry would be confirmed by a 1-hour candle close inside the order block, accompanied by a clear rejection signal or a change in market structure, both of which would provide strong confluence for a bullish trade.

US30 FREE SIGNAL|LONG|
✅US30 taps a key demand zone after a clean liquidity sweep, signaling potential displacement higher. If bullish orderflow sustains, a premium retracement toward the target zone is likely.
—————————
Entry: 46,590
Stop Loss: 46,408
Take Profit: 46,808
Time Frame: 4H
—————————
LONG🚀
✅Like and subscribe to never miss a new idea!✅

TESLA FREE SIGANL|SHORT|
✅TESLA Price reacts off a premium-priced supply block, showing bearish displacement and a clean break in structure. Retracement into the imbalance may fuel continuation lower.
—————————
Entry: 408.98$
Stop Loss: 424.00$
Take Profit: 392.00$
Time Frame: 4H
—————————
SHORT🔥
✅Like and subscribe to never miss a new idea!✅

GOLD BEARISH BREAKOUT|SHORT|
✅ XAUUSD broke cleanly below the 4H supply after taking buy-side liquidity. With displacement confirming bearish order flow, price is expected to target the sell-side liquidity pool near the marked zone. Time Frame 4H.
LONG🚀
✅Like and subscribe to never miss a new idea!✅

AUDCAD RISKY LONG|
✅AUDCAD is sliding into a clean demand zone where liquidity rests below recent lows. Expect a reaction as price taps this imbalance. Targeting a retracement toward the marked FVG before continuation. Time Frame 2H.
LONG🚀
✅Like and subscribe to never miss a new idea!✅
