GOLD Free Signal! Sell!
Hello,Traders!
GOLD SMC based setup forming after price mitigated the horizontal supply area and showed clear rejection. Smart money is likely offloading long positions here before targeting liquidity below recent equal lows.
-------------------
Stop Loss: 4,188$
Take Profit: 4,093$
Entry: 4,139$
Time Frame: 3H
-------------------
Sell!
Comment and subscribe to help us grow!
Check out other forecasts below too!
Disclosure: I am part of Trade Nation's Influencer program and receive a monthly fee for using their TradingView charts in my analysis.
SMC

EUR-GBP Local Short! Sell!
Hello, Traders!
EURGBP tapped a key supply area after a liquidity grab, signaling potential smart money distribution. Expect bearish reaction and continuation toward the target level as price seeks balance after inefficiency.
Time Frame 3H.
Sell!
Comment and subscribe to help us grow!
Check out other forecasts below too!
Disclosure: I am part of Trade Nation's Influencer program and receive a monthly fee for using their TradingView charts in my analysis.

GBPAUD FREE SIGNALS|LONG|
✅GBPAUD Price has reached a key discount zone tapping into a high-probability demand area. Smart money could now be accumulating long positions, anticipating a shift in structure toward the next liquidity draw above recent highs.
—————————
Entry: 2.0450
Stop Loss: 2.0425
Take Profit: 2.0481
Time Frame: 2H
—————————
LONG🚀
✅Like and subscribe to never miss a new idea!✅

USD-CAD Free Signal! Buy!
Hello,Traders!
USDCAD Price is reacting from a well-defined horizontal demand area where previous sell-side liquidity was swept. Smart money may now be accumulating long positions for a bullish push toward the next liquidity pool.
-------------------
Stop Loss: 1.3975
Take Profit: 1.4020
Entry: 1.3995
Time Frame: 3H
-------------------
Buy!
Comment and subscribe to help us grow!
Check out other forecasts below too!
Disclosure: I am part of Trade Nation's Influencer program and receive a monthly fee for using their TradingView charts in my analysis.

NZDUSD LOCAL SHORT|
✅NZDUSD is currently trading inside a premium zone within a key supply area, where liquidity above previous highs has likely been engineered. A shift in market structure from here could confirm a short setup toward the next draw on liquidity. Time Frame 2H.
SHORT🔥
✅Like and subscribe to never miss a new idea!✅

EURCAD - Bounce Play at the Rail!EURCAD has been respecting its ascending channel beautifully , bouncing between the rails like clockwork. And right now, price is once again retesting the lower trendline, where buyers have consistently stepped in before launching new bullish waves.
🏹As long as this trendline and minor support around 1.62 hold firm, I’ll be watching closely for bullish rejections or reversal patterns to confirm a fresh leg upward. A clean bounce from here could send price back toward the orange structure zone around 1.6350, followed by a potential push toward 1.64+ if momentum builds up.
⚔️However, a break and close below 1.6180 would invalidate the setup and could shift control back to the bears — but until that happens, the path of least resistance remains to the upside.
In short, I’m expecting EURCAD to trap late sellers and fuel another rebound from the channel’s base, the kind of move that rewards patience and precision.
📊 All Strategies Are Good; If Managed Properly!
~Richard Nasr

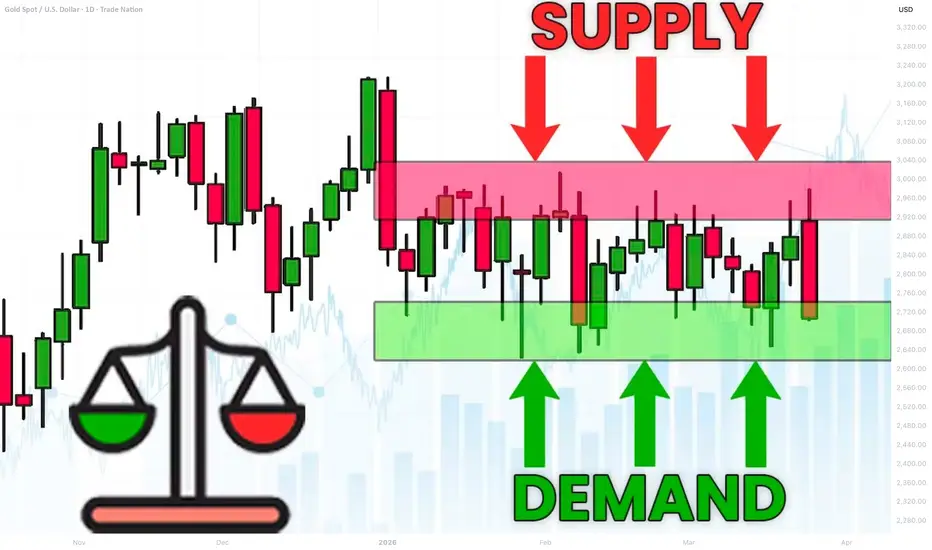
What is Equilibrium in SMC. Balance and Imbalance in Forex Gold
Equilibrium is one of the core elements for understanding market liquidity.
In this article, we will go through the essential basics of liquidity in Forex trading with Smart Money Concepts SMC.
You will learn the interconnections between supply and demand and I will explain how to easily identify balance and imbalance on any market.
Let's start our discussion with understanding how forex pairs move.
The price of an asset goes up if the market demand is stronger than the market supply. The excess of buying activity make the markets update the highs. In smart money concepts, such an event will also be called a buying imbalance.
Look at a strong bullish rally on Gold.
The price is going up because of a buying imbalance.
A strong buying activity creates a massive amount of buyers with unfilled orders.
To entice sellers to start selling, they must offer a higher-better price.
At the same time, if the price of an asset goes down , it means that the market supply is stronger than a demand. The excess of supply will make the markets update the lows. In smc, it will be called a selling imbalance.
That is exactly what is happening with GBPUSD forex pair.
A strong selling activity and the shortage of demand makes the price go down.
The excess of supply or demand on the market can not be eternal.
The lower the price becomes, the more buyers will start buying, and the more sellers will start closing their positions.
At some moment, the surplus of supply will be absorbed by the buyers.
That will be a moment when the market will find equilibrium , the balance between supply and demand.
A strong bearish imbalance on USDJPY made the price drop significantly.
The falling price made 3 things:
It attracted more buyers, because the lower the price the more profitable is buying USDJPY.
It discouraged some buyers from buying, considering that the price is already "too low".
It encouraged some buyers to close their positions in profit.
Because of that, USDJPY stopped falling and found a balance in supply and demand. That is what we call Equilibrium .
In a bull run, the higher the price will go, the more sellers will start selling.
At some moment, buying imbalance will be absorbed by the bears and supply & demand will eventually balance.
Such an event will be called the equilibrium .
EURGBP was rallying strongly.
The higher the price went, the more sellers started to sell, considering selling the pair more and more profitable.
And the same time, fewer buyers were buying and the more started to close their buy positions in profits.
At some moment, the entire excess of the market demand was absorbed by a supply. The market stopped growing and equilibrium was found.
One of the main characteristics of a market equilibrium is sideways price movement and a termination of a formation of new highs or new lows.
Usually, such a sideways price action will form a horizontal range.
That's a real example how a CAD JPY pair found an equilibrium after an extended bearish movement. A formation of a horizontal range confirmed a balance between a supply and a demand.
Please, note that these ranges will form on any time frame that you analyse.
The rule is that the higher is the time frame of the range, the stronger is the market equilibrium.
Above, I have 3 different charts:
USDJPY on a daily time frame, EURJPY on a 4H and GBPUSD on 15 minutes.
All the pairs found an equilibrium in horizontal ranges.
An equilibrium on USDJPY will signify intra week or even intra month balance,
while on EURJPY it will mean intraday/intra week balance.
On GBPUSD, it will signify intraday equilibrium.
Market equilibrium can not last forever.
Fundamentals news and changing market conditions, make the market participants constantly reassess a fair value of an asset.
A violation of the range and a breakout of one of its boundaries will be a trigger of an occurrence of an imbalance .
A bullish violation of the upper boundary of the range will signify a buying imbalance and a highly probable rise to the new highs.
While a bearish violation of the lower boundary of the range will mean a selling imbalance and a highly probable fall to the new lows.
Please, study how GBPCHF was moving for a week on an hourly time frame.
The periods of balance were changed by the periods of bullish or bearish imbalances, that found a new equilibrium on higher/lower price levels.
Understanding of basic principles of supply and demand in trading is essential for profitable trading smart money concepts.
Learn to recognize the periods of imbalance and equilibrium.
It will provide you the edge in understanding and trading any forex pair.
❤️Please, support my work with like, thank you!❤️
I am part of Trade Nation's Influencer program and receive a monthly fee for using their TradingView charts in my analysis.
The Ultimate GOLD || Intraday Trading Plan (10/23/2025)Welcome to Trade with Decrypters!
DETAILED AND COMPLETE ANALYSIS ( 5 TRADE SETUPS )
Central Bank Buying
Central banks added net 19t in August led by Kazakhstan (14t), Bulgaria and El Salvador, Q3 on pace for 1,000t+ annually up 41% from historical norms. BRICS drivers like China (300t+ YTD) and India's $100B reserves fuel de-dollarization and inflation hedges; Poland reaffirms targets amid risks. Silver links to EV/solar boom (+70% China demand). Outlook: Unfazed 1,000t buys lift prices into 2026.
ETF Inflows & Sentiment
Gold ETFs hit $472B AUM in Q3 (+23% q/q) with $64B YTD inflows, September $17B record led by North America/Europe; Asia minor outflows. Safe-haven rush amid trade wars, minor profit-taking post $4k peak. RSI 75 overbought, $3,900 support holds. Silver +$2B YTD on industry bets. Forecast: Gold $4,200 test, silver $50+.
Macro & Geopolitical Events
Fed Oct cut vs. 2.9% inflation/shutdown-delayed jobs—labor firmer but risks grow.
Trump's China tariffs fuel wars; BRICS stalls de-dollarization but boosts gold; Ukraine/Mideast hikes energy/inflation. Drives 50%+ YTD metals gains; tariffs add 1–2% CPI.
Silver Deficit
Fifth straight deficit at 118M oz in 2025 (down 21% YoY), demand stable 1.20B oz vs supply +3% to 1.05B oz, industrial record 680M+ oz from solar/EVs. Renewables offset jewelry drops
Futures & Options Flow
CME gold OI ~528k contracts, steady amid volumes; CVOL moderate, call/put skew bullish for rate-cut squeezes
Fundamentals & Forecast
Gold +51% to $4,062, silver +43% to $48—via 1,000t+ CB buys, inflation, cuts, 7% GDP deficits. De-dollarization/geo-risks dominate. Projection: Gold $4,400 Q4, silver $57 mid-2026

Gold finally has a supply range! Time for bullish correction?I talked about everything but the obvious inverse head and shoulders/Quasimodo forming the right shoulder now. If everything goes right can we expect an arm to extend upwards here during the stochastic buy cycle?
Let me know what you think and be sure to share and care for others if you found this helpful.
Also talked about the "REAPER WARNING" as we have a reaper inversion range actively terrorizing price 🧩

GOLD BEARISH BIAS|SHORT|
✅XAUUSD broke its main ascending trendline, and gold is now showing bearish structure with potential continuation toward the next downside target. Price has retested the broken trendline before extending lower and we are seeing a clear rejection.Time Frame 2H.
SHORT🔥
✅Like and subscribe to never miss a new idea!✅

CAD-CHF Will Fall! Sell!
Hello,Traders!
CADCHF is approaching a horizontal supply area where institutional selling pressure may return. A reaction from this zone could trigger a bearish continuation toward the next liquidity pocket. Time Frame 5H.
Sell!
Comment and subscribe to help us grow!
Check out other forecasts below too!
Disclosure: I am part of Trade Nation's Influencer program and receive a monthly fee for using their TradingView charts in my analysis.

AUDCHF SHORT FROM SUPPLY ZONE|
✅AUDCHF is showing rejection from a major supply zone, suggesting that smart money is preparing for a bearish continuation toward the lower liquidity pool. The setup remains valid while below the supply range. Time Frame 3H.
SHORT🔥
✅Like and subscribe to never miss a new idea!✅

AUD-CAD Free Signal! Buy!
Hello,Traders!
AUDCAD Price has tapped into a horizontal demand area where smart money buyers are likely positioned. A potential bullish reaction could follow as liquidity gets absorbed from the previous lows.
-------------------
Stop Loss: 0.9059
Take Profit: 0.9079
Entry: 0.9068
Time Frame: 3H
-------------------
Buy!
Comment and subscribe to help us grow!
Check out other forecasts below too!
Disclosure: I am part of Trade Nation's Influencer program and receive a monthly fee for using their TradingView charts in my analysis.

USDCAD FREE SIGNAL|LONG|
✅USDCAD Price has reacted from a clean demand zone where buy-side liquidity was accumulated, showing signs of bullish displacement. A continuation toward the next imbalance is expected.
—————————
Entry: 1.3986
Stop Loss: 1.3975
Take Profit: 1.3999
Time Frame: 2H
Setup Risk: High
—————————
LONG🚀
✅Like and subscribe to never miss a new idea!✅

EUR-USD Local Short! Sell!
Hello,Traders!
EURUSD has reached a horizontal supply area where sellers previously stepped in. A bearish reaction from this zone could trigger a move lower as liquidity from buy-side traders gets taken. Time Frame 5H.
Sell!
Comment and subscribe to help us grow!
Check out other forecasts below too!
Disclosure: I am part of Trade Nation's Influencer program and receive a monthly fee for using their TradingView charts in my analysis.

SPY FREE SIGNAL|SHORT|
✅SPY is reacting from the all-time-high zone where institutional orders previously accumulated. A short-term retracement is likely as price sweeps liquidity above premium highs before rebalancing to the nearest fair-value gap. Time Frame 2H.
SHORT🔥
✅Like and subscribe to never miss a new idea!✅

NATGAS Short From Supply Area! Sell!
b]Hello,Traders!
NATGAS is approaching a major horizontal supply area, where strong selling pressure may reappear. A rejection from this zone could trigger a short-term correction toward lower liquidity pools. Time Frame 5H.
Sell!
Comment and subscribe to help us grow!
Check out other forecasts below too!
Disclosure: I am part of Trade Nation's Influencer program and receive a monthly fee for using their TradingView charts in my analysis.

EURGBP REBOUND AHEAD|LONG|
✅EURGBP is respecting the ascending trendline, showing signs of institutional accumulation near the dynamic support. A potential move toward 0.8690 is anticipated as liquidity builds above the recent highs. Time Frame 2H.
LONG🚀
✅Like and subscribe to never miss a new idea!✅

GBP-USD Free Signal! Buy!
Hello,Traders!
GBPUSD Price has tapped into a strong horizontal demand area after a corrective drop, showing potential for a bullish rebound. If this zone continues to hold, we may see buyers driving price toward the next short-term target.
-------------------
Stop Loss: 1.3361$
Take Profit: 1.3391$
Entry: 1.3375$
Time Frame: 3H
-------------------
Buy!
Comment and subscribe to help us grow!
Check out other forecasts below too!
Disclosure: I am part of Trade Nation's Influencer program and receive a monthly fee for using their TradingView charts in my analysis.


EUR-USD Bearish Breakout! Sell!
Hello,Traders!
EURUSD Price has broken below the horizontal supply area and is now forming a bearish continuation setup. A possible retracement toward the previous zone may attract more sellers, targeting deeper liquidity levels below 1.1580. Time Frame 5H.
Sell!
Comment and subscribe to help us grow!
Check out other forecasts below too!
Disclosure: I am part of Trade Nation's Influencer program and receive a monthly fee for using their TradingView charts in my analysis.

GOLD FREE SIGNAL|LONG|
✅XAUUSD Price has reached the key demand zone where institutional buyers are likely accumulating. The market structure suggests a potential rebound toward 4,160$, with momentum favoring a bullish continuation after this reaction zone holds. Time Frame 2H.
—————————
Entry: 4,115$
Stop Loss: 4,079$
Take Profit: 4,160$
Time Frame: 2H
—————————
LONG🚀
✅Like and subscribe to never miss a new idea!✅

XAU/USD Update 1Next move on the way, focus on proper risk management & stay discipline. Wishing you successful trades..!
Key Reason:
1. Price deeply grab all SSL.
2. Overall market structure was bullish.
3. Trendline respect.
4. 1H Fresh zone for buying.
5. Once price tap in our zone then switch into smaller time frame and look for bullish confirmation. Bullish move expected.
This is not a financial advise. Let's see how it will work.
