EUR-CAD Bearish Bias! Sell!
Hello,Traders!
EURCAD has broken decisively below the horizontal supply area after sweeping buy-side liquidity and distributing at premium, forming an SMC breakout structure that favors continuation lower toward the next discount target. Time Frame 10H.
Sell!
Comment and subscribe to help us grow!
Check out other forecasts below too!
Disclosure: I am part of Trade Nation's Influencer program and receive a monthly fee for using their TradingView charts in my analysis.
SMC

EURNZD FREE SIGNAL|LONG|
✅EURNZD price is reacting from a higher-timeframe demand level after running sell-side liquidity beneath the zone, forming an ICT accumulation footprint that signals a potential shift back toward premium. The rejection wick suggests smart-money absorption before a corrective move higher.
—————————
Entry: 2.0106
Stop Loss: 2.0065
Take Profit: 2.0168
Time Frame: 5H
——————————
LONG🚀
✅Like and subscribe to never miss a new idea!✅

EUR-USD Wide Demand Area Below! Buy!
Hello,Traders!
EURUSD is retracing into a horizontal demand area after sweeping sell-side liquidity beneath short-term lows, forming an SMC accumulation setup that favors a bounce toward the next buy-side target above. Time Frame 3H.
Buy!
Comment and subscribe to help us grow!
Check out other forecasts below too!
Disclosure: I am part of Trade Nation's Influencer program and receive a monthly fee for using their TradingView charts in my analysis.

Gold 1H – Will 4210 Reject Again or 4166 Ignite the Rally?🟡 XAUUSD – Intraday Smart Money Plan | by Ryan_TitanTrader (09/12)
📈 Market Context
Gold continues to soften under $4,200 as rising US Treasury yields pressure bullion, with markets positioning ahead of the upcoming Federal Reserve rate decision.
According to FXStreet, yields climbing intraday are capping gold’s upside, and sellers remain active below 4200 while participants wait for clarity on the Fed’s forward guidance.
This environment builds a liquidity-sensitive landscape, where institutions may engineer sweeps on both sides before committing to direction.
On H1, price oscillates cleanly between premium supply (4208–4210) and discount demand (4168–4166).
A valid push requires MSS → BOS → displacement from either extreme.
🔎 Technical Framework – Smart Money Structure (1H)
Current Phase: Sideways compression after consecutive CHoCH shifts
Key Idea: Expect liquidity grabs above 4210 or under 4166 before real movement
Liquidity Zones & Triggers
• 🔴 SELL GOLD 4208 – 4210 | SL 4218
• 🟢 BUY GOLD 4168 – 4166 | SL 4158
Institutional Flow Expectation:
sweep → MSS/CHoCH → BOS → displacement → FVG/OB retest → expansion
🎯 Execution Rules (matching your exact zones)
🔴 SELL GOLD 4208 – 4210 | SL 4218
Rules:
✔ Price taps premium zone (4208–4210)
✔ Bearish MSS/CHoCH confirmed on M5–M15
✔ Strong downside BOS + displacement
✔ Enter on FVG fill or refined supply OB retest
Targets:
1. 4185
2. 4175
3. 4168 – 4166
🟢 BUY GOLD 4168 – 4166 | SL 4158
Rules:
✔ Sweep under 4167 to collect sell-side liquidity
✔ Bullish MSS/CHoCH forms from discount
✔ Clean BOS + impulsive displacement upward
✔ Entry via bullish FVG fill or demand OB retest
Targets:
1. 4184
2. 4200
3. 4210
⚠️ Risk Notes
• Rising yields may generate deceptive spikes—avoid entries without BOS + displacement
• Do not chase price inside the compression range
• Keep SLs at structural invalidation, not arbitrary points
• Reduce exposure ahead of Fed-related volatility this week
📍 Summary
Today’s setup revolves around two institutional scenarios:
• A 4210 liquidity sweep triggers bearish structure → downside delivery toward 4166
or
• A 4166 liquidity grab forms bullish MSS → upside expansion back toward 4210
Let structure confirm.
Patience pays the trader—SMC reacts, never predicts. ⚡️
📌 Follow @Ryan_TitanTrader for daily Smart Money breakdowns.

Quick Sell trade on EURUSDI will sell the EUR/USD pair from 1.16517. This setup aligns with the continued downtrend on the hourly chart, and I will aim to target the 1.16159 level on the hourly chart.

EURUSD Bullish Scenario With Key Rejection LevelQuick Summary
EURUSD remains in a strong uptrend, and the preferred buy zone sits at 1.16461. A rejection signal from this orderblock will confirm the continuation of bullish momentum and the price may dip first to test liquidity near the previous Tokyo low so we will wait for rejection to confirm buying.
Full Analysis
The EURUSD continues to move within a clear and well structured bullish trend, showing consistent strength across multiple sessions. In line with this momentum, the preferred plan is to wait for price to reach the level at 1.16461, where a strong orderblock is positioned. This zone is align after liquidity, making it a logical zone for buyers to re enter the market.
However, the entry is not based on touching the level alone. A rejection signal from this orderblock is essential, as it provides confirmation that buyers are actively defending the zone. This increases the probability of a clean continuation to the upside.
It is also important to acknowledge the liquidity resting below the previous Tokyo low. Price may seek that liquidity first, creating a small dip before reversing upward. Such behavior is typical in trending markets, where liquidity hunts fuel the next expansion phase. For this reason, patience is key, and waiting for clear rejection from the level helps avoid premature entries.

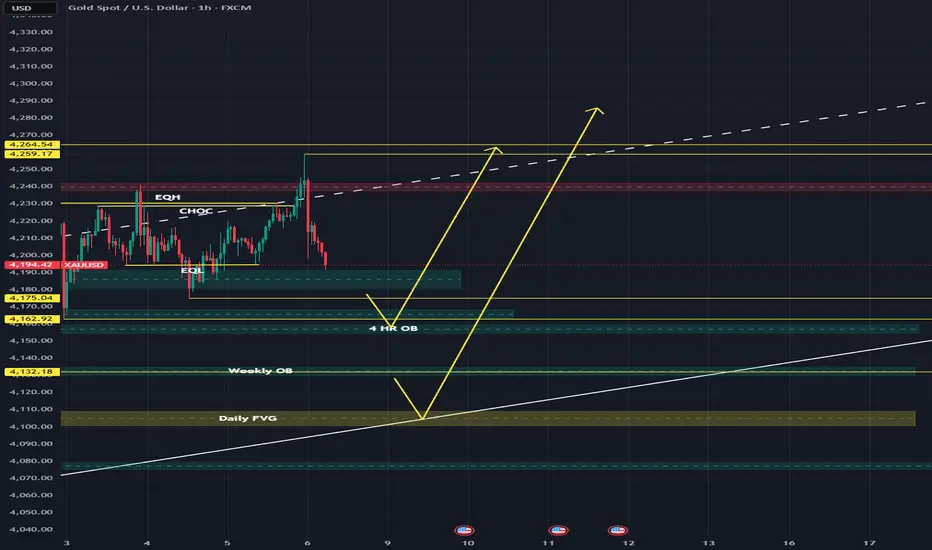
Gold 1H – Will 4232 Trap Liquidity or 4170 Spark Expansion?🟡 XAUUSD – Intraday Smart Money Plan | by Ryan_TitanTrader (08/12)
📈 Market Context
Gold trades inside politically-driven liquidity as Donald Trump signals that the current method of tariffing through the US Supreme Court is “more direct, less cumbersome, and much faster.”
This introduces fresh uncertainty for USD flows, increasing short-term volatility across commodities.
Expect engineered sweeps on both sides as institutions react to policy-sensitive sentiment shifts.
On H1, price compresses between premium supply (4230–4232) and discount demand (4170–4168).
A confirmed MSS + BOS + displacement is required before any directional leg becomes valid.
🔎 Technical Framework – Smart Money Structure (1H)
Current Phase: Liquidity-rich compression inside a minor bullish channel
Key Idea: Sweeps first, real move later
Liquidity Zones & Triggers
• 🔴 SELL GOLD 4230 – 4232 | SL 4240
• 🟢 BUY GOLD 4172 – 4170 | SL 4162
Bias shifts only via structural break + clean displacement.
Expected Institutional Sequence:
sweep → MSS/CHoCH → BOS → displacement → FVG/OB retest → expansion
🎯 Execution Rules (matching your exact zones)
🔴 SELL GOLD 4230 – 4232 | SL 4240
Rules:
✔ Price taps 4231–4232 → bearish MSS/CHoCH on M5–M15
✔ BOS down + strong displacement candle
✔ Entry on bearish FVG fill / supply OB retest
Targets:
1. 4200
2. 4185
3. 4170
🟢 BUY GOLD 4172 – 4170 | SL 4162
Rules:
✔ Sweep below 4169 → bullish MSS/CHoCH
✔ BOS up + displacement from discount
✔ Entry on FVG fill or refined OB retest
Targets:
1. 4186
2. 4210
3. 4230 – 4232
⚠️ Risk Notes
• Headlines may induce fake sweeps; do not pre-commit without BOS + displacement
• No averaging inside compression
• SLs must sit at structural invalidation
• Reduce risk during tariff-related spikes
📍 Summary
Today’s playbook offers two institutional paths:
• 4231 sweep → bearish MSS → BOS → retest → delivery into 4170
or
• 4169 sweep → bullish MSS → BOS → retest → expansion back toward 4230+
Trade confirmations only.
Let gold show its hand — patience is your edge. ⚡️
📌 Follow @Ryan_TitanTrader for daily Smart Money breakdowns.

WTI DEMAND LEVEL BELOW|LONG|
✅WTI OIL is retracing sharply toward a demand zone after drawing sell-side liquidity beneath short-term lows, setting up an ICT-style bullish reaction point. If demand holds, price is poised to rebalance upward into the inefficiency near the target zone. Time Frame 2H.
LONG🚀
✅Like and subscribe to never miss a new idea!✅

GBPJPY WILL KEEP GROWING|LONG|
✅GBPJPY has broken cleanly above the demand zone after sweeping internal sell-side liquidity, showing strong displacement and an ICT-style shift in order-flow toward higher buy-side objectives. Price is now drawing toward the next liquidity pocket above. Time Frame 3H.
LONG🚀
✅Like and subscribe to never miss a new idea!✅

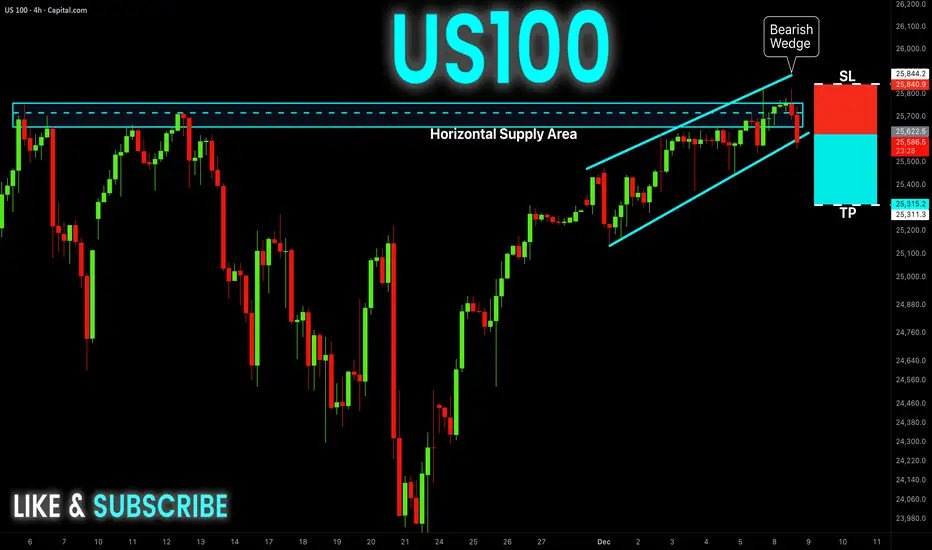
US100 Free Signal! Sell!
Hello,Traders!
US100 has rejected a major supply zone while breaking down from a bearish wedge, sweeping buy-side liquidity before shifting order-flow bearish. This SMC structure signals distribution at premium and a move toward discount levels below.
--------------------
Stop Loss: 25840
Take Profit: 25315
Entry: 25622
Time Frame: 4H
--------------------
Sell!
Comment and subscribe to help us grow!
Check out other forecasts below too!
Disclosure: I am part of Trade Nation's Influencer program and receive a monthly fee for using their TradingView charts in my analysis.
CRUDE OIL Bearish Breakout! Sell!
Hello,Traders!
CRUDE OIL has broken beneath the rising trendline and retested a supply cluster, confirming an SMC bearish shift as buy-side liquidity was swept before displacement pushed price lower. A continuation toward the target discount zone remains likely. Time Frame 2H.
Sell!
Comment and subscribe to help us grow!
Check out other forecasts below too!
Disclosure: I am part of Trade Nation's Influencer program and receive a monthly fee for using their TradingView charts in my analysis.

GBPCHF FREE SIGNAL|SHORT|
✅GBPCHF price has tapped into a higher-timeframe supply zone after running buy-side liquidity above recent swing highs, creating an ICT bearish rejection that shifts order-flow toward discount levels and favors a corrective move lower.
—————————
Entry: 1.0754
Stop Loss: 1.0782
Take Profit: 1.0710
Time Frame: 6H
—————————
SHORT🔥
✅Like and subscribe to never miss a new idea!✅

EUR-AUD Free Signal! Sell!
Hello,Traders!
EURAUD has broken out beneath the horizontal supply area after distributing at premium, sweeping buy-side liquidity and shifting order-flow decisively bearish. This SMC breakout favors continuation lower toward the next discount zone.
--------------------
Stop Loss: 1.7602
Take Profit: 1.7510
Entry: 1.7559
Time Frame: 6H
--------------------
Sell!
Comment and subscribe to help us grow!
Check out other forecasts below too!
Disclosure: I am part of Trade Nation's Influencer program and receive a monthly fee for using their TradingView charts in my analysis.

EUR-GBP Free Signal! Buy!
Hello,Traders!
EURGBP has tapped into a horizontal demand area after sweeping sell-side liquidity beneath prior lows, forming an SMC accumulation structure that favors a corrective move toward the upper buy-side target.
--------------------
Stop Loss: 0.8718
Take Profit: 0.8750
Entry: 0.8734
Time Frame: 6H
--------------------
Buy!
Comment and subscribe to help us grow!
Check out other forecasts below too!
Disclosure: I am part of Trade Nation's Influencer program and receive a monthly fee for using their TradingView charts in my analysis.

USD-JPY Bullish Bias! Buy!
Hello,Traders!
USDJPY has tapped into a horizontal demand area after taking sell-side liquidity beneath recent lows, forming an SMC accumulation setup that favors a corrective push toward the next buy-side target above. Time Frame 6H.
Buy!
Comment and subscribe to help us grow!
Check out other forecasts below too!
Disclosure: I am part of Trade Nation's Influencer program and receive a monthly fee for using their TradingView charts in my analysis.

NZD-USD Will Fall! Sell!
Hello,Traders!
NZDUSD is reacting from a horizontal supply area after sweeping buy-side liquidity sitting above previous swing highs, forming an SMC distribution setup that favors a corrective move toward the next inefficiency and demand pocket below. Time Frame 5H.
Sell!
Comment and subscribe to help us grow!
Check out other forecasts below too!
Disclosure: I am part of Trade Nation's Influencer program and receive a monthly fee for using their TradingView charts in my analysis.

Compression loaded, breakout pending — don’t blink🟡 Hello Goldies,
Welcome to a defining week.
Gold opens the new chapter sitting deep in premium territory, pressed right against the ceiling of its bullish structure. Momentum remains strong, but location is becoming critical — this is where powerful trends decide whether to extend or correct.
Macro Pulse
A heavyweight week for the USD.
The Federal Reserve steps back into the spotlight with the Rate Decision, Economic Projections, and Powell’s conference, while unemployment data adds extra volatility to the mix. With no inflation release to balance sentiment, the Fed fully owns the narrative.
A dovish tone keeps gold floating near the highs.
A hawkish tone invites a pullback into weekly discount.
📍 Weekly Supply Zones
🟥 Premium Reaction Zone — 4310–4410
Where gold is currently battling.
Wicks, hesitation, and compression confirm active sell-side pressure.
Weekly decision begins here.
🟥 Upper Expansion Zone — 4550–4680
If buyers break first supply, momentum extends into this zone — historically a slowdown region.
🟥 Macro Expansion Zone — 4820–4970
Frontier territory. Entry here signals macro-level expansion and possible large-scale distribution.
📍 Weekly Demand Zones
🟦 First Support Base — 3820–3970
The most important discount area sustaining the rally.
🟦 Mid-Structure Support — 3450–3310
A clean accumulation base — valid weekly support.
🟦 Lower Support Range — 3000–2850
Deep correction if reached; not a trend reversal.
⚪ Decision Zone — 4120–4200
The weekly pivot.
Above it → bullish continuation holds.
Below it → correction opens toward First Support Base.
⭐ Technical Confluence
Price sits inside the 1.618 fib extension, a historical turning zone.
EMAs support strong uptrend yet show vertical overstretching.
RSI elevated → buyers must defend to avoid a unwind.
Clean SMC structure, but top compression reveals liquidity buildup.
🟢 Bullish Scenario
Holding above the Decision Zone + breaking 4310–4410 opens targets:
4550–4680
4820–4970 if expansion accelerates
🔴 Bearish Scenario
Rejection at premium + break below 4120–4200 exposes:
3820–3970
3450–3310 on deeper unwind
Daily Structure
Daily remains bullish with higher lows and supportive EMAs.
RSI elevated; candles compress against overhead supply.
Daily Decision Zone — 4180–4220 Controls this week’s flow.
Key Daily Levels
🟥 Supply
4320–4410 → first ceiling
4470–4550 → expansion
4620–4720 → extended rally
🟦 Demand
4060–4140 → first defense
3780–3870 → deeper corrective
3300–3500 → structural base
H4 Structure
Compression under supply, preparing for expansion.
H4 Decision Zone — 4200–4220 Breaker of bias.
🟥 4240–4280 → first reaction supply
🟦 4130–4170 → key support floor
H1 Structure
Classic coil setup — liquidity building above swing highs.
H1 Decision Zone — 4195–4205
Short-term pivot.
Weekly Outlook Summary
Gold sits at a major decision point:
Breakout above stacked supply = continuation into premium expansion targets
Rejection = clean retracement into discount
Trade Plan:
📍 Key Pivot: 4195–4220
Above = continuation
Below = retracement
📈 Bullish Path
Confirmation Required
Hold above 4195–4220 (Decision Zone)
Sweep liquidity above 4215 or 4260
BOS on M5/M15 + FVG / OB retest = entry trigger
🎯 Targets
4240–4280
4310–4350
4470–4550 if expansion accelerates
📉 Bearish Path
Reaction First
Rejection inside 4310–4410 (Premium Supply)
Liquidity sweep + M5/M15 CHoCH
Retest of Supply / FVG = entry trigger
🎯 Targets
4178–4190
4150–4160
4060–4140 deeper rotation
The structure is mapped.
Levels are defined.
The reaction will reveal direction.
USDJPY H1 OUTLOOKThe USDJPY pair is currently approaching a significant Point of Interest (POI) on the higher timeframes. For proactive traders, this presents a classic "wait and confirm" scenario. The market is giving us a clear heads-up: a major reaction is likely upon the test of this level. Our plan is not to predict, but to prepare—to patiently wait for the POI tap and seek Lower Time Frame (LTF) confirmation for a potential sell trade.

GBPUSD M15 OUTLOOKThe GBPUSD on the M15 timeframe has just presented us with a classic and powerful market structure sequence: a successful low sweep followed by Lower Time Frame (LTF) inducement. This action often sets the stage for a potential reversal or a strong continuation move. For proactive traders, this isn't just a signal; it's an invitation to plan high-probability trades. The key now is to strategically target either a tap of a key LTF Extreme Point of Interest (POI) or prepare for an Internal High Break for a long entry.

NZDUSD CORRECTION EXPECTED|SHORT|
✅NZDUSD price is reacting from a premium supply zone after engineering buy-side liquidity into the upper range, creating an ICT rejection that shifts short-term order-flow toward the demand block below where discount pricing awaits. Time Frame 6H.
SHORT🔥
✅Like and subscribe to never miss a new idea!✅

GOLD RISING TRENDLINE AHEAD|LONG|
✅XAUUSD price is reacting off the rising trendline after sweeping internal sell-side liquidity, creating an ICT-style rejection that signals a bullish draw toward the next buy-side inefficiency above. Continuation is favored as long as the trendline holds. Time Frame 2H.
LONG🚀
✅Like and subscribe to never miss a new idea!✅

NZD-CHF Free Signal! Sell!
Hello,Traders!
NZDCHF tapped directly into a clean horizontal supply zone, sweeping buy-side liquidity that rested above prior highs. This reaction aligns with SMC premium pricing, where smart money distributes before initiating a corrective move lower.
--------------------
Stop Loss: 0.4660
Take Profit: 0.4634
Entry: 0.4646
Time Frame: 10H
--------------------
Sell!
Comment and subscribe to help us grow!
Check out other forecasts below too!
Disclosure: I am part of Trade Nation's Influencer program and receive a monthly fee for using their TradingView charts in my analysis.

EURUSD FREE SIGNAL|LONG|
✅EURUSD dipped into a bullish retracement after drawing sell-side liquidity beneath the rising trendline, then rejected sharply, signaling a shift back toward premium and drawing price toward the buy-side liquidity above recent highs.
—————————
Entry: 1.1640
Stop Loss: 1.1626
Take Profit: 1.1664
Time Frame: 4H
—————————
LONG🚀
✅Like and subscribe to never miss a new idea!✅
