EUR_CHF WILL GO UP|LONG|
✅EUR_CHF fell down sharply
But a strong support level was hit at 0.9320
Thus as a rebound is already happening
A move up towards the target of 0.9340 shall follow
LONG🚀
✅Like and subscribe to never miss a new idea!✅
SMC

USD-CHF Bullish Correction Ahead! Buy!
Hello,Traders!
USD-CHF fell down sharply
And made a retest of the
Horizontal support of 0.7929
And we are already seeing
A bullish reaction so as the
Pair is locally oversold
We will be expecting a
Further bullish move up
Buy!
Comment and subscribe to help us grow!
Check out other forecasts below too!
Disclosure: I am part of Trade Nation's Influencer program and receive a monthly fee for using their TradingView charts in my analysis.

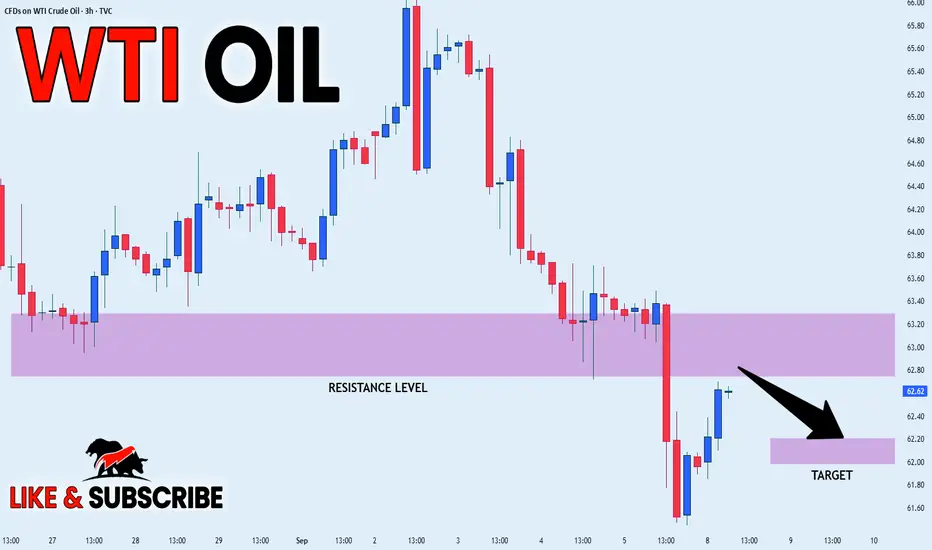
USOIL LOCAL SHORT|
✅CRUDE OIL is going up to retest
A horizontal resistance of 63.00$
And as OIL is in the downtrend
I am locally bearish biased
So I think that we will see a pullback
And a move down from the level
Towards the target below at 62.20$
SHORT🔥
✅Like and subscribe to never miss a new idea!✅
CAD-CHF Will Keep Falling! Sell!
Hello,Traders!
CAD-CHF keeps falling
In a strong downtrend
And the pair made some
Strong bearish moves
Today already so we are
Bearish biased and we
Will be expecting a
Further bearish move down
Sell!
Comment and subscribe to help us grow!
Check out other forecasts below too!
Disclosure: I am part of Trade Nation's Influencer program and receive a monthly fee for using their TradingView charts in my analysis.

GBP_CAD BEARISH BIAS|SHORT|
✅GBP_CAD has hit a key
Structure level of 1.8740
Which implies a high
Likelihood of a move down
As some market participants
Will be taking profit from
Their long positions
While others will find this
Price level to be good for selling
So as usual we will have a
Chance to ride the wave
Of a bearish correction
SHORT🔥
✅Like and subscribe to never miss a new idea!✅

NZD-CAD Will Go Down! Sell!
Hello,Traders!
NZD-CAD already made a
Retest of the horizontal
Level of 0.8170 from where
We are already seeing a
Bearish reaction so we
Will be expecting a
Further bearish move down
Sell!
Comment and subscribe to help us grow!
Check out other forecasts below too!
Disclosure: I am part of Trade Nation's Influencer program and receive a monthly fee for using their TradingView charts in my analysis.

USD_CHF WILL FALL|SHORT|
✅USD_CHF went up to retest
A horizontal resistance of 0.799
Which makes me locally bearish biased
And I think that we will see a pullback
And a move down from the level
Towards the target below at 0.7975
SHORT🔥
✅Like and subscribe to never miss a new idea!✅

EUR-JPY Will Grow! Buy!
Hello,Traders!
EUR-JPY made a retest
Of the horizontal support
Level of 172.600 and as
We are bullish biased
We will be expecting a
Local move up
Buy!
Comment and subscribe to help us grow!
Check out other forecasts below too!
Disclosure: I am part of Trade Nation's Influencer program and receive a monthly fee for using their TradingView charts in my analysis.

XAUUSD Weekly Outlook ( Sept 8th - 13th )Hello Traders,
🔥 Gold has powered into $3600 — right on track with our plan. If you didn’t ride the full wave, no worries — price action always gifts new entries and exits.
Now comes the big question: Do we run straight to $3700, or pull back toward $3550 first?
This week’s spotlight: Inflation data (PPI & CPI).
Hot prints → stronger USD → possible gold correction
Soft prints → weaker USD → fuel for further upside
Technical : Weekly RSI >70 → momentum is strong, but conditions are stretched, making retracements possible.
Macro: Geopolitical tensions + safe-haven demand keep the bigger bullish picture intact.
👉 Our stance: Still bullish, with targets now extended to $3745. Here is the breakdown :
Weekly Price Map & Scenarios
Bullish Scenario
Base Case: Gold consolidates around $3,600, building on the breakout.
Upside Target: Move toward $3,689–3,700 by week’s end, aligned with algorithmic and institutional forecasts.
Extended Target: If momentum accelerates, institutional optics suggest extension toward $4,000+.
Sideways / Neutral
Expect range-bound trading between $3,600–3,650 early in the week. This gives way to breakout moves in response to macro cues (employment data, Fed tone).
Bearish Risk
Though unlikely given current momentum, a hawkish Fed or strong U.S. data could stall the trend. In that scenario, look for pullback levels near $3,550–3,570 as support.
🔑 Key Levels
Support (demand zones):
3550–3530 → Bulls’ lifeline (EMA support).
3525–3480 → Strong base if deeper retrace.
3375–3325 → Mid-range defence, breakout base.
Resistance (supply zones):
3620–3640 → First ceiling.
3665–3700 → Major supply cluster.
3810–3860 → Extended bullish target if CPI comes soft.
📌 Scenarios
🟢 Bullish Path
Hold above 3550 → push toward 3620–3665.
Break & hold above 3700 → unlocks 3810–3860.
🔴 Bearish Path
Rejection at 3620/3665 → correction into 3550–3520.
Hot CPI/PPI → break below 3525 → opens 3375–3325.
✅ Action Plan
Above 3550 = bullish continuation bias.
Below 3525 = correction bias.

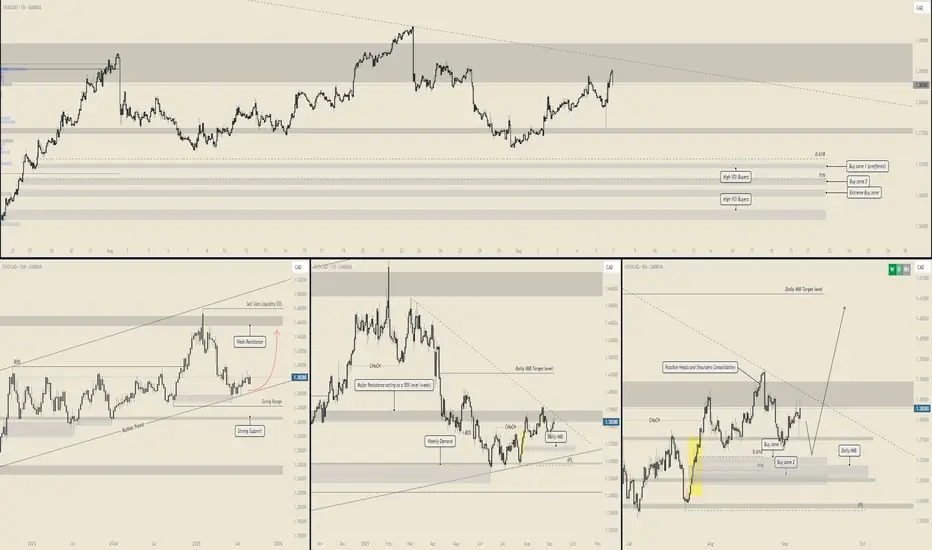
USD/CAD - Clean price actions with LTF consolidation📈 USD/CAD – Coiling for the Next Expansion
🕰 Weekly View
Price remains in a long-term bullish trend, holding above strong support.
Weekly structure shows resistance overhead at 1.50–1.52, but liquidity is building toward that level.
Current zone is mid-range, rejecting weekly supply.
📊 Daily Structure
Recent CHOCH + BOS confirm buyers stepping back in after tapping weekly demand.
Price consolidating near 1.38, building energy.
Daily IMB target sits at 1.41, aligning with upside liquidity.
Below, two strong buy zones line up with fib 0.618–0.71 retracement:
Buy Zone 1 (preferred): 1.37–1.3720
Buy Zone 2: 1.3650–1.3680 (extreme demand).
⏱ 8H Breakdown
Structure forming a potential head & shoulders consolidation, but neckline is unbroken.
If price dips into buy zones, expecting sharp reversal higher.
Liquidity below sitting at 1.37–1.3680, prime trap for late sellers.
Upside target: 1.41–1.4150 IMB.
🎯 Trade Plan
Entry: Wait for sweep into 1.37 demand (preferred).
Stop: 1.3645 (below extreme demand).
Target: 1.4100–1.4150 (daily IMB).
RR: 1:4+ depending on entry.
⚡ Bias
Bullish – waiting for a corrective dip into demand before continuation to 1.41+.
Invalidation: sustained close below 1.3640.
EURUSD overview on Daily chartEURUSD is likely to fall to retest the uptrend, and there is also a good order block at that level from which the uptrend could potentially resume. However, we should only enter a trade if we see a change of character (CHoCH) signal on the hourly timeframe, as EURUSD is currently in a corrective phase.

NZD/USD - Bearish Trade Setup followed by a Bullish movement📉 NZD/USD – Bearish Setup Building
🕰 Weekly View
Price is still locked inside a HTF bearish trend, with lower highs holding under the bearish trendline.
Strong demand reactions have appeared, but structure remains heavy, pointing toward continuation lower.
Market is ranging inside a swing range — liquidity building on both sides.
📊 Daily Structure
Clear CHOCH → BOS sequence confirming bearish order flow.
Price tapped into daily demand + IMB but failed to fully reverse.
Now trading back into the 8H BOS range, leaving sell-side liquidity exposed below.
0.618–0.71 fib zone aligns with bearish continuation confluence.
⏱ 8H Breakdown
Buy-side liquidity swept, stops cleaned above local highs.
Price has returned into supply, rejecting strongly.
Targeting the daily IMB & extreme demand zone around 0.5690 – 0.5720.
Major support sits just below, aligning with Fibonacci + previous swing lows.
🎯 Trade Plan
Entry: 0.5880 (confirmed rejection at supply)
Stop: 0.5933 (above recent liquidity sweep)
Target: 0.5690 zone (daily IMB / extreme demand)
RR: 3.5R setup
⚡ Bias
Bearish – looking for continuation into demand.
Only a break above 0.5935–0.5950 would invalidate this short-term short.

NZD_USD SHORT FROM RESISTANCE|
✅NZD_USD price grew again
To retest the resistance of 0.5914
But it is a strong key level
So we are seeing a bearish reaction
And we will likely see a
Further bearish move down
SHORT🔥
✅Like and subscribe to never miss a new idea!✅

AMAZON PULLBACK AHEAD|SHORT|
✅AMAZON has retested a key
Resistance level of 236.60$
And as the pair is already
Making a bearish pullback
A move down to retest the
Demand level below at 230.00$
Is likely on Monday
SHORT🔥
✅Like and subscribe to never miss a new idea!✅

CRUDE OIL Support Ahead! Buy!
Hello,Traders!
CRUDE OIL keeps falling
In a downtrend which seems
To indicate that the market
Has its doubts about the
Economy, however, a strong
Horizontal support is ahead
Around 60.00$ and after the
Retest we will be expecting
A local bullish rebound
Sell!
Comment and subscribe to help us grow!
Check out other forecasts below too!
Disclosure: I am part of Trade Nation's Influencer program and receive a monthly fee for using their TradingView charts in my analysis.

NZD-CAD Will Keep Falling! Sell!
Hello,Traders!
NZD-CAD has formed a
Bearish flag pattern
And the pair is trying
To breakout of the flag
So IF we the breakout
Is confirmed on Monday
We will be expecting
A further bearish move down
Sell!
Comment and subscribe to help us grow!
Check out other forecasts below too!
Disclosure: I am part of Trade Nation's Influencer program and receive a monthly fee for using their TradingView charts in my analysis.

NZD_CAD LOCAL SHORT|
✅NZD_CAD price went up sharply
But a strong resistance level was hit at 0.8170
Thus, as a pullback is already happening
And a move down towards the
Target of 0.8140 shall follow
SHORT🔥
✅Like and subscribe to never miss a new idea!✅

GBP-CAD Short From Resistance! Sell!
Hello,Traders!
GBP-CAD shot up sharply
And hit a horizontal resistance
Of 1.8740 from where the pair
Is already making a local
Pullback and we will be
Expecting a further bearish
Move down on Monday
Buy!
Comment and subscribe to help us grow!
Check out other forecasts below too!
Disclosure: I am part of Trade Nation's Influencer program and receive a monthly fee for using their TradingView charts in my analysis.

EUR_JPY WILL GROW|LONG|
✅EUR_JPY has retested a
Support level of 176.600
And we are already seeing
A bullish reaction so after
A confirmation on Monday
We will be expecting growth
LONG🚀
✅Like and subscribe to never miss a new idea!✅

USD-CHF Local Short! Sell!
Hello,Traders!
USD-CHF is trading in a
Downtrend but the pair
Is making a bullish rebound
So after the retest of the
Horizontal resistance above
At 0.7992 we will be
Expecting a local
Bearish correction
On Monday!
Sell!
Comment and subscribe to help us grow!
Check out other forecasts below too!
Disclosure: I am part of Trade Nation's Influencer program and receive a monthly fee for using their TradingView charts in my analysis.

Gold - A+ Trade Setup🔎 Weekly View (Macro Bias)
Trend: Strong bullish trend intact with multiple BOS (Break of Structure) confirming upward continuation.
Resistance: Price has cleared a prior major resistance near 3,400 and is pushing higher.
Implication: Weekly bias remains bullish unless we see a sharp rejection back under 3,400 – 3,450 demand.
📉 Daily View (Intermediate Bias)
Trend: Clear bullish structure with consistent higher highs and higher lows.
Key Levels:
Major Resistance: Broken at 3,100, now acting as historical support.
Support Zone: Fresh daily demand sits around 3,450 – 3,500.
Implication: As long as daily demand holds, expectation is for continuation into 3,600+.
⏱ 8H View (Execution Frame)
Structure: Bullish channel still intact. Price broke above resistance and is holding well above 3,560–3,570 demand.
Scenario: Possible retest of the 3,560 – 3,570 zone (aligned with bullish trendline) before continuation upward.
Upside Target: 3,600 – 3,620 in the near-term.
⏱ 30M View (Fine-Tuned Entry)
Recent Action: Price rallied sharply after clearing resistance and is now consolidating.
Fib Level: The 71% retracement aligns with prior breakout structure near 3,570, offering a strong intraday buy zone.
Plan: Intraday longs on retests into 3,570 – 3,580 with continuation toward 3,600 – 3,610.
✅ Trade Outlook
Bias: Bullish on all timeframes.
Setup:
Buy retracements into 3,570 – 3,580 (30M / 8H demand).
Hold for continuation into 3,600 – 3,620 near-term.
Invalidation: Clean break below 3,550 (trendline + demand zone) would suggest a deeper pullback toward 3,450 – 3,500.

USD/JPY - Multi timeframe breakdown🔎 Weekly View (Macro Bias)
Trend: Long-term structure is still bullish, but the most recent weekly close reacted strongly from supply.
Demand Zones: Price is hovering above a weekly demand block around 145.0 – 146.0, which aligns with prior structure.
Implication: We could see a deeper retracement into weekly demand before the pair makes another attempt higher.
📉 Daily View (Intermediate Bias)
Shift in Sentiment: Daily chart shows a clear bearish structure, with lower highs and a supply rejection around 151.2.
Liquidity Map:
Sell-side liquidity sits below 146.0.
Buy-side liquidity rests above 151.0–152.0.
Key Demand: Daily demand zones between 144.5 – 146.0 are holding price for now.
Implication: Market is ranging. Bears have momentum, but if demand continues to hold, buyers may attempt a reversal toward 150+.
⏱ 8H View (Execution Frame)
Structure: Strong liquidity sweep into daily demand, followed by a bounce.
Supply vs. Demand:
8H supply zones are capping rallies (148.5 – 149.5).
8H demand zones at 146.0 – 146.5 remain intact.
Note: The repeated retests suggest buyers are losing interest, but demand has not fully broken yet.
📊 1H View (Fine-Tuned Entry)
Confluence Zone: Price reacted strongly from the 71% fib retracement and supply rejection.
Support: Strong support seen at 146.0–146.5, aligned with daily demand.
Resistance: Multiple layers of resistance at 148.5, 150.0, and 151.2.
✅ Trade Outlook
Preferred Setup:
Option 1 (Bullish Reversal): Look for longs from 146.0–146.5 daily demand into 150–151.2 liquidity.
Option 2 (Bearish Continuation): If 146.0 breaks clean, expect continuation toward 144.0 – 143.0 (deeper weekly demand).
Bias: Currently neutral-to-bearish unless demand proves strong. Bulls need a confirmed break above 148.5–149.5 supply to flip bias back to bullish.

USD_JPY SUPPORT BELOW|LONG|
✅USD_JPY is going down now
But a strong support level is ahead at 146.600
Thus I am expecting a rebound
And a move up towards the target of 147.200
LONG🚀
✅Like and subscribe to never miss a new idea!✅
