SILVER Will Keep Growing! Buy!
Hello,Traders!
SILVER is trading in an
Uptrend and the price
Made a bullish breakout
Of the key horizontal
Level of 39.53$ and the
Breakout is confirmed so
We are bullish biased
And we will be expecting
A further bullish continuation
Buy!
Comment and subscribe to help us grow!
Check out other forecasts below too!
Disclosure: I am part of Trade Nation's Influencer program and receive a monthly fee for using their TradingView charts in my analysis.
SMC

AUD-USD Bullish Bias! Buy!
Hello,Traders!
AUD-USD made a bullish
Breakout of the key
Horizontal level of 0.6624
Which is now a support
Then made a retest and
A rebound so we are
Bullish biased and we
Will be expecting a
Further bullish move up
Buy!
Comment and subscribe to help us grow!
Check out other forecasts below too!
Disclosure: I am part of Trade Nation's Influencer program and receive a monthly fee for using their TradingView charts in my analysis.

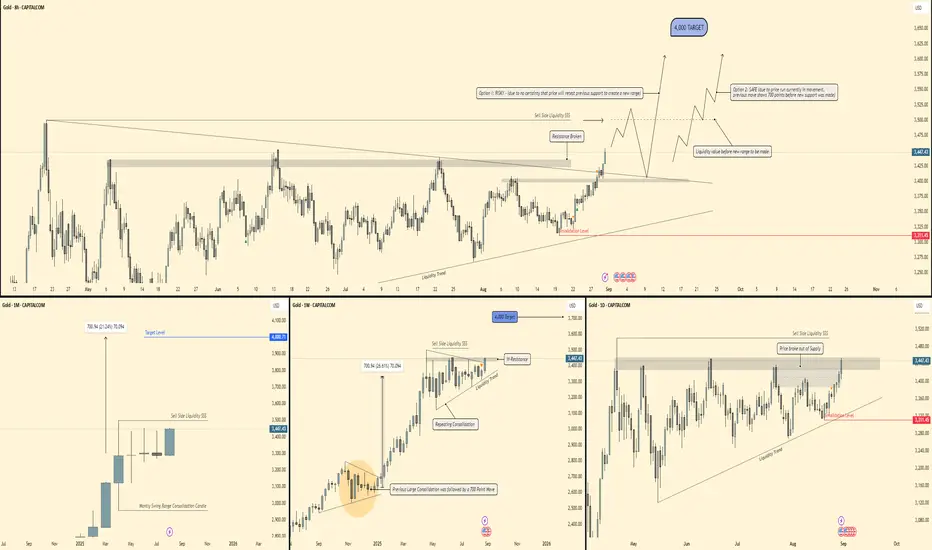
GOLD - 4,000 Targets in sight🕰 Monthly View
Strong bullish structure with a massive impulse.
Previous consolidation candle broke out and delivered a 700-point rally – current structure suggests a similar expansion is underway.
Key target level sits at $4,000, aligning with higher timeframe projections.
📆 Weekly View
Price broke through weekly resistance and sell-side liquidity.
Repeating consolidation pattern before breakout – history suggests further continuation.
Liquidity trend supporting higher lows; bullish structure remains intact.
Short-term resistance cleared at 3,450, leaving upside liquidity exposed toward 3,800–4,000.
📅 Daily View
Breakout from daily supply zone (≈3,420–3,450) confirmed bullish momentum.
Now trading above liquidity, with two possible scenarios:
Option 1 (Risky): Immediate continuation higher without creating a new range (less stable).
Option 2 (Safe): Pullback into fresh support (~3,350–3,400) before expansion toward 3,600–4,000.
⏱ 8H View
Resistance broken; liquidity grab confirmed.
Consolidation breakout leaves price trending strongly bullish.
Any dip into support around 3,350–3,375 is a potential buy zone for continuation.
🎯 Bias & Trade Plan
Bias: Strong Bullish
Entry Zone: 3,350–3,400 (safe pullback buys)
Targets:
Short-term → 3,600
Mid-term → 4,000
Invalidation: Daily close below 3,311 (liquidity trend break).
⚠️ Risk Note
Gold is in a parabolic move — chasing without confirmation is risky. Best strategy: wait for pullback/retest before entering heavy positions.
XAUUSD Outlook Monthly / Weekly ( 1st -5th Sept )Hello Traders,
Welcome to a fresh month and a brand-new week! Once again, last week’s plan unfolded just as we mapped it out — I trust many of you managed to catch those green (or blue, whichever you prefer) prints.
Now as we roll into September, gold sits at a pivotal supply zone. The 3500 liquidity magnet is pulling price, but the stretched EMAs warn of a possible retracement. Key levels are clear: bulls must defend 3400–3360, or else we risk a revisit toward the 3250–3120 liquidity pocket.
My bias remains bullish while 3400 holds. Gold is testing supply, and a sweep of the 3500 liquidity magnet looks probable. A bearish shift only comes if 3360 breaks.
And don’t forget — NFP Friday is the major decision point this week.
Let’s dive into the setups and see how we can position for another profitable month and week ahead. ✨
🔑 High-Level Summary
Macro Trend: Still bullish, but price is pressing into premium supply zones (3460–3500).
Bias: Bullish above 3400; bearish shift only if 3360 (H4 cluster) breaks.
Main Magnet: 3500 liquidity pool + Fibo expansions at 3520–3530 and 3600–3620.
Risk: Extremely stretched above EMAs → a corrective wick/pullback likely in September.
🟡 Monthly View
Supply: 3460–3500 (premium, untested).
Demand: 2800–2850 (macro HL + EMA21 confluence).
Liquidity Wick: 3250–3120 (likely sweep/re-accumulation, not clean OB).
Progression Map:
Bullish → Break & hold 3460–3500 → 3550–3600, then 3700–3720.
Bearish → Rejection at 3460–3500 → pullback 3320 → possibly sweep 3250–3120.
Bias: Bullish above 3300; bearish shift only on monthly close <3120.
🔵 Weekly View
Supply: 3460–3500 (key liquidity).
Demand:
3360–3340 (shallow, first cushion).
3280–3250 (EMA21 ~3222, strong accumulation).
Progression Map:
Bullish → Break above 3500 → 3550–3575 → 3600–3620.
Bearish → Rejection → correction 3340 → 3250.
Bias: Bullish above 3340, neutral in 3460–3340 range, bearish below 3250.
🔴 Daily View
Supply: 3460–3480.
Decision Zone: 3400–3380 (EMA21).
Demand: 3340–3320 (EMA100 confluence).
Liquidity Zone: 3260–3240.
Bias:
Bullish while >3400.
Neutral 3480–3400.
Bearish only if <3320.
🟠 H4 View
Supply: 3450–3470 (wick rejection).
Liquidity Magnet: 3485–3500.
Demand Zones:
3420–3400 (Decision Demand, EMA21).
3380–3360 (stacked EMA cluster 50/100/200).
Fibo Targets: 3520–3530, 3600–3620.
Bias: Bullish >3400, neutral 3470–3400, bearish <3360.
🟢 H1 Intraday View
Supply: 3495–3475 (major rejection zone).
Liquidity Magnet: 3500 (ATH cluster).
Demand Ladders: 3435–3425 → 3415–3405 → 3395–3380 → 3375–3360.
Bias: Bullish above 3435–3425. Bearish only under 3395–3380.
🎯 Bottom Line (September Setup)
Upside path: Break 3460–3500 → sweep ATH 3500 → 3520–3530 → 3600+.
Downside path: Rejection at 3460–3500 → correction 3400 → 3360.
Big liquidity re-accumulation: 3250–3120 (if deeper pullback).
Catalyst: NFP (Sept 5) likely decides whether Gold expands higher or retraces.
📌 Educational only, not financial advice

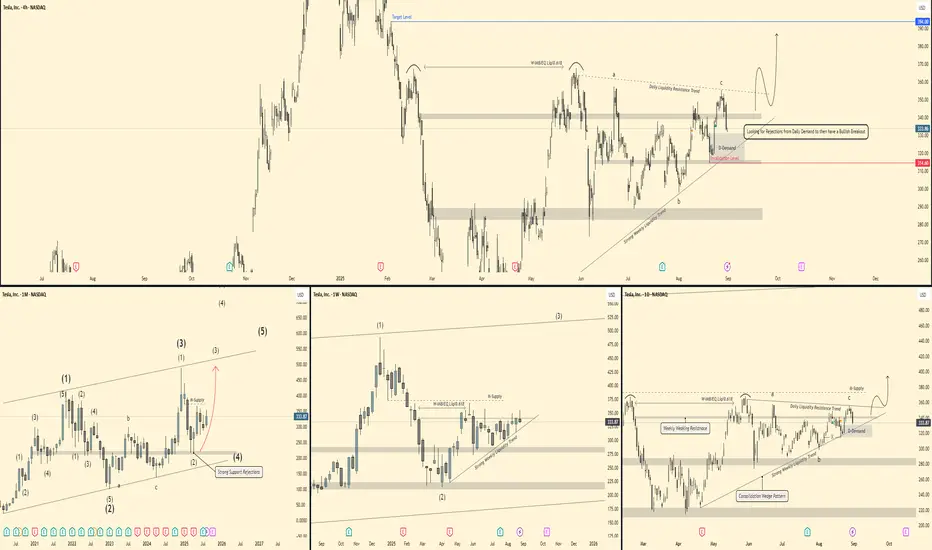
Tesla - Mutli-timeframe breakdown 🕰 Monthly View
Price is respecting a long-term ascending channel.
Strong rejections from support confirm bullish momentum.
Current wave count suggests we are working through a larger impulsive structure – potential for Wave (3) continuation higher.
If momentum holds, upside could target the 450–500 zone in the longer run.
📆 Weekly View
Structure shows a 3-wave correction complete (ABC) into demand.
Price has tapped weekly demand + liquidity trendline.
Currently bouncing, with a breakout potential toward 375–400 (supply zone).
Breakout of the wedge pattern would confirm strength and continuation higher.
📅 Daily View
Price is reacting off Daily Demand (≈320–325 zone).
Strong liquidity resistance trend overhead (≈355–365).
If rejections hold and demand stays valid, a bullish breakout setup forms → target near 390–400.
Invalidation if we close below 314 (daily demand break).
⏱ 4H View
Local liquidity sweep into demand.
Bullish scenario: push toward 350–355 short-term.
Watch for confirmation: rejection candles + momentum shift needed before entry.
🎯 Bias & Trade Idea
Bias: Bullish (buy from demand)
Entry Zone: 320–330 (Daily Demand)
Targets:
Short-term → 355
Mid-term → 390–400
Invalidation: Daily close below 314
⚠️ Risk Note
Tesla is highly volatile. Stick to clear confirmations at demand before entry, and manage risk tightly below invalidation.
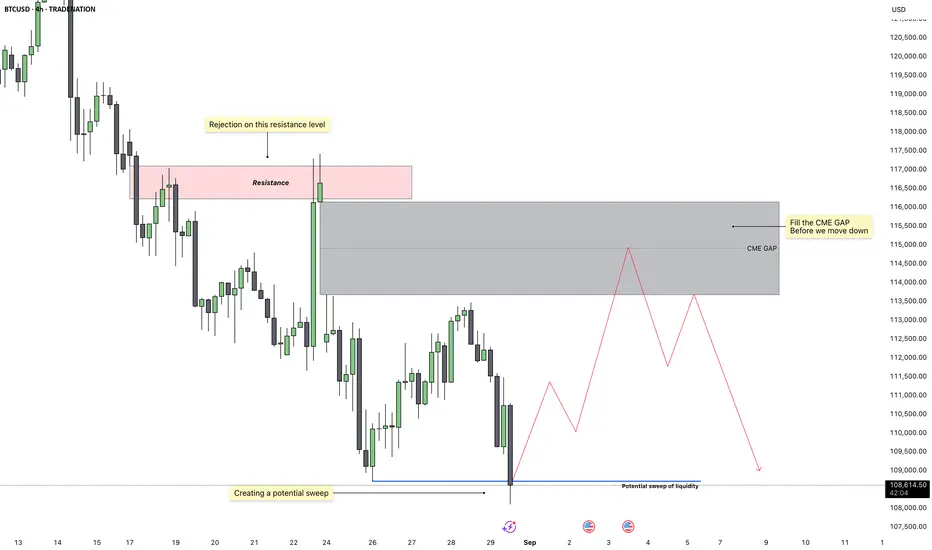
Bitcoin – Next Week Outlook: Liquidity Sweep Then Gap FillBitcoin has been trading inside a broader downtrend, with repeated rejections at key resistance levels confirming bearish pressure. Recently, we saw price reject strongly at a 4H resistance zone, which set the stage for another leg down. However, before extending lower, there is still an unfilled CME gap above, and history shows that these gaps are often targeted before the market makes its next decisive move.
Liquidity Sweep
The most recent drop into the 108,500 zone appears to have created a potential liquidity sweep. Price dipped below a short-term low, likely grabbing stop losses and inducing traders into shorts, which could fuel a reversal back upward. This kind of move often signals accumulation before the market retraces higher.
CME Gap Dynamics
The CME gap between 114,000 and 116,000 remains unfilled, making it a strong magnet for price. Bitcoin has a clear tendency to revisit and fill these inefficiencies, and until that gap is resolved, I am leaning toward another upward push. The gap aligns with the rejection area from the previous resistance, so it would be a logical point for price to revisit before resuming the downward move.
Short-Term Scenarios
If Bitcoin holds above the recent liquidity sweep and builds strength on lower timeframes, I expect a climb back toward the CME gap. Once that gap is filled, the reaction from 115,000–116,000 will be key. If sellers defend that level again, the market could set up for another decline, targeting the lows around 109,000 and potentially lower. On the other hand, a clean break and acceptance above 116,000 would challenge the bearish bias, but for now that is less likely given the trend context.
Expectations and Targets
The primary expectation is for Bitcoin to rally back into the 114,000–116,000 zone to fill the CME gap. From there, I anticipate sellers to step in again, driving price back down toward 110,000 and possibly retesting the sweep lows. This sequence of liquidity sweep, gap fill, and bearish continuation would align with the current market structure.
Conclusion
In summary, Bitcoin has swept liquidity at the lows and now has unfinished business above with the CME gap. A move up into that gap looks probable before we see continuation to the downside. As long as price respects the 4H resistance zone after the gap is filled, I will maintain a bearish outlook with eyes on new lows afterward.
Disclosure: I am part of Trade Nation's Influencer program and receive a monthly fee for using their TradingView charts in my analysis.
___________________________________
Thanks for your support!
If you found this idea helpful or learned something new, drop a like 👍 and leave a comment, I’d love to hear your thoughts! 🚀
Gold Analysis – 15-Minute Timeframe (August 30, 2025)Considering the RSI is in overbought territory and a clear bearish divergence is present, it seems inevitable for gold to react to the highlighted resistance zone (red area).
✅ While the suggested take-profit (TP) target might be slightly ambitious—and geopolitical developments could prevent price from reaching the blue order block—technically, it's not unlikely for price to resume its bullish movement from that zone.
📌 If a valid setup forms, I’ll definitely enter a short (Sell) position.
Good luck and happy trading! 🌟

CRUDE OIL Short From Resistance! Sell!
Hello,Traders!
CRUDE OIL made a retest
Of the horizontal resistance
Of 65.00$ from where
We are already seeing a
Bearish reaction and we
Will be expecting a
Further bearish move down
Sell!
Comment and subscribe to help us grow!
Check out other forecasts below too!
Disclosure: I am part of Trade Nation's Influencer program and receive a monthly fee for using their TradingView charts in my analysis.

TESLA RISING SUPPORT|LONG|
✅TESLA is trading in an uptrend
Along the rising support line
Which makes me bullish biased
And the pair is about to retest the rising support
Thus, a rebound and a move up is expected
With the target of retesting the level above at 350$
LONG🚀
✅Like and subscribe to never miss a new idea!✅

DXY WILL GO UP|LONG|
✅DXY fell again to retest
The support of 97.600
But it is a strong key level
So I think that there is a high chance
That we will see a bullish
Rebound and a move up
LONG🚀
✅Like and subscribe to never miss a new idea!✅

GBP_AUD POTENTIAL LONG|
✅GBP_AUD has retested
A key support level of 2.0600
And as the pair is already
Making a bullish rebound
A move up to retest the
Supply level above
At 2.0684 is likely on Monday
LONG🚀
✅Like and subscribe to never miss a new idea!✅

SILVER BULLISH BREAKOUT|LONG|
✅SILVER is going up currently
And the price broke the key structure level of 39.52$
Which is now a support, and after the pullback
And the retest, I think the price will go up
LONG🚀
✅Like and subscribe to never miss a new idea!✅

CHF-JPY Resistance Ahead! Sell!
Hello,Traders!
CHF-JPY made a strong
Move up and the pair is
Locally overbought so
After the pair hits the horizontal
Resistance above at 184.100
From where we will be
Expecting a local correction
On Monday!
Sell!
Comment and subscribe to help us grow!
Check out other forecasts below too!
Disclosure: I am part of Trade Nation's Influencer program and receive a monthly fee for using their TradingView charts in my analysis.

EUR_CAD LOCAL SHORT|
✅EUR_CAD went up to retest
A horizontal resistance level of 1.6080
Which makes me locally bearish biased
And I think that a move down
From the level is to be expected
Towards the target below at 1.6050
SHORT🔥
✅Like and subscribe to never miss a new idea!✅

EUR-CHF Will Fall! Sell!
Hello,Traders!
EUR-CHF made a retest
Of the horizontal resistance
Of 0.9370 from where we
Are already seeing a local
Bearish correction and a
Further bearish move down
Is to be expected on Monday!
Sell!
Comment and subscribe to help us grow!
Check out other forecasts below too!
Disclosure: I am part of Trade Nation's Influencer program and receive a monthly fee for using their TradingView charts in my analysis.

USD-JPY Local Long! Buy!
Hello,Traders!
USD-JPY is going down
To retest the horizontal
Support around 149.290
And after the retest we
Will be expecting a local
Bullish rebound and
A move up on Monday
Buy!
Comment and subscribe to help us grow!
Check out other forecasts below too!
Disclosure: I am part of Trade Nation's Influencer program and receive a monthly fee for using their TradingView charts in my analysis.

AUD_USD WILL GO UP|LONG|
✅AUD_USD is going up
Now and the pair made a bullish
Breakout of the key horizontal
Level of 0.6525 and the breakout
Is confirmed so we are bullish
Biased and we will be expecting
A further bullish move up
LONG🚀
✅Like and subscribe to never miss a new idea!✅

NZD-USD Will Keep Growing! Buy!
Hello,Traders!
NZD-USD is going up
And the pair made a bullish
Breakout of the key horizontal
Level around 0.5880 and the
Breakout is confirmed so
We are bullish biased
And we will be expecting
A further bullish move up
On Monday!
Buy!
Comment and subscribe to help us grow!
Check out other forecasts below too!
Disclosure: I am part of Trade Nation's Influencer program and receive a monthly fee for using their TradingView charts in my analysis.

EUR-USD Bearish Bias! Sell!
Hello,Traders!
EUR-USD keeps growing
But a horizontal resistance
Level of 1.1740 is nearby
So after the retest of the
Level we will be expecting
A local bearish correction
On Monday!
Sell!
Comment and subscribe to help us grow!
Check out other forecasts below too!
Disclosure: I am part of Trade Nation's Influencer program and receive a monthly fee for using their TradingView charts in my analysis.

GBPUSD BUY SETUP AGAIN LOOOOOOOOONGI explained before that the price will make an impulsive wave upward
as in this picture
and now It could make impulsive wave and retested as in picture
and now I Wait big impulsive wave uptrend
and the price break the flag and retested so I will buy with you

GBPUSD SETUP BUY AGAINWhat do you think?
in my opinion, the price will fall to demand area
AND THIS DEMAND AREA is strong as it could break downtrend line
so I will buy from this area ,but when the price make rejection from this area or when reflected
And you can look on this analysis in down

XAUUSD (GOLD) 30M – Intraday PlanPrice is trading between $3,387.70 (resistance) and $3,367.84 (support). Currently sitting mid-range around $3,377, with both sides still open.
🔼 Bullish Plan
Trigger: 30m body close above $3,387.70.
Targets: First push into $3,389.59, then $3,391.19. Momentum extension possible into $3,392+.
Management: Partial profits at first target, move SL to breakeven once $3,387 is defended.
🔽 Bearish Plan
Trigger: Clean 30m close below $3,367.84.
Targets: First into $3,365.16, then $3,362.88, with extension risk toward $3,361.28.
Management: Scale at each level, trail stops if downside expands.
⚡ Range Scalp (riskier)
Shorts: Rejection at $3,387–$3,388, targeting $3,377–$3,378, SL above rejection.
Longs: Bounces from $3,368 zone, targeting $3,376–$3,377, SL below wick lows.
Use smaller size — chop can reverse fast.
✅ Confirmation for Break
Strong 30m body close through key level.
Momentum follow through after breakout.
❌ Invalidation
Breakout closes back inside the range (fakeout).
Multiple wicks through level with no follow through.
📌 Bottom Line: Waiting for a decisive 30m close outside $3,367.84–$3,387.70. Upside focus above $3,387.70 into $3,391.19. Downside focus below $3,367.84 toward $3,362.88–$3,361.28.

CHF_JPY RISING SUPPORT AHEAD|LONG|
✅CHF_JPY is trading along the rising support
And as the pair will soon retest it
I am expecting the price to go up
To retest the supply levels above at 183.520
LONG🚀
✅Like and subscribe to never miss a new idea!✅
