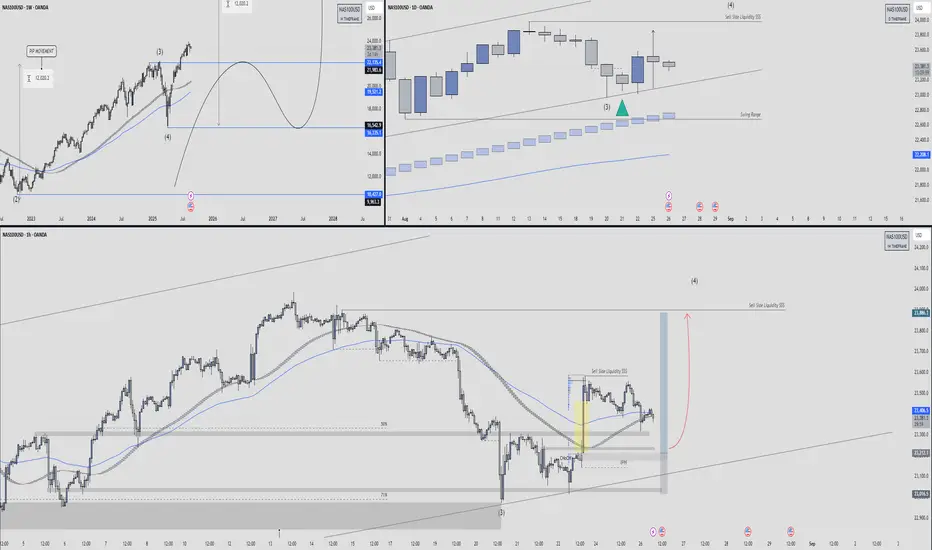
Nas100 Breakdown with Trade Setup🕰 Weekly Structure
Price has completed a Wave (3) high and is now transitioning into a corrective Wave (4) phase.
The broader market cycle suggests sell-side liquidity is being targeted before any new impulsive leg higher.
The EMA structure is still bullish long-term, but retracements are healthy after extended rallies.
Key downside zones:
21,985 – 22,135 (mid-support pocket)
16,962 – 16,353 (deeper retracement if correction extends)
📉 Daily Timeframe
Current daily candles are rejecting the upper levels after tagging swing-high liquidity.
Price is consolidating near the swing range support line (~22,700–23,200).
Buyers are defending the level marked by the green triangle, aligning with a previous Wave (3) pivot.
If this level holds, we may see a relief rally targeting 23,800–24,200 before deciding the next move.
⏱ 1H Short-Term View
Price recently tapped into sell-side liquidity (SSS) and bounced from the 71% fib retracement + demand zone.
A change of character (ChoCH) is visible from the highlighted yellow candle, indicating buyers are stepping in.
Expect a possible bullish leg toward 23,800 – 24,000 if higher-low structure confirms.
If 23,200 fails, downside liquidity sits at 23,000 → 22,700.
🎯 Trade Plan
Bias: Short-term bullish relief rally inside larger corrective Wave (4).
Entry Zone: 23,200 – 23,400 demand retest.
Target 1: 23,800 (SS liquidity pocket)
Target 2: 24,000–24,200 (daily resistance)
Invalidation: Sustained close below 23,000 → opens path to 22,200.
📌 Summary
NAS100 looks corrective after a strong multi-month bullish wave. Near-term, liquidity sweep setups favor a bounce into 23,800+ as long as 23,000 holds. Medium-term, Wave (4) correction could extend deeper into 22k–20k levels before the next major bullish wave.
SMC
EUR-GBP Local Short! Sell!
Hello,Traders!
EUR-GBP made a retest
Of the horizontal resistance
Of 0.8651 from where
We are already seeing a
Local pullback and we will
Be expecting a further
Bearish move down
Sell!
Comment and subscribe to help us grow!
Check out other forecasts below too!
Disclosure: I am part of Trade Nation's Influencer program and receive a monthly fee for using their TradingView charts in my analysis.

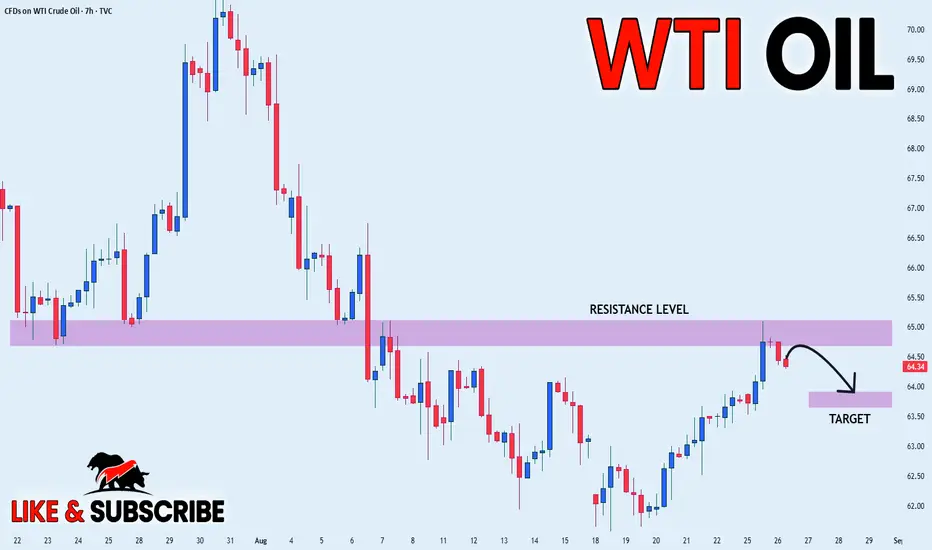
CRUDE OIL SHORT FROM RESISTANCE|
✅CRUDE OIL has retested a key resistance level of 65.10$
And as the price is already making a bearish pullback
A move down to retest the demand level below at 63.85$ is likely
SHORT🔥
✅Like and subscribe to never miss a new idea!✅
NZD_CAD WILL GO DOWN|SHORT|
✅NZD_CAD has been growing recently
And the pair seems locally overbought
So as the pair has approached
A horizontal resistance of 0.8120
Price fall is to be expected
SHORT🔥
✅Like and subscribe to never miss a new idea!✅

NZD-JPY Will Fall! Sell!
Hello,Traders!
NZD-JPY was making a
Strong bullish rebound
But the pair is trading in a
Downtrend so after it hits
The horizontal resistance
Above at 86.827 from where
We will be expecting a
Bearish move down
Sell!
Comment and subscribe to help us grow!
Check out other forecasts below too!
Disclosure: I am part of Trade Nation's Influencer program and receive a monthly fee for using their TradingView charts in my analysis.

GBP_AUD LONG FROM SUPPORT|
✅GBP_AUD is going down now
But a strong support level is ahead at 2.0750
Thus I am expecting a rebound
And a move up towards the target of 2.0785
LONG🚀
✅Like and subscribe to never miss a new idea!✅

EUR-USD Risky Long! Buy!
Hello,Traders!
EUR-USD made a sharp
Move down in one candle
Which looks very risky
But the pair is also locally
Overbought and as a horizontal
Support level is ahead
At 1.1592 we will be
Expecting a local
Bullish rebound
Buy!
Comment and subscribe to help us grow!
Check out other forecasts below too!
Disclosure: I am part of Trade Nation's Influencer program and receive a monthly fee for using their TradingView charts in my analysis.

EURUSD ShortEURUSD 4H – Short Setup from Supply Zone
Price is approaching a key supply zone around 1.1746 – 1.1792. This level acted as strong resistance before, leading to a sharp drop, so I’ll be watching for a possible rejection here.
📌 Plan:
Entry: Inside the supply zone (1.1746 area)
Stop Loss: Above zone (1.1792)
Target: 1.1613 support area
The idea is simple: if sellers step in again at this zone, we could see another move lower.
⚠️ Not financial advice – just sharing my setup.

Gold (XAUUSD) – Weekly Outlook 25th - 30th Aug🚀 Hey Traders—happy new week! ✨
Powell’s Friday speech gave gold a fresh momentum push, but price remains trapped inside a wide Daily range. With no high-impact news on Monday, we’re likely looking at range-bound action until Tuesday’s USD data starts driving direction.
A few of you have asked me to do daily posts—truth is, I’m a swing trader both in markets and in life 😅 so I stick to weekly outlooks. That said, swings aren’t static. Plans adjust as micro-economic data, global politics, and of course the biggest catalysts—POTUS & the Fed—shift the narrative.. Lets dive down to the action plan :
🔸 Macro & News Context
This week is USD-driven with heavy catalysts:
Tue 26th → Core Durable Goods, CB Confidence
Thu 28th → Jobless Claims, GDP Price Index
Fri 29th → Core PCE (Fed’s key inflation gauge) + Waller speech
⚡ Mid-week (Wed) → low data → expect technical price action before volatility into Thu–Fri.
🔸 Weekly Structure
Trend: Bullish on HTF (above EMA21/EMA50)
Range: 3300–3350 = premium consolidation
Liquidity:
Buy-side → above 3350–3439
Sell-side → below 3260–3280
Key Zones
Supply: 3350–3439 (weekly wick supply)
Demand: 3320–3300, deeper 3260–3205
Upside Targets: 3520–3530 (1.272 Fibo), 3635–3650 (1.618 Fibo)
🔸 Scenarios
🟢 Bullish Case
Break & close above 3439 → upside expansion to 3520–3530.
Weak USD data (soft GDP / low PCE) = momentum fuel.
🔴 Bearish Case
Rejection at 3350–3439 + strong US data → pullback into 3300, deeper to 3260–3205.
🔸 Daily (D1) Bias
Price ~3372, ranging 3320–3439.
Support: 3320–3340 demand (line in sand for bulls).
Supply steps: 3380–3410 → 3439 → 3470–3485 → 3500.
Above 3500 = fib extensions 3520–3530, 3635–3650.
🔸 H4 Bias
Range: 3320 demand ↔ 3450 supply.
Break above 3450 → path to 3470–3500 / 3520–3540.
Break below 3320 → downside to 3300 → 3240.
🔸 H1 Intraday Map
Decision Zone: 3370–3330 FVG.
Primary Buy: 3340–3325 demand → targets 3370, 3395–3405.
Primary Sell: 3395–3405 supply → rejection back to 3340–3325.
Break of 3325 or 3405 → defines day momentum.
🎯 Conclusion
This week is range-to-breakout:
Above 3439 → bullish expansion into 3520–3530.
Below 3320 → deeper demand retest 3260–3240.
Until then → expect intraday liquidity sweeps between 3320–3439.
Patience > chasing. Wait for M15/M30 confirmations (BOS, inducement sweeps, FVG reclaims) inside these zones.
Disclaimer: For educational context only.

SILVER MOVE DOWN AHEAD|SHORT|
✅SILVER is about to retest
A key structure level of 39.50$
Which implies a high likelihood
Of a move down as some market
Participants will be taking profit
From long positions while others
Will find this price level to be
Good for selling so as usual we
Will have a chance to ride the
Wave of a bearish correction
SHORT🔥
✅Like and subscribe to never miss a new idea!✅

GOLD IS OVERBOUGHT|SHORT|
✅GOLD will be retesting a resistance
Level of 3388$ soon from where
I am expecting a bearish reaction
With the price going down but we need
To wait for a reversal pattern to form
Before entering the trade, so that we
Get a higher success probability of the trade
SHORT🔥
✅Like and subscribe to never miss a new idea!✅

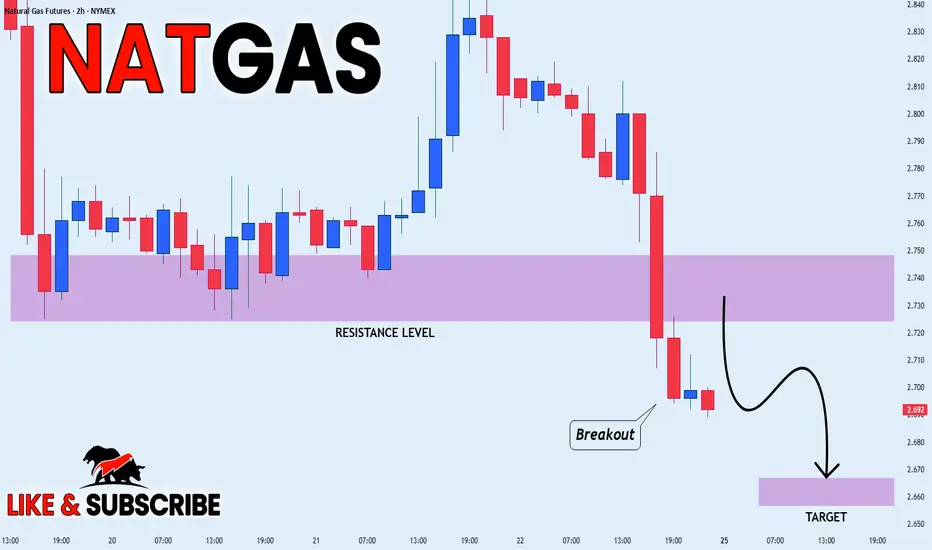
NATGAS WILL KEEP FALLING|SHORT|
✅NATGAS is going down currently
As the Gas broke the key structure level of 2.73$
Which is now a resistance, and after the pullback
And retest, I think the price will go further down
SHORT🔥
✅Like and subscribe to never miss a new idea!✅
CRUDE OIL Pullback Ahead! Sell!
Hello,Traders!
CRUDE OIL is etching closer
And closer towards the
Horizontal resistance of 64.60$
So as we are bearish biased
We will be expecting a local
Pullback on Monday
After the retest
Sell!
Comment and subscribe to help us grow!
Check out other forecasts below too!
Disclosure: I am part of Trade Nation's Influencer program and receive a monthly fee for using their TradingView charts in my analysis.

GOLD Resistance Ahead! Sell!
Hello,Traders!
GOLD is trading in a
Strong uptrend and Gold
Made some epic gains
On Friday but now it
Is locally overbought
So after Gold hits a horizontal
Resistance level above
At 3390$ we will be
Expecting local bearish
Correction on Monday
Sell!
Comment and subscribe to help us grow!
Check out other forecasts below too!
Disclosure: I am part of Trade Nation's Influencer program and receive a monthly fee for using their TradingView charts in my analysis.

NZD-CAD Local Pullback! Sell!
Hello,Traders!
NZD-CAD made a sharp
Bullish move up and hit
A horizontal resistance
Of 0.8130 and the pair
Failed to break the level
So we are locally bearish
Biased and we will be expecting
A local bearish correction
On Monday!
Sell!
Comment and subscribe to help us grow!
Check out other forecasts below too!
Disclosure: I am part of Trade Nation's Influencer program and receive a monthly fee for using their TradingView charts in my analysis.

AUD-NZD Will Keep Growing! Buy!
Hello,Traders!
AUD-NZD is trading in an
Uptrend and the pair
Made a bullish breakout
Of the key horizontal
Level of 1.1032 which
Is now a support then
Made a retest and is
Already making a strong
Bullish rebound so we are
Bullish biased and we will
Be expecting a further
Bullish move up
Buy!
Comment and subscribe to help us grow!
Check out other forecasts below too!
Disclosure: I am part of Trade Nation's Influencer program and receive a monthly fee for using their TradingView charts in my analysis.

USD_JPY POTENTIAL LONG|
✅USD_JPY fell again to retest
The support of 146.500
But it is a strong key level
So I think that there is a high chance
That we will see a bullish rebound and a move up
LONG🚀
✅Like and subscribe to never miss a new idea!✅

BITCOIN LOCAL LONG|
✅BITCOIN went down to retest
A local horizontal support of 114,6k
While trading in a strong uptrend
Which makes me locally bullish biased
And I think that a move up
From the level is to be expected
Towards the target above at 115,6k
LONG🚀
✅Like and subscribe to never miss a new idea!✅

EUR-CAD Bullish Breakout! Buy!
Hello,Traders!
EUR-CAD is trading in a
Strong uptrend and the
Pair is made a bullish
Breakout of the key
Horizontal level of 1.6180
Which is now a support
And as the breakout is
Confirmed we will be
Expecting a further bullish
Continuation on Monday
Buy!
Comment and subscribe to help us grow!
Check out other forecasts below too!
Disclosure: I am part of Trade Nation's Influencer program and receive a monthly fee for using their TradingView charts in my analysis.

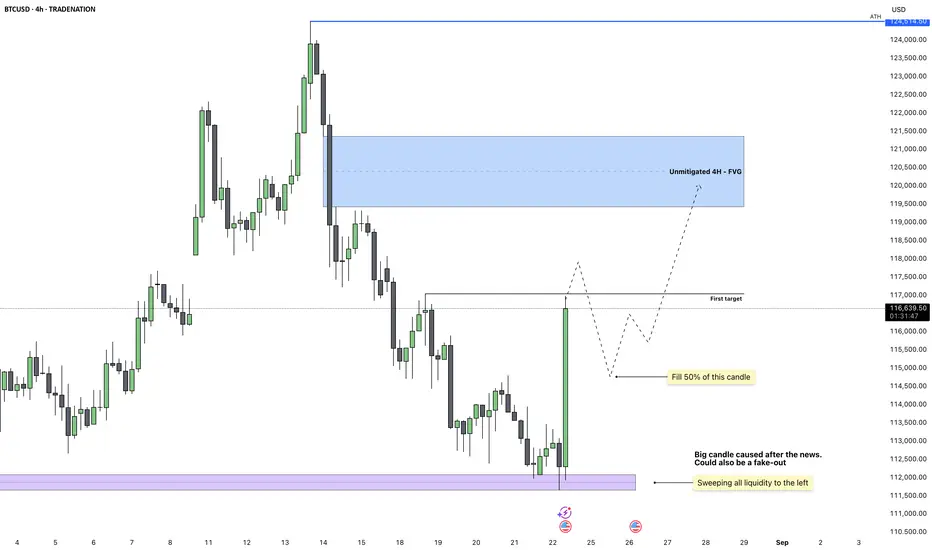
Bitcoin - A Deep Sweep Setting Up the Next ExpansionBitcoin just swept the monthly low of August as well as the previous day’s low. This was a clear liquidity grab that lined up with today’s bullish momentum in the market. The strong reaction from this zone shows that buyers were waiting for these liquidity levels to get cleared before stepping in.
Liquidity Sweep and Reaction
The sweep was significant because it cleared out resting sell-side liquidity to the left. This kind of move usually sets the stage for a reversal, and the large impulse candle confirms strong demand stepping in. While some might see this as just a reaction to external events, the technical picture supports continuation higher.
Immediate Target
The first target is sitting around 117,000. This level lines up with short-term inefficiencies and is a logical magnet for price in the coming sessions. I expect this liquidity pool to be swept before any meaningful retracement.
Retracement Expectation
After hitting the first target, I anticipate a move back down to fill around 50% of the large green impulse candle. Big candles like this often retrace partially before continuing their main direction. That retracement will provide a cleaner structure and a chance for re-entries on lower timeframes.
Higher-Timeframe Objective
Once the retracement plays out, the bigger objective sits higher at the unmitigated 4H fair value gap around 120,500. This area remains untouched and is likely to act as a price magnet as the market seeks balance.
Conclusion
The sweep of key lows combined with the strong impulsive move is a bullish development. I expect price to first tag 117,000, then retrace into the large candle before resuming higher towards the 4H FVG.
Disclosure: I am part of Trade Nation's Influencer program and receive a monthly fee for using their TradingView charts in my analysis.
___________________________________
Thanks for your support!
If you found this idea helpful or learned something new, drop a like 👍 and leave a comment, I’d love to hear your thoughts! 🚀
USD_CAD BULLISH REBOUND AHEAD|LONG|
✅USD_CAD fell down sharply
But a strong support level was hit at 1.3820
Thus as a rebound is already happening
A move up towards the target of 1.3840 shall follow
LONG🚀
✅Like and subscribe to never miss a new idea!✅

USD-JPY Will Go UP! Buy!
Hello,Traders!
USD-JPY is making a nice
Rebound form the horizontal
Support of 146.350 after a
Strong move down and as
We are locally bullish biased
We will be expecting a
Local bullish rebound
Buy!
Comment and subscribe to help us grow!
Check out other forecasts below too!
Disclosure: I am part of Trade Nation's Influencer program and receive a monthly fee for using their TradingView charts in my analysis.

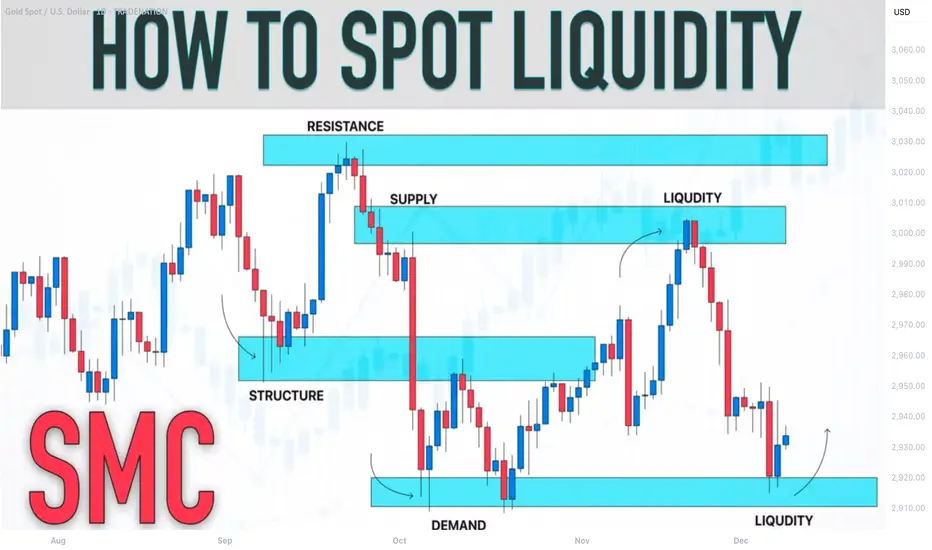
SMC Trading Basics. Liquidity Zones & How to Identify Them
In the today's article, I will teach you the concept of liquidity zones and how to identify them properly, trading Forex, Gold, Crypto and Indexes.
Simply put, a liquidity zone is a certain area on a price chart where a significant concentration of trading volumes occurred.
Huge trading volumes signify the presence of big players: hedge funds, banks, etc...
Correct identification of liquidity zones is essential for smart money trading, because such zones provide the safest and the most profitable trading opportunities.
There are 3 common characteristics of a valid liquidity zone:
1. Huge volume spikes upon its test
Take a look at the underlined blue area on USDCAD.
We see sharp volume spikes when the market was testing that area.
2. Strong rejections from such an area with a formation of long wicks
Look how the price reacts to the liquidity zone on USDJPY.
We see multiple strong rejections from that.
3. Long consolidation within that zone
Bitcoin was "standing" on a liquidity zone for more than 3 weeks, barely moving while trading volumes were quietly accumulating.
4. Multiple strong bullish or bearish reactions to that area
Just look how many times the underlined area was respected by the buyers and by the sellers. That is a perfect example of a liquidity zone.
To underline a liquidity zone properly, follow these simple rules:
1. If the price is ABOVE the liquidity zone, its lower boundary
will be the lowest wick within that area and its upper boundary will be the lowest candle close. Such a liquidity zone will be called a demand area.
Here is the example of drawing a liquidity zone on GBPUSD.
The lower boundary of the zone is the lowest wick, while its upper boundary is the lowest candle close.
2. If the price is BELOW the liquidity zone, its upper boundary will be the highest wick within that area and its lower boundary will be the highest candle close. Such a liquidity zone will be called a supply area.
Here is the liquidity zone that I identified on Gold following our rules.
Remember, that you can identify liquidity zones on any time frame. However, the rule is that the higher is the time frame, the stronger is the liquidity zone.
I prefer to analyze the liquidity zones on a daily time frame.
Once you underlined liquidity zones, you should realize that within these areas, big players are expected to place their orders in the future.
For that reason, after the tests of such areas, a strong bullish or bearish movements will be expected.
Here is a huge liquidity zone that I spotted on GBPJPY.
Look at a strong bearish movement that initiated after its test.
Your task as a smart money trader will be to identify bullish or bearish confirmations and understand the intentions of big players. With experience, you will learn to recognize valid signals.
❤️Please, support my work with like, thank you!❤️
I am part of Trade Nation's Influencer program and receive a monthly fee for using their TradingView charts in my analysis.