GBPAUD: Another Trap?! 🇬🇧🇦🇺
GBPAUD may finally start retracing after a test of a historic daily resistance.
I see a local intraday bearish reversal and anticipate a down movement
to 2.0914
❤️Please, support my work with like, thank you!❤️
I am part of Trade Nation's Influencer program and receive a monthly fee for using their TradingView charts in my analysis.
SMC

EURUSD will be bearish soonThere is a liquidity swing above the internal bullish structure, after which there is a strong order block from which the price may rebound and drop to the liquidity zones it left below. Of course, it is not possible to be certain that the price will bounce from this ob unless a rejection + internal choch signal appears to confirm the drop to these liquidity areas.

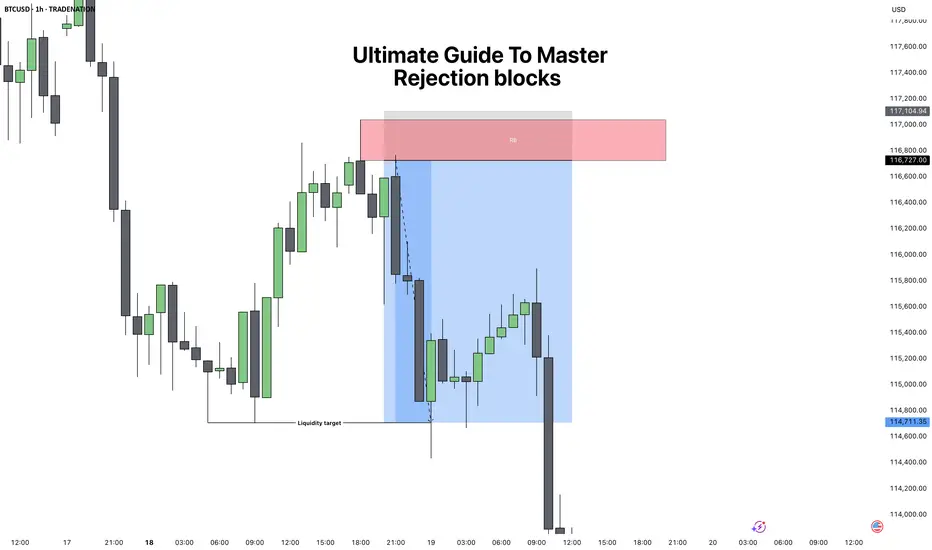
Ultimate Guide to Master: Rejection BlocksRejection Blocks (ICT Concept) – Complete Guide
1. What is a Rejection Block?
A rejection block is a special type of price level that forms when the market attempts to push through but gets denied and reverses. Unlike a traditional order block, which represents accumulation or distribution by institutions, a rejection block shows a failed attempt to continue in one direction. It is a footprint of rejection and often becomes a strong reaction zone in the future.
There are two types:
Bullish Rejection Block:
Forms from a bearish candle whose low is taken out, but price fails to continue lower and closes back above. The low of that candle becomes the key level.
Bearish Rejection Block:
Forms from a bullish candle whose high is breached, but price fails to continue higher and closes back inside. The high of that candle becomes the key level.
These levels can act as hidden support or resistance and often serve as high-probability entry points when combined with market structure.
2. How to Spot a Valid Rejection Block
To correctly identify rejection blocks, you need to look for:
1. Clear Attempt Beyond a Candle
Price must trade beyond the high or low of a prior candle, suggesting continuation.
2. Failure and Return
After breaching the level, price fails and closes back inside the candle’s body.
3. Liquidity Context
A rejection block is more powerful if the wick that caused it swept liquidity (equal highs/lows or a previous key level).
4. Higher Timeframe Confluence
The best rejection blocks line up with higher timeframe bias (for example, spotting a bearish rejection block inside a 4H premium zone during a downtrend).
3. How to Trade Rejection Blocks
Trading them involves waiting for price to come back to the rejection block level and using it as an entry or reaction zone.
Bullish Setup:
When price trades below a bearish candle, fails, and closes higher, mark the low of that candle. On a retracement, price often retests that level as support.
Bearish Setup:
When price trades above a bullish candle, fails, and closes lower, mark the high of that candle. On a retracement, price often retests that level as resistance.
Entry Technique:
You can enter "blindly" when you're understanding the confluences. But to begin with do this Instead, when price returns to the rejection block, drop to a lower timeframe and look for confirmation such as:
* Fair Value Gap (FVG) entries.
* Market Structure Shift (MSS).
* Liquidity sweeps into the level.
Stop Loss Placement:
Always place stops beyond the rejection candle itself (above the high for bearish RB, below the low for bullish RB).
4. Practical Examples and Market Context
Rejection blocks work best when they appear in the following situations:
Liquidity Sweeps:
After equal highs or equal lows are taken out, a rejection block often marks the failure point.
Inside Premium/Discount Zones:
In a bearish bias, look for bearish RBs in premium pricing. In a bullish bias, look for bullish RBs in discount pricing.
During Consolidation Breakouts:
If the market fakes a breakout and closes back inside, the rejection block often becomes the level to fade the fake move.
For example, if BTC takes out a prior daily high, prints a rejection block, and then closes back inside, the odds of reversal are high, especially if price was already in premium territory.
5. Combining Rejection Blocks with ICT Concepts
To increase accuracy, always combine RBs with ICT’s other tools:
Fair Value Gaps:
If a rejection block aligns with an FVG, it adds strength to the level.
Market Structure Shifts:
A rejection block is more powerful if followed by displacement and an MSS.
CISD Pattern:
A rejection block often forms right after the “Stop Hunt” part of the CISD sequence, serving as a clean entry.
Liquidity Pools:
Look for RBs near equal highs/lows, old highs/lows, or session liquidity (London/New York).
Conclusion
Rejection blocks are subtle but highly effective levels that show where the market tried to extend but failed, leaving behind a hidden form of support or resistance. By themselves they are useful, but when combined with ICT concepts like liquidity sweeps, MSS, and FVGs, they become powerful entry tools. The key is to always wait for price to return and confirm the level before entering, and to only trade them in alignment with higher timeframe bias.
Disclosure: I am part of Trade Nation's Influencer program and receive a monthly fee for using their TradingView charts in my analysis.
___________________________________
Thanks for your support!
If you found this idea helpful or learned something new, drop a like 👍 and leave a comment, I’d love to hear your thoughts! 🚀
SILVER BEARISH BREAKOUT|SHORT|
✅SILVER broke the key
Structure level of 37.60$
And the breakout is confirmed
Which makes me bearish biased
And I think that after the retest of
The broken level is complete
A bearish continuation will follow
SHORT🔥
✅Like and subscribe to never miss a new idea!✅

EUR-USD Local Long! Buy!
Hello,Traders!
EUR-USD is making a local
Bearish correction following
The general USD strengthening
All across the board today
But the pair will soon
Retest a local horizontal
Support below at 1.1632
From where we will be
Expecting a local
Bullish rebound
Buy!
Comment and subscribe to help us grow!
Check out other forecasts below too!
Disclosure: I am part of Trade Nation's Influencer program and receive a monthly fee for using their TradingView charts in my analysis.

USD_CAD RSISTANCE AHEAD|SHORT|
✅USD_CAD is going up to retest
A horizontal resistance of 1.3880
Which makes me locally bearish biased
And I think that we will see a pullback
And a move down from the level
Towards the target below at 1.3847
SHORT🔥
✅Like and subscribe to never miss a new idea!✅

ETHEREUM Strong Support Ahead! Buy!
Hello,Traders!
ETHEREUM is falling down
Now but as it is trading in a
Strong uptrend we are
Bullish biased so after it
Hits the strong horizontal
Support level below at 4,000$
A strong bullish rebound
Is to be expected
Buy!
Comment and subscribe to help us grow!
Check out other forecasts below too!
Disclosure: I am part of Trade Nation's Influencer program and receive a monthly fee for using their TradingView charts in my analysis.

GOLD Bearish Breakout! Sell!
Hello,Traders!
GOLD made a bearish
Breakout of the key
Horizontal level of 3,329$
Which is now a resistance
And the breakout is confirmed
So after the potential pullback
And retest we will be expecting
A further bearish move down
Sell!
Comment and subscribe to help us grow!
Check out other forecasts below too!
Disclosure: I am part of Trade Nation's Influencer program and receive a monthly fee for using their TradingView charts in my analysis.

$XAUUSD Mark-Up XAUUSD LTF Analysis - Aug 19
Analysis Notes:
On the 4H timeframe, the price has entered a ranging structure and is currently within the 4H IFC.
My expectation is that after the IFC is consumed, the price will move towards the weak high and the liquidity levels.
You can look for entry confirmations on lower timeframes.
Follow us to never miss more analyses.

Break of Structure VS Liquidity Grab. How to Identify Valid BoS
The main problem with break of structure trading is that you can easily confuse that with a liquidity grab.
But don't worry.
There is a secret SMC price model that will help you to confirm a break of structure in a second.
Learn smart money concepts trading secrets and a simple strategy to trade break of structure on any forex pair.
Let's study a break of structure that I spotted on AUDUSD forex pair.
We see that the market is bullish on a daily time frame and the price has just violated a previous high with a break of structure.
The issue with that is the fact that such a violation can easily be a liquidity grab and a bullish trap .
Buying the market immediately after a BoS, we can incur a huge loss .
We need something that would help us to accurate validate that.
Fortunately, there is a simple price model in SMC that will help.
After you spotted a break of structure on a daily time frame,
use a 4h time frame for its validation.
After a BoS on a daily time frame, the market usually starts retracing , setting a new local high.
To confirm that it is not a trap, you will need a break of THAT structure on a 4H time frame.
It will increase the probabilities that the entire bullish movement that you see on a daily is not a manipulation.
Here is what exactly we need.
After the price violated a daily structure and closed above that, we see a minor intraday retracement on a 4h time frame.
A bullish violation of the last high there is our BoS confirmation and a clear indicator of the strength of the buyers.
You can execute a buy trade, following a simple strategy then.
Set a buy limit order on a retest of a broken high on a 4H,
a stop loss should be below the last higher low,
a take profit is based on the next supply zone on a daily.
To avoid the traps, a single time frame is not enough for profitable trading break of structure.
Learn to integrate multiple time frames in smart money concepts trading. It will help you make thousands of pips weekly.
❤️Please, support my work with like, thank you!❤️
I am part of Trade Nation's Influencer program and receive a monthly fee for using their TradingView charts in my analysis.

$EURUSD 15m Mark-UpEURUSD LTF Analysis - Aug 19
Analysis Notes:
The 15 minute timeframe is completely ranging, with a weak upper high, and the previous low had also caused a weak high to form.
Basically, as long as there’s no clear direction, trading on this timeframe in lower timeframes (1 minute) is not suitable.
If there’s any update regarding EUR, I’ll post it.
Follow us to never miss more analyses.

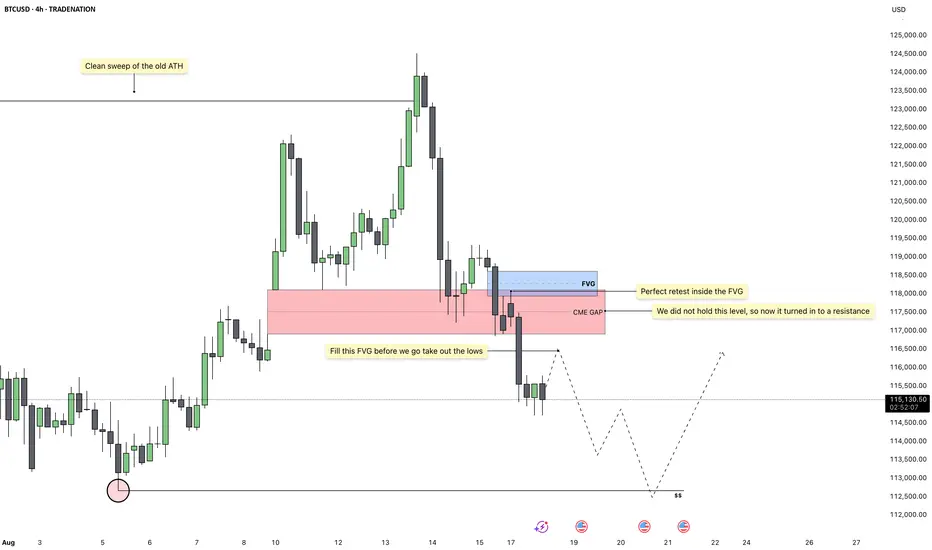
Bitcoin - Bears in Control, Lows AheadBitcoin has recently completed a clean sweep of the previous all time high, which has now given us strong bearish confirmation signals. After the sweep, the market rejected higher levels and failed to sustain bullish momentum, showing clear signs of distribution at the top. This shift in behavior suggests that buyers have lost control and sellers are now taking over.
Fair Value Gap Setup
Currently, price is sitting just below a fair value gap, which remains unfilled. These imbalances often attract price back before continuing in the prevailing direction, and in this case, that direction is down. A small retracement into the fair value gap above would be the ideal setup for a continuation lower.
Bearish Confirmation
The rejection after sweeping the highs and the subsequent breakdown beneath key support levels has created a bearish structure on the higher timeframe. The failed hold inside the fair value gap turned it into resistance, strengthening the case for lower prices. Each retest has been met with selling pressure, confirming that liquidity is now being delivered to the downside.
Liquidity Targets
Once the fair value gap above is filled, the next logical draw on liquidity sits below the current range. That means the lows are now exposed, and the cleanest target to expect price to reach is at 112k. The path of least resistance remains to the downside, as uncollected sell-side liquidity continues to build up beneath the market.
Trading Outlook
As long as Bitcoin continues to respect the newly formed resistance from the fair value gap, the bearish outlook remains intact. A retracement into the gap would likely offer the best entry for shorts, with the expectation that price will then seek out the lows. Only a convincing reclaim above the imbalance would threaten this bearish scenario.
Conclusion
The clean sweep of the old all time high has shifted market sentiment, and the subsequent bearish confirmations support the idea that the next major move is lower. I expect a slight retrace into the fair value gap before price makes its way down to the 112k liquidity pool.
Disclosure: I am part of Trade Nation's Influencer program and receive a monthly fee for using their TradingView charts in my analysis.
___________________________________
Thanks for your support!
If you found this idea helpful or learned something new, drop a like 👍 and leave a comment, I’d love to hear your thoughts! 🚀
Fueled to go north OANDA:XAUUSD Everyone who day trade based on my experience I could see that the market order flow is shifted to bullish order flow and the market hustled enough stop losses below from the traders who entered buy trades early. Use the supply zone conversion/transition to demand zones easily and take trades to North till the next liquidity pool.

XAUUSD - Next Big Move. Expecting ATHBIAS
LTCC(Last two Candle Close)
As we can clearly see that the market is struggling to close below the previous day lows and only the previous day low liquidity being taken, Expecting buyers to pitch in. Clear Sign of BULLISH BIAS
LTCD(Last two Candle Divergence)
Present day shows a Bullish divergence with XAGUSD creating a Lower Low in it and XAGUSD Failing to do so.(Sign of Smart Money)
IRL to ERL(Internal Range Liquidity)
Momentum in Daily TF is Speed Up + Slow Down which is a clear sign of Strong Buyer and Weak Seller in the Market. In the current trading range of daily time frame XAUUSD has now reached to its discount level approaching a daily imbalance with LTCC and LTCD indicating Buyers in the Market.
Confirmation
In the H1 time frame we have a Strong Close above the OF(Order Flow), which is confirmation for our entry.
Disclaimer: The Above Analysis is for Educational Purpose Only and is not indented as investment purposes.
___________________________________
Thanks for your support!
If you found this idea helpful or learned something new, drop a like 👍 and leave a comment, I’d love to hear your thoughts! 🚀

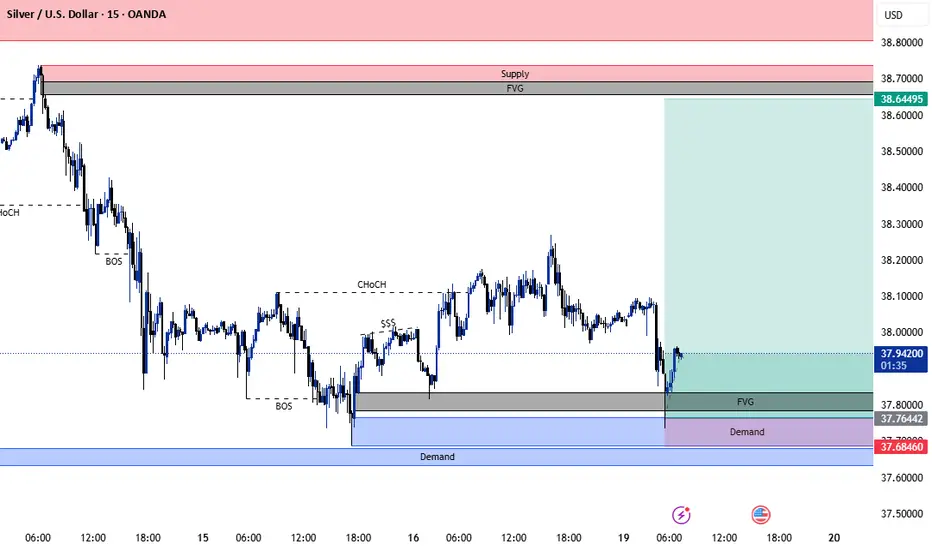
Silver Analysis – 15-Minute Timeframe (August 19, 2025)Unfortunately, TradingView doesn’t allow us to share analysis in the 1-minute timeframe. However, if you switch to the 1-minute chart yourself, you’ll be able to spot both zones clearly.
A clear structure shift has occurred, giving us two potential entry setups:
Flip Setup at the upper zone
CHoCH Setup at the lower zone
Both setups are confirmed by RSI divergence, adding strength to our entry signals.
⚠️ Risk management is essential—never trade without it. Wishing you profitable and successful trades!

Silver Analysis – 15-Minute Timeframe (August 19, 2025)As shown in the chart, price reacted to our marked zone. If we had opted for a more aggressive entry strategy, our buy order would have been triggered. This setup offered a potential opportunity for a risky long position.
🔍 In the next analysis, we’ll dive into the 1-minute timeframe to identify areas where confirmation-based entries could be considered. This will help refine our strategy and reduce exposure to unnecessary risk.
Wishing you profitable trades 💰
AUD_USD RISKY LONG|
✅AUD_USD has retested a key support level of 0.6485
And as the pair is already making a bullish rebound
A move up to retest the supply level above at 0.6503 is likely
LONG🚀
✅Like and subscribe to never miss a new idea!✅

AUD-NZD Rising Support! Buy!
Hello,Traders!
AUD-NZD is trading along
The rising support and the
Pair is already making a
Local rebound so we are
Locally bullish biased and
We will be expecting a
Further bullish move up
Buy!
Comment and subscribe to help us grow!
Check out other forecasts below too!
Disclosure: I am part of Trade Nation's Influencer program and receive a monthly fee for using their TradingView charts in my analysis.

GBP_CHF WILL GO DOWN|SHORT|
✅GBP_CHF made a retest of the
Strong horizontal resistance level of 1.0960
The established a double-top pattern
And as you can see the pair is already
Making a local pullback from
The level which sends a clear
Bearish signal to us therefore
We will be expecting a
Further bearish correction
SHORT🔥
✅Like and subscribe to never miss a new idea!✅

GBP-NZD Support Ahead! Buy!
Hello,Traders!
GBP-NZD is going down
To retest a strong horizontal
Support of 2.2779 while
Trading in an uptrend so
We are bullish biased and
We will be expecting a
Further bullish move up
Buy!
Comment and subscribe to help us grow!
Check out other forecasts below too!
Disclosure: I am part of Trade Nation's Influencer program and receive a monthly fee for using their TradingView charts in my analysis.

EUR_NZD LOCAL LONG|
✅EUR_NZD is trading in an
Uptrend and the pair is
Retesting a horizontal support
Level of 1.9728 from where
We will be expecting a
Local bullish rebound
And a further move up
LONG🚀
✅Like and subscribe to never miss a new idea!✅

EUR-GBP Will Grow! Buy!
Hello,Traders!
EUR-GBP made a retest
Of the horizontal support
Of 0.8604 from where
We are already seeing a
Bullish rebound and we
Will be expecting a
Further bullish move up
Buy!
Comment and subscribe to help us grow!
Check out other forecasts below too!
Disclosure: I am part of Trade Nation's Influencer program and receive a monthly fee for using their TradingView charts in my analysis.

EU Bullish > HTF EQHs ~1.18Hi everyone,
Following the current market trend, a good bullish target to have initially in this new week could be 1.18, where you have these clear equal highs in price (EQHs)
I'm sharing the daily chart, very simple markup, just 2 lines. :)
Good luck this week guys, keep it nice and easy, only trade if the markets show high quality confluences per your system.
Kind regards,
Aman | SMC Wolf FX
