Snap

SNAP BUY OR LONG TARGET $80Snap confirmed a breakout of the " SHS " pattern, the target of the
pattern is $80, of course you still need a safe stop around 8%.
Good luck.

SNAP could be headed to $85snapchat $SNAP has been range-bound and rejected multiple times at the $65 level for the past 6 months, and finally broke above it. Measured move is to around $85.
Do your own research, this is not financial advice.

SNAP Breaking OutClean breakout in progress for SNAP. After a lengthy consolidation, price tightened up before exploding higher today. Solid relative strength and relative volume add further confirmation to the move.


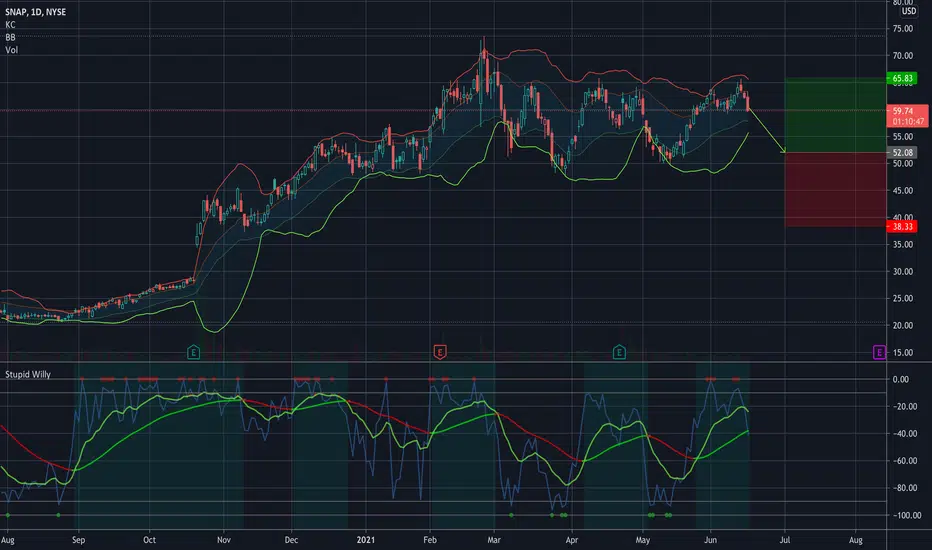
WATCHING $SNAP for ENTRY TARGET @ 52.08WATCHING $SNAP for ENTRY TARGET @ 52.08
I’m practicing to nail my entries better… if target hits I will take a position.
$SNAP Trend Rejected @ $65 Snapchat met heavy resistance yesterday at the 65$ level, will not take any positions.

SNAPReady for Swing?
- SNAP is at 64.10 resistance.
- It shows inverse head and shoulders
- Needs to consolidate before making a move
Suggestions: After consolidation or on confirmed breakout 2-3 weeks long 65$ call, If not a 50$ put


$SNAP Closed Trade - Rejected Resistance Level Closed position at $62 from $53 Entry. Price was rejected at the $64 resistance level, solid trade GLTA still holding.

Snap Put/ SellThis is not financial advice. My projection here is pure7based on technical analytics and nothing to do with fundamentals. I’m expecting least 22% retracement.

Snap possible price action Wait for the breakout then buy on pullback. Chart looks clean and easy. Make your own decision


Bull Trap in SNAPWhy do I believe this could be a Bull Trap?
If you look at the previous times SNAP reached this level (upper border of the wedge), always got rejected and could not close above the upper border of the wedge!
In the past 5 days price climbing up but the volume dropping!
Makes it a good case for short!
The only problem is Max Pain:
58-59 for this and next week!

$SNAP Bouncing off Channel Top, Bullish With Snapchat having a selloff the previous day, I thought it was a healthy pullback after having nearly a 13% move in a few days, the top of the channel has acted as support and more buyers have entered which will push this higher to $65-$70 level, path of least resistance. Working out amazingly!

$SNAP Update - Looking for Support Snapchat cleared through its channel range the other day, topping nearly $61, a pullback today seems healthy with an almost 7% move the previous day. What I am looking for next is some support on top of this ascending triangle, if price can hold above approximately $58.50 for the week, I think it will give traders yet another opportunity to enter for a move towards $70. Watch tomorrow as the closing candle green will give this further strength in the near term.

SNAP - LongReally nice set up on here on SNAP. You have a triangle pattern on the daily with a nice bounce off the lows. Upper trendline meets the golden pocket retracement. Low risk entry here with a potential move up to the $60-62 range, with a clear stop on a break of the lower trendline around $51.

SNAP $55 Puts 5/28 expSnap approaching a bit of a sell-off this off
Confirmation:
-Rejection off the 50 MA (red)
-Hit top off downward channel
Enter: $57.15

SNAP movementI expect a bear regression trend, following up with some ne bull opportunities.
Let´s be patient, there might be come the next run.
Key levels are 50$ then 44$
_________________________________________________________________________________________
See my profile to follow us on Twitter and Tradingview
Check out some tools for full and part-time trading on our Website, link to our Website on Twitter.
(Follow us on Twitter for an 30% discount coupon)

