Is Snap Ready to Pop? 👻 | SNAPCHAT ($SNAP)👻 SNAP just had a breakout, it has also generally been a good play during COVID, and it has some exciting news too with SNAP opening up their platform to outside developers for the first time. What we are looking for here is a long setup off a retest of this major price pivot point.
Resource: www.theinformation.com
✨ Drop a comment asking for an update, we do NEW setups every day! ✨
Like, Comment & Follow to help the community grow 🎉🎉
---
1. Fractal Trend is showing an uptrend (Aqua colored bars) on the 3-hour timeframe. This uptrend has been true for a while now and is especially notable now that we have a breakout of the previous range.
2. With this strategy, we are looking for long setups in an uptrend and as such want to enter long on retests of bullish order blocks plotted by Orderblock Mapping (Aqua colored lines) and/or bullish S/R levels plotted by Directional Bias (Aqua colored lines).
3. The goal here is to take a long position at the S1 bullish S/R flip. This level represents SNAP retesting the previous range highs (which are themselves a reaction to the range lows back in March) before moving up.
4. Our stop loss is placed just below S1, with the logic being that if previous resistance doesn't hold as support that immediate continuation to the upside becomes very unlikely.
5. Our target is the R2 bearish orderblock cluster and gap formed back in March during the top at that point.
6. If S1 doesn't hold, then S2 and S3 offer support levels for the bulls. S2 may be able to keep the uptrend in play, while the S3 expected S/R flip is simply an important level to watch if we get there.
Let's snap some cash bulls!
Snap

SNAP Buy Signal to Watch If NYSE:SNAP closes in an upcoming day above the 18.5 (RED) , it would likely continue up to the 20-21 area (GREEN) .
If it closes considerably above the 20-21 area , it would likely continue up to around the 27-30 area (BLUE).
The Triangle coloured in grey would serve as support area along the way .

SNAP analysis.If NYSE:SNAP succeeds to close considerably above the 20-21 area (green rectangle) , it would be very likely to continue up to around the 27-30 area .

SNAP SHORTI see a head and shoulders. Waiting on increasing volume confirmation.
Not an adviser just what I see.

SNAP - SNAPCHATToday we take a look at Snapchat.
- Price has tapped our 1D Highs as well as HTF Supply.
I am now looking for a corrective move on SNAP - Targets @ 0.7 Fib Retracement + 2.7 Fib Ext | $10-$12
Invalidation = Above here & we can expect this area to flip into Demand paving the path for new highs. For now, we will ride this wave with the bears.


$SNAP Double Top. Time to cave in. Sorry Bulls$Snap looks weak. This run up is over and now we're headed for $16.50 neckline support. We will break it and ultimately fall in the $14 area, filling the gap from the day after earnings. If you're a bull here, you're being greedy and need to take another look at your charts.

Cardano (ADA:BTC) AB=CD long trade.Bull Flag setup Trade.
Hidden bullish divergence of the pRSI (main oscillator) of my PRISM Oscillators Set have emerged; with momentum entering the positive -- pulled up by the positive and increasing AJ-Ribbon with Snap lingering in the positive.
AB=CD confluent with 161.8% Fib extension level.
Also, BUY signal triggered on CYBER ENSEMBLE on the 1hrly chart!
Caution: 21 EMA crosses below the 50 SMA on the 15 mins. However not a significant issue unless confirmation of this on the higher timeframes (i.e. 30 mins and 1 hrly). Setting stop-loss accordingly below the 61.8% Fib with volatility factored in.
Note: The thick purple lines are the VPVR support/resistance levels.
I know the chart is cluttered. I only have one screen and this is how I like to analyse my chart, where all the relevant details are in view together; so that I won't over-focusing on any particular one of them.

$SNAP UpdateSnap is forming a H&S pattern here. Daily has a bearish MACD crossover. RSI Trending down. Sorry Bulls, but this puppy is cooked. Down to $15.04 we go.

ENJ:BTC trade. AB=CD bullish trade.Been too busy to publish by trade setups lately.
Here's one of several trades I'm in right now.
Cyber Ensemble BUY signal triggered on the hourly chart.
PRISM Oscillators Set
Bearish Divergence realised.
Hidden Bullish Divergence emerging.
pRSI-Stochs oversold state
AJ-Ribbon as well as the S-Osc on a sharp upward swing.

Caution: SPX may dump at any time now.Sell signal on CYBER ENSEMBLE {Premium} triggered.
PRISM Oscillator's pRSI (main oscillator) entered bearish phase by crossing below its 30 VWMA.
Ichicloud reverted back into bearish state.
Economy significant impacted by the COVID-19 pandemic lockdown: jobless rates high, businesses going bankrupt, etc. no real sign of recovery yet. Market artificially propped up the FED's money printing (banana republic style).

SNAP: Getting ready to break the $18 ?SNAP showing signs of strength - already broke above the 1st range on a backdrop of demand (Volume Viewer) and bullish sentiment (green BoP)
getting ready to break the 2nd range and move above $18 ?
will come back and add a price projection shortly

[SNAP] - High probability to ride up to the price 18.48 USDSNAP stock High probability to ride up to the price 18.48 USD

Snap stock analysisThis one is tricky.
1) There is a big engulfing candlestick, which suggests that there will be an up movement, you could take this long position and make your profit just on the above resistance ($17.13).
2) wait to see what happens when it reaches that resistance ($17.13) :
if it fails to break out, there is will be ahead and shoulder pattern suggesting a change in momentum, you can short it then.
3) Bollinger band are suggesting a move upward

SNAP´s Bull TRAPHello! Friends,
I expect that the end of correction, so be very careful if you are bullish on this one.

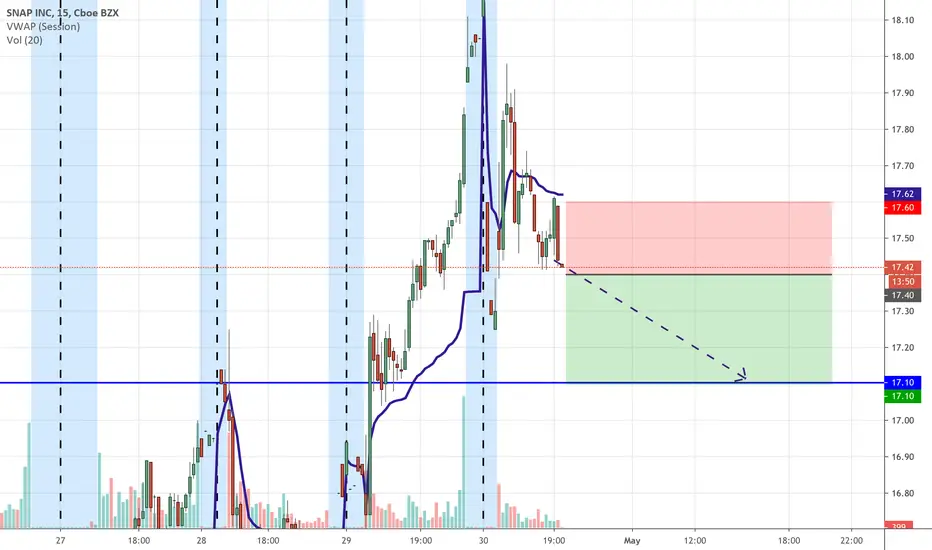
[SNAP] - High probability to drop to the price 17.10 USDSNAP stock High probability to drop to the price 17.10 USD
Snap inc - Snap Chat Stock AnalysisSince May 16 2020, the Market has been Bullish
Go short - Target Price set to 15.80 - Very aggressive option.
Less risky option is to wait for the signal to buy and to support the major trend.
Fundamental Analysis: First Quarter Revenue was positive

SNAP; Will We Be Screenshoting this Long Play?✨ We provide charts every day ✨
Like and Follow to help us grow family! 🎉
---
Let's go family! Breakaway Scalper moves have worked well recently. We are currently looking for a long signal entry from Breakaway Scalper (Green bar color) if the uptrend from Fractal Trend can continue to stay strong and confirmed (Green background).
---
STRATEGY USED:Momentum Mover
Trend Confirmation = Fractal Trend
Entry Signal = Breakaway Scalper
Exit Signal = Breakaway Scalper OR Orderblock Mapping
---
1. Fractal Trend is showing an uptrend (Green background color) for SNAP on the 1 hour chart.
2. Price has broken above the channel and is now consolidating on top of it.
3. We are currently looking for a long signal entry from Breakaway Scalper (Green bar color) if the uptrend from Fractal Trend can continue to stay strong and confirmed.
5. If we do get a breakout to the upside will be looking to see how price reacts at R1 - R3 resistance.
6. If we go lower we will look for reactions at S1 and S2 support.

ADA:BTC Bull FlagNow, waiting for CYBER ENSEMBLE {PREMIUM} to register a Buy signal, and PRISM Oscillators Set to revert back into a bullish phase again.
Expecting retrace back down to 61.8 % Fib level (i.e. 0.00000561 BTC) first.
Then bull flag target @ 1.618 % Fib level (i.e. 0.00000625 BTC); which is also precisely the measured move of the bull flag as drawn.

Daily Review: ZM, SNAP and SPYToday, U.S. markets ended flat despite starting off the session on a positive note. Although the close was bearish, could there be a bullish case hidden? Let's see what we can find assessing ZM, SNAP, and SPY.
Bull Market in the Cards?
We begin today with possibly the strongest performing stock of the day, Zoom. As you can see, Zoom is obliterating its previous high. The Momentum is clearly behind Zoom and on RSI, you could see that Zoom has respected its RSI 'bull market' support level. There is no denying Zoom can continue to push new highs as long as its product is in demand. With second and even third waves of COVID-19 possible. Is it impossible to think a vast majority of the Global workforce works from home? Still, I would be cautious buying these levels. Bias: Bullish .
I won't lie, I am not a fan of Snapchat and I'll will save my reasons for another day. However, the chart though...wow. Full disclosure, I missed this one. I should have posted yesterday warning not to buy just yet, but if you hadn't picked it up by now my bias is bullish.
The SNAP chart has two BIG things going with it. First, the obvious 151-week inverse head and shoulder. The measured target of which is $35. The second is that we have a clear Elliott wave 1 and 2 established as seen by the count. The wave 2 especially, retraced into the 0.618 fibonacci, a popular retracement level. In combination with expanding volume, SNAP could be in the beginning of the strongest wave, 3. First target is around $40. Overall, there is not very much to dislike about the SNAP chart. Bias: Bullish .
Uncertainty
Despite the market going on an unprecedented rally off the March lows there is a reason to be concerned going into the weekend. Today, the markets did not follow through on a promising start to the morning. I mentioned yesterday that I would be a buyer of the dip. Today, I am not so certain I would be anymore. Above is the weekly view of the SPY. This week it is turning out to be an inside bar, trading within the high and low of the previous week. What's that tell me? Uncertainty.
It's no surprise. With States deliberating the next steps on how to handle the re-opening of the their economies there is uncertainty and caution abound. Bulls should do the same. Not shown here, but on the daily charts of the major indexes, the first lower highs have been established. Bias: Bearish .
Just over 30% off the lows, it is not ill conceived that the markets pull back a bit here (or a lot). Tomorrow's weekly close will provide a lot of insight on how to trade next week. I will review Ethereum and Bitcoin going into the weekend, as I do suspect some trickery to take place while futures markets are closed over the weekend.

snap ready for short at least short termend of elliot wave in 15min candles. ready to retest the supprt which is fib 0.618 as well.

SNAP Could Go Either Way Make Money Both Sides April 23rd PlayI am mostly short on snap, but playing both sides.

SNAP idea for trading setupKeep an eye on the levels between 0.618 ($12.50) and 0.5 ($11.70), a break down with momentum of the $11.70 level might lead to the retest of lows or even look for lower lows.
A break out with a good volume of the 0.786 ($13.70), can lead to the $15 levels and even a retest of the trendline.
