$SNOW beautiful setup here into 2022Monstrous option flow came into the march calls above the ask, technical setup is fantastic
Snowflake

SNOWFLAKE ($SNOW) longNote:
- NYSE:SNOW
- High Tight Flag
- Hot sector
- Chart setting up nicely
- EMAs coming together
- Fundamentals are great
Disclaimer and Info:
- No guarantee for the correctness of information or calculations
- No advice or investment advice
- Fiscal Year ends January 31.
- All numbers in '000 US dollars (1.234 = 1.23 million USD)
Company profile from TradingView:
Snowflake, Inc. provides cloud data warehousing software.
It provides SQL data warehouse, zero management, and broad ecosystem products.
It offers data warehouse modernization, accelerating analytics, enabling developers and monitoring and security analysis solutions to federal government, financial services, healthcare, media and entertainment, retail and CPG , gaming, education and technology industries.
The company was founded by Marcin Zukowski, Thierry Cruanes and Benoit Dageville in 2013 and is headquartered in Bozeman, MT.
Main sources for data:
- Investor Presentation 3Q Fiscal 2022
- Trading View
- Own calculations
Customers (customers >$1M):
FY2021Q3: 3,554 (65)
FY2021Q4: 4,139 (77)
FY2022Q1: 4,532 (104)
FY2022Q2: 4,990 (116)
FY2022Q3: 5,416 (148) --> YOY Growth: 52% all customers // 128 % customers >$1M
Net Revenue Retention (NRR):
Net Revenue Retention (NRR) also known as Net Dollar Retention (NDR) is an important SaaS metric. NRR is one of the most important key KPIs from the software and service industry. Ultimately, it measures how much of the previous year's turnover was lost through layoffs and how much Annual Recurring Revenue ( ARR ) was gained through account expansion of existing SaaS-customers. The net effect of lost sales (revenue churn) and additional sales from received customers (account expansion) is the Net Revenue Retention.
In order to calculate the NRR, you need at least two comparison periods for the company. Typically, one compares the ARR of the previous year with the current value of the Annual Recurring Revenue. If the additional expenses of the existing customers can more than compensate for the loss of sales through terminations, one speaks of net-negative revenue churn or positive net revenue retention, which then takes a value of over 100%.
Calculation of the Net Revenue Retention (NRR) or Net Dollar Retention (NDR): Expressed mathematically, the NRR or NDR is the percentage of sales in a previous period or base period that could be realized in the current period. This includes additional sales from existing customers, cost reductions for customers and terminations. The net revenue retention rate can also assume values below 100%, which means that the customer cohort of the previous year spent less on average in the current year.
The goal of most SaaS-companies is therefore a net dollar retention of over 100, which would mean that the additional sales of existing customers could overcompensate for losses due to terminations (account churn) and budget cuts (revenue churn). If the NRR is above 100, i.e. the customer cohorts are spending more and more money and new customers can be won at the same time, software companies can grow particularly dynamically.
FY2022Q1: 168%
FY2022Q2: 170%
FY2022Q3: 173%
Non-GAAP Product Gross Margin:
FY19: 58%
FY20: 63%
FY21: 69%
FY22: 74% (est.)
FY2021Q3: 70%
FY2021Q4: 70%
FY2022Q1: 72%
FY2022Q2: 74%
FY2022Q3: 75%
Rule of "40":
The "Rule of 40" ( aka . "Rule of Forty") is one of the simplest and most important SaaS and software metrics. This KPI was developed by the US-based software venture capital fund Bessemer Venture Partners.
It tries to relate the growth and profitability of a company. The revenue growth and the free cash flow margin (also (non-GAAP) operating margin or adjusted EBITDA margin) are added as a measure of profitability. If the sum of the two values results in a value greater than 40 , empirical data are used to assume that this is a very healthy company. The rule of 40 is particularly meaningful for software or subscription companies with high gross margins.
The background to the relationship is that a company that is growing rapidly but is still losing money can be just as attractive or even more attractive than a company that is profitable but only grows more slowly. In addition, companies can often actively decide whether they want to give up profitability in order to grow even faster or save marketing costs and instead accept slow growth but deliver more EBIT .
At the same time, a situation in which a company is neither profitable nor grows significantly faster than 20% can quickly become threatening. Often these companies do not achieve sufficient economies of scale and operating leverage to be profitable and sustainable in the long term.
Therefore, the following applies quite casually: Either grow quickly or make a profit! If both of these don't work, the company often find itself in a dead end.
FY2021Q3: 88%
FY2021Q4: 93%
FY2022Q1: 95%
FY2022Q2: 96%
FY2022Q3: 112%
Sales Efficiency (aka Magic Number):
The "Magic Number" is a KPI of the sales efficiency of SaaS and subscription companies. It goes back to the venture capital fund Bessemer Venture Partners, which specializes in SaaS companies in the US.
To calculate the Magic Number, the newly acquired Annual Recurring Revenue (ARR) is annualized and related to sales and marketing expenses.
Calculation: Specifically, you subtract the sales of the previous quarter from today's sales and multiply the difference by 4. Because the additional quarterly sales will accrue every year from now on, so it becomes ARR or annually recurring sales. This annualized turnover is now calculated from the marketing expenses of the previous period - because these have caused the increase in sales - and the result is a number that is usually between 0.5 and 2.
FY2021Q3: 1,14
FY2021Q4: 0,92
FY2022Q1: 1,00
FY2022Q2: 1,04
FY2022Q3: 1,36
If the magic number is below 0.5, there is probably no product market fit. No invest in marketing is needed.
If the magic number is between 0.5 and 0.75, you are probably spending the right amount in marketing and sales and the amount should rather be optimized operationally.
If the magic number is above 0.75 or even above 1, you should definitely try to spend even more money on acquisition, i.e. via marketing and sales.

$SNOW fall looking bad, unless countered!$SNOW's reversal to downside is concerning, suggesting upcoming major downtrend!
Unless countered and held above 370!

SNOW: Time for a big move back to ATH?SNOW looks ready for a move. Daily close over 377.87 can send this to $392 and possible $405 with some volume. Don't think the great R:R is until a confirmation over 377.87. $375.29 you can use, but odds of it failing at 377.87 are high. If it gaps over, you could buy the gap fill in morning or buy gap support for a possible big move.

12/12/21 SNOWSnowflake, Inc. ( NYSE:SNOW )
Sector: Technology Services (Packaged Software)
Current Price: $371.24
Breakout price: $377.00
Buy Zone (Top/Bottom Range): $371.00-$358.50
Price Target: $400.00-404.00 (1st), $429.00-$433.00 (2nd)
Estimated Duration to Target: 49-53d (1st), 84-90d (2nd)
Contract of Interest: $SNOW 2/18/22 375c, SNOW 3/18/22 400c
Trade price as of publish date: $29.40/contract, $28.00/contract

SNOW cup and handle SNOW cup has been solidly forming
after completion of the cup at 420, look for a "handle" dip to the 320-350 area.
Then possible move up to the 5-600s
not financial advice

LET IT SNOW PUTSThere is a Bearish wolfe wave setup on the Daily time frame in SNOW that provided entry opportunity on Friday Nov 19. The projected target is calculated by extending a linear line between pivot 1 and 4 and projecting the line. This is represented as the red perforated line, as shown in the chart. The projected target is 300 and then 295. The price is expected to reach these targets within 7 days. The orange wolfe wave pattern uses a different length input value and identifies price tgt up to below 300. The risk and reward for both wolfe waves are excellent.

Snowflake, Inc. $SNOW reaches pattern target, partial exitSnowflake is a cloud computing-based data warehousing company based in Montana, named after the founders' love for winter sports. I like winter sports, and the ticker SNOW is aesthetically appealing in my portfolio.
The trade setup was straightforward. The company IPO'd in 2020 at $220, and after one quarter that saw investors take price up above $400 per share, all post-IPO gains were given back by mid-2021, and price got down to as low as $180.
Between March - July 2021, $SNOW formed an inverted Head and Shoulders bottom, reflected by the blue curved drawings - a left shoulder, a "head", and a right shoulder. Once price broke above the pattern boundary, I reached a measured target of $320 by applying the width of the pattern (from $180 to $250, or $70) to the breakout level of $250.
$70 + $250 = $320
This measurement criteria is based on the works of John Magee and Robert D. Edwards in Technical Analysis of Stock Trends (5th edition, 1948).
My stop-loss, the "Last Day Rule", and my limit order placement is based on teachings from my friend and active trading legend Peter L. Brandt (Diary of A Professional Commodity Trader, @PeterLBrandt).
I've now covered 3/4 of this position for a gain of 28% (70/250).
My maximum risk, assuming my stop loss order filled peacefully at its activation price was only 4% (10/250).
The risk to reward setup at the time of entry was then (4%) to 28%, or 1 to 7.
Snowflake is probably in line for further price gains, but I have no reason to believe I have an edge at these levels.

Weekly Watchlist! 8/9 - 8/13Check out what plays we are watching for this coming week! As well as a recap of last week's video!
NYSE:SNOW
On Snow we are looking for a break of the $279 level with targets of $280, $282 and $283
NASDAQ:BYND
Nice bullish engulfing pattern after earnings. Watching for a break of $126 with targets of $127, $128 and $129

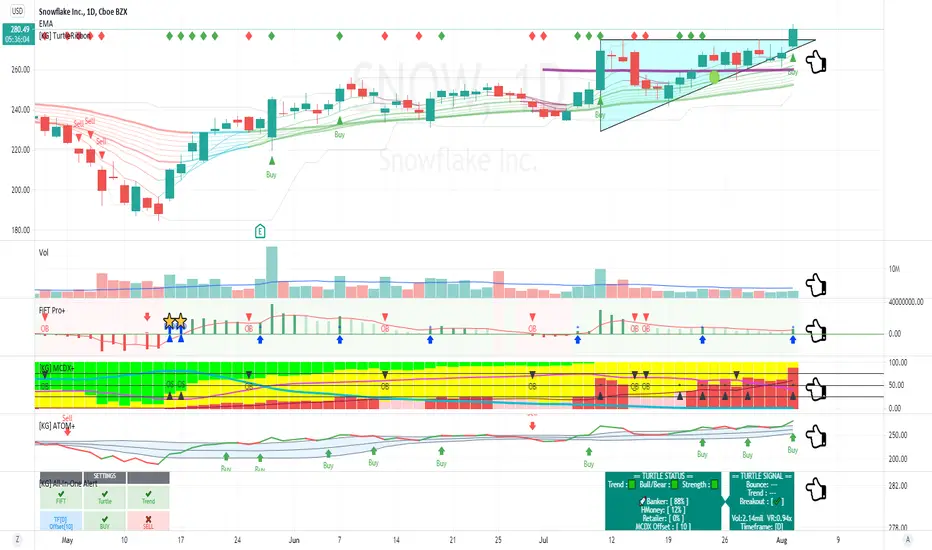
Snowflake Breakout TradeNYSE:SNOW
Ascending Triangle
Slow Turtle Buy
Uptrend
FiFT +ve Bull Recharge
MCDX Banker Spike up
Banker 87%
Atom buy
SNOW - July activityI measured SNOW's monthly activity seems like there's a buy and sell pattern that is very obvious. The yellow lines indicate the trading days (weeks) of the month.

SNOW BOUNCE OFF 251 SUPPORT I have been watching snow since it’s been recovering from the sell off it had about a month ago.
Anyway, I have been trading a lot of intraday bounces and my prediction of QCOM yesterday was similar to this.
Nothing fancy just a bounce play that was confirmed with the level 2 data.
I always look through the order book to get an idea of who is buying and selling, currently there is an order for about 1200 shares @251 which gives a lot more validity to my thesis that big money is buying this up.
The bold white line inside the purple rectangle is the area I identified as a demand zone - and where I plan on taking my position.
I plan on exiting when the order book tells me to get out but I expect a clean ten point run off the bounce.
I am new to trading so please bare with me if this isn’t up to par , I enjoy sharing ideas.

SNOW Inverse Head and ShouldersSnow is right at the neckline.
If it can break, then PT of 300
Else could see it fall back to 260 - 250

$SNOW shows an inversed Head & Shoulders bullish long-termWe can see how an inversed shoulder-head-shoulder is being created. If confirmed the price could go as up as aprox 290$. RSI does not show any interesting view, but we can see a down trend right there in the last few days; in this line, MA (9) is falling,but I consider is just momentum. Moreover, $SNOW is reaching to its floor, so it could activate buy alerts; in this line, MA (50) is below to its current price it could also work as a floor. If it does not break these floors, the stock has two target price (showed in the graph). Disclosure: I'm not long $SNOW. But starting to consider it.

Inverse head and shoulder pattern Snowflake 20th JuneBottomed out on 18th May 2021. Might be possible to hit 300 ? Strong volume at the shoulders support level.

SNOW - At 100 MASNOW - At 100 MA & holding at daily DZ, need to break trend line , target 273 upside at daily supply zone, stop loss if dropped below the current daily demand zone
Try 6/18 - 270c - 1.3

SNOW - Relative strength in Artificial Intelligence namesMid-term idea. Nice bounce back to the demand zone 210-220. Let's see how the price will act on these levels.

$SNOW trying to break out of descending trendline$SNOW, arguably the biggest beneficiary of the world transitioning to cloud, is on the verge of breaking out of its descending trendline.

Nice formation forming in an uptrendWe can see a nice resistance there, but the higher lows are in place, so soon we can see a nice breakout and way to the sma100. Would love to see it breaking

SNOWFLAKE ready to melt up?$SNOW showing signs of life after a downtrend
* BUY signal fired on Ultimate Stock Indicator
* Ripster EMA cloud turned green
* Looking for volume for entry.
To find out more about The Ultimate Stock Indicator on Tradingview, please check my public profile. 🚀🚀🚀🚀

SNOW just broke out!We just broke out from the falling wedge.
Bullish divergence points to this being a bullish trend reversal.

$SNOW Inverse Head and Shoulders Reversal 4/14 Video breakdown to $SNOW We are watching this AM. Has a potential reversal coming soon.

$SNOW Imminent EMA crossSNOW has been beaten down below IPO price and has completed a descending trend, looking to break out. A daily 8EMA to 21EMA crossover should indicate A bullish move towards some upside. Even if this move is just a corrective wave with more downside, the trend will push this to the .618 and decide what to do from there. Looking to add longs if it moves over 242.67 and holds that level. The move above should come quick too, using the VWAP from the highs as a magnet.
