S&P500 OOPS...It appears that the S&P500 (futures, ES1!) decisively broke down a long time support that dates back to May 2020.
It is also below the 55EMA, and MACD with other technicals are downward biased, indicating a lower target than the recent lows.
Possible target of 4280 from now to end Feb.
Snp500

Stocks Break Down from Inverse Head and Shoulders!!📉😱Stocks have broken down hard from our inverse head and shoulders pattern. This should be considered a very bearish sign. We have broken into the vacuum zone between 4632 and 4580, finding support at roughly the midpoint around 4600, a psychological level, which may also become our next addition to technical levels on this chart. The Kovach OBV is quite bearish, but if we see a relief rally, we can expect the S&P 500 to test 4632. We have several levels above this in the 4600 handle, with 4668, the neckline of our inverse H&S a likely ceiling for now. The neckline of a failed H&S pattern always proves to be a significant barrier. From below, 4580 and 4564 should provide support.

Inverse Head and Shoulders in Stocks??Stocks have dipped, testing lower levels in the 4600 handle. We found good support at 4632, but are witnessing some volatility here. We may be seeing the formation of an inverse head and shoulders with a neckline at 4668, one of our technical levels which appears to be providing resistance. Several red triangles on the KRI have confirmed resistance as we have tested this level three times. The Kovach OBV is still very bearish, but if momentum comes through and we are able to break out, then 4693 and 4729 are the next targets. The latter level has provided prohibitive resistance the last time stocks attempted higher levels last week. We still have several factors weighing on the market including Covid recovery worries, staffing shortages, inflation and interest rates. If our inverse H&S breaks down, its a bearish sign indeed, but watch for support at 4580.

S&P500 Will Go Up! Buy!
Hello,Traders!
SPY is trading in a long term rising channel
And I think that the rally is over yet
Because the FED's asset purchases will stop only in March
So I think we might see one more leg up
On SPY before the first rates hike happen in mid 2022
Buy!
Like, comment and subscribe to boost your trading!
See other ideas below too!

Stocks Selloff, Cling to Lower Levels in the 4600's4729, but this level seemed prohibitive for stocks, and we sold off from there slicing through 4693 with ease, but finding support at 4649. We made a brief attempt at a pivot, but 4668 is proving to be an obstacle as a red triangle on the KRI has confirmed resistance here. The Kovach OBV has dropped off notably into bearish territory, but is starting to level off. We will need to see more momentum here before we can test the 4700's again. If so, the next target is 4729 again. If the bear rout continues, then we should have support from 4632, but after that, we have a vacuum zone down to 4580, which has provided support during the sharp selloff on the 10th, and is likely to continue to hold.

SNP500 / WM2NS On its way to recover the 2000 ATHUnder the current market conditions aka high Inflation I think it makes sense, to look at all assets vs M2 money supply instead of the USD. USD losing value against assets so quickly, that classic technical analysis is limited.
As you can see, if valued against M2 the SNP is still about to recover from the dot-com-bubble. I think it will take about the next 5-6 years to revoer that, which would be a 50% increase in value. If the dollar continues to lose value so quickly, this would result in about 100% gain if valued against USD.
from 2009 low to 2020 high
SNP/USD +420%
SNP/M2 +170%

Breakout Soon for Stocks??Stocks have gained some steam as the markets are graadually digesting the Fed and inflation. We have hit our price target of 4729, and broken above this level briefly to test the next level of resistance at 4763. We saw some red triangles on the KRI just below this level confirming that is an upper bound for now. We appear to be consolidating around 4729, which suggests that stocks are gearing up for their next move. Watch the momentum toward open. If we are able to sustain another rally, then 4763 is the level to watch as the S&P attempts to claw back highs. We should have plenty of support from below in the event of a retracement, with 4693, 4668, and 4649 the first levels to provide support in the 4600 handle.

Stocks Edge Up After Pricing in the FedStocks have edged up after the markets are gradually digesting a more hawkish Fed. We have seen good support from 4580, and a strong pivot from that level, and have blasted up to regain the 4700 handle. Currently, we are testing 4729, the first level in the 4700 handle from below. A red triangle on the KRI is confirming some resistance there. We will need to wait until the open to determine if we have enough steam in the tank to press higher. If so, the next level is 4763, which is the lower bound of the range the S&P 500 near highs. This was the range from which we broke down after ranging for several days. The final target remains 4821, the upper bound of the range, which must be broken before we can consider making new highs again. There are several levels below to provide support including 4693, 4668, 4649, and 4632. These should provide support but if they do not hold, then 4580 should serve as a floor for now.

SNP 500 / WM2 just broke the High of 2007I think under the current market (and inflation) conditions, we have to take a lot at assets vs money supply, to see where we're at.
In my opinion the SNP just broke the B high and is now on the way for wave 3, don't see any bear market here! Thought we would see some more Resistance from the B high, esp with the news around the FED, but if you look at the 10yr yield trendline (i just posted) i dont think they really will increase yields.

✅S&P500 WILL KEEP GROWING|LONG🚀
✅S&P500 is trading in an uptrend
Bound by the rising support and resistance lines
And after the price recently retested the support
I think that SPY will keep growing with the target being
The rising resistance line
LONG🚀
✅Like and subscribe to never miss a new idea!✅

Stocks Selloff, Quickly Regain Value AreaStocks faced a steep selloff yesterday, sailing through the vacuum zone below the 4600's, to find support exactly at our level at 4580. From there, we caught a nice pivot back to value in the 4600's. This is a strong sign for bulls who were hoping to see a bottom in stocks soon. The fact that it was bought up so quickly, suggests we are trying to establish value in the 4600's. Once all the Fed hike and inflation data has been absorbed into the markets, then we are in a position to seek highs again. Currently, we are testing 4693, the last level in the 4600's, but a red triangle on the KRI is suggesting we are meeting resistance. The Kovach OBV is still pretty flat and hugging lows, but if we get another wave of buying, we could easily solidify the 4700's again, with 4729 and 4763 the next targets.

Stocks Hug Lows Ahead of Key DataStocks are establishing value near lows. We saw a brief attempt at higher levels, notably 4729, but several red triangles on the KRI confirmed resistance there. Subsequently, we have pushed lower with 4668 as the next level to provide support. We are holding a narrow range at the the moment between this level and 4693. We appear to be forming a bear flag or other consolidation pattern. The Kovach OBV is still quite bearish, so we could see another push lower, to test 4649, 4632, or 4580. If we catch a bid, then 4729 is the level to watch. We have inflation data and more comments from Fed's Powell today, so this could be a driver either way.

S&P500 BearishWeekly (MACD) indicator turned bearish... particularly with a Bearish Engulfing candlestiak pattern right at the top.
Daily Indicators are already bearish, while the price failed a breakout (of a range) and fell back in, suggesting a brreakdown on the opposing side. This week would test the daily 55EMA for sure; and perhaps a small bounce to the top of the range...

ES1! SPX500USD 2022 Jan 10 Week
ES1! SPX500USD 2022 Jan 10 Week
Rejection at 4743 short worked well last week.
Short on retracement preferred
Weekly: Average volume down bar closing near low = weakness
Daily: Average volume down bar closing off low. Some demand is
present.
H4: Very high volume down bar followed by lower close bar = weakness
Entries will be based on price reaction to the levels
Short = Test and Reject | Long = Test and Accept
4874 4800
4743 4716
4662 4520
4492 4411
Remember to like and follow if you find this useful.
Have a profitable trading week.

Why we Shouldn't Get Hopeful on Stocks... Just YetStocks are ranging at lows, after crashing down to the 4700's from highs in the 4800's. Sharp choppy trading established the current range between 4668 and 4729. Long wicks have tested the lows of this range, and the upper wicks seemed to make and attempt to break out, but a cluster of red triangles on the KRI has confirmed steep resistance at 4729. The Kovach OBV is still abysmally bearish, and does not seem to be showing signs of equilibrating (bottoming out). This could indicate oversold conditions and the fact that we may be in for an attempt at a relief rally. If so, we must break 4729, then the next level is 4763. The next level down is 4649 if we sell off further.

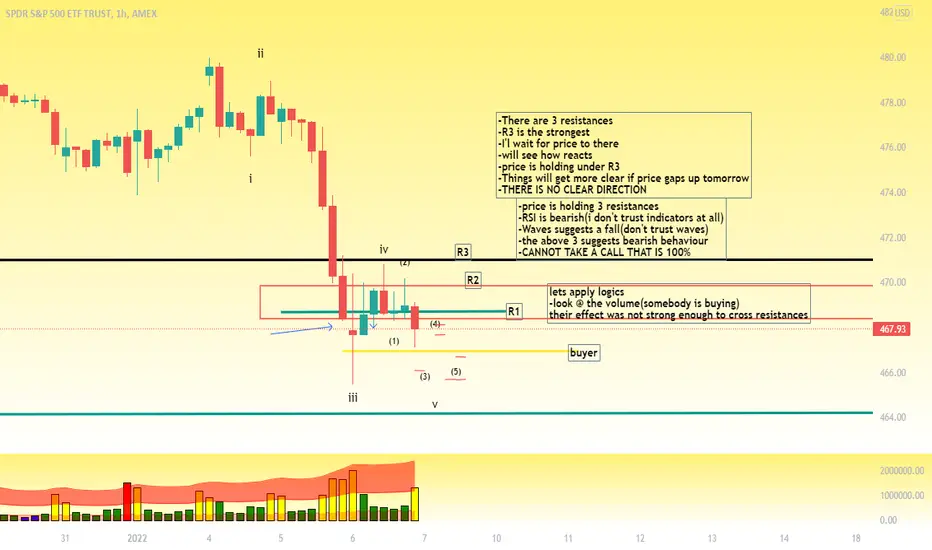
SPY -not a clear directionI don't see a clear direction with SPY.
I am \bearish for now as mentioned in the notes.
Read notes inside chart and if you do like my analysis plz like &follow .