SOL Holding Major Support Inside Falling WedgeSOL is trading inside a well defined falling wedge structure on the higher timeframe. Price has been compressing within the wedge after a strong prior move and is now reacting near the lower boundary while sitting on a major ascending support trendline.
This ascending support has acted as a strong base multiple times in the past and is currently helping to slow down the downside momentum. As long as SOL holds above this rising support, the falling wedge structure remains valid and constructive.
A short term dip toward the lower wedge support is possible, but if buyers defend this region, price can gradually rotate higher toward the upper wedge boundary. A confirmed breakout above the wedge would open the door for a stronger recovery move toward higher resistance zones.
If price fails to hold the ascending support, the bullish structure weakens and deeper downside levels may come into play. This area is a key decision zone where the next major move is likely to form.
SOL

SOLUSDT - Bears increased pressure after retesting resistance BINANCE:SOLUSDT bounces off trend resistance and updates its local minimum to 122.4. A bearish phase is developing in the market, and a small correction is possible before the fall.
The daily timeframe indicates a crypto winter, a downtrend, and weak buying power due to capital outflows and a weak fundamental background.
Bitcoin is testing 90K and has once again been rejected by the resistance zone. Liquidation and a fall to the intermediate support zone have formed. Altcoins reacted aggressively to this impulse.
Resistance levels: 126.6, 130.5
Support levels: 123.0
SOLANA has two key levels: 123.0, closing below which could trigger a sell-off and a drop to 116.7. And resistance at 126.6, which acts as a zone of interest. It is possible that altcoins may test resistance in search of liquidity.
Best regards, R. Linda!

(SOL) solana "!"Something huge is coming and in the following month. The huge event is coming for Solana. This is going to be big.

SOLANA 2022 fractal shows crash to $30 is coming.Solana (SOLUSD) has been consolidating mostly within the last 2 months, with the 1W MA50 (blue trend-line) as its Resistance and the 1W MA200 (orange trend-line) as its Support. We have posted this chart more than two months ago, giving a timely sell signal to exit this market.
Based on the early 2022 price action, Stage 1 of that Bear Cycle was completed after a short-term rebound towards the 1D MA200 (red trend-line), which was rejected and initiated Stage 2. We expect that to be confirmed once the 1W MA200 breaks. Notice also the similarities between their 1W CCI fractals.
The minimum Target we have for the 2026 Bear Cycle is $30.00, which is both on the 0.618 Fibonacci retracement level from the previous Cycle bottom as well as the 2.78 Fib extension (blue) from the recent High and Low.
---
** Please LIKE 👍, FOLLOW ✅, SHARE 🙌 and COMMENT ✍ if you enjoy this idea! Also share your ideas and charts in the comments section below! This is best way to keep it relevant, support us, keep the content here free and allow the idea to reach as many people as possible. **
---
💸💸💸💸💸💸
👇 👇 👇 👇 👇 👇

Coinranger|SOLUSDT. Attempt to reverse to 133🔥News
🔹Fed rates at 22:00 UTC+3, FOMC press conference at 22:30 UTC+3. We can fly on this news.
🔹US earnings season is in full swing.
🔥SOL
🔹Fell down to the lowest level from the last forecast.
1️⃣ Took 127 above – one of the likely upside waves. Next up are 129 and 133. Potential for now.
2️⃣ Below: 125 as the most likely support level for the current uptrend.
I expect a flat between 129 - 125 until the rate issue, and then a possible breakout to 133.
---------------
Share your thoughts in the comments!

SOL - The Building Block!I call this area the Building Block, and it’s doing exactly what it’s supposed to do.
Right now, CRYPTOCAP:SOL is trading below the $129 structure, and as long as price stays under this level, the bias remains bearish. No guessing, no forcing it. Structure is structure.
That said, this level is important.
👉 A clean break and hold above $129 would change the picture completely and mark the start of a bullish phase, opening the door for higher prices.
Until that happens, patience is key. Let CRYPTOCAP:SOL prove itself before switching bias.
⚠️ Disclaimer: This is not financial advice. Always do your own research and manage risk properly.
📚 Stick to your trading plan regarding entries, risk, and management.
Good luck! 🍀
All Strategies Are Good; If Managed Properly!
~Richard Nasr

Coinranger|SOLUSDT. Continuing decline to 114🔥News
🔹No important news today. Only an old data on american market will be released, which is usually considered preliminary.
🔥SOL
🔹Fell to the lowest level from the last forecast.
1️⃣ Above: 125 potential pullback level.
2️⃣ Below: 118.5, 114, 110 - different levels of a downward wave sequence. 114 is the most likely for now.
Likely a continuation of the decline without news. Кeep watching BTC and ETH.
---------------
Share your thoughts in the comments!

SOLUSDT 1,360% profits potential with 8X leverage —LONG tradeMany projects crashed in October or November 2025, new major lows, new all-time lows; pretty bad. Solana remains really strong, just like Bitcoin, Ethereum and some others.
The last low happened mid-December last year and this low ended as a higher low compared to early April 2025. This is a strong bullish signal.
SOLUSDT now has a flat bottom with decreasing bearish volume. This type of chart setup supports a trend reversal. This chart setup supports change. This chart setup supports a bullish wave. We are going up next. And, for this reason, I am sharing with you this set of trade-numbers... I hope you find them useful.
_____
LONG SOLUSDT
Leverage: 8X
Potential: 1360%
Allocation: 5%
Entry zone: $116 - $126
Targets:
1) $137
2) $149
3) $169
4) $185
5) $201
6) $224
7) $253
8) $286
9) $306
10) $338
Stop: $112
_____
Thank you for reading. Your continued support is highly appreciated.
Namaste.

Solana (solusdt): a correction and a possible bounceHi guys!
As you can see Solana breakout from the resistance line but it was a false breakout and then started a drop there!
I see the drop will continue at least until the gray area and then price could rise from there!
short position target: $123

Stress-Testing Bollinger Bands Across Major Crypto AssetsBollinger Bands are one of the most widely used volatility-based strategies in crypto. Rather than evaluating a single configuration, I ran a large-scale parameter sweep to observe how the same breakout logic behaves across different assumptions.
For this test, I backtested 2,700+ Bollinger Bands Breakout configurations across BTC, ETH, SOL, and AVAX, varying timeframe, band length, standard deviation, and trade direction (long + short) within realistic, non-extreme ranges.
The results showed a wide dispersion of outcomes. Many configurations appeared profitable in isolation, but most exhibited unfavorable drawdown characteristics or were highly sensitive to small parameter changes. Timeframe selection had a larger impact on risk profile than individual band settings, and configurations that performed well on one asset often failed to generalize across others.
A smaller subset of parameter clusters demonstrated comparatively better balance between return and drawdown, but even these were not broadly stable across the full test space.
The takeaway is not about identifying a “best” Bollinger Bands setup. It’s about robustness. Single backtests can be misleading. Examining distributions across symbols, timeframes, and parameters provides a clearer view of where performance is coming from — and where risk is hiding.

1W SOL update: Volatility is back, but structure mattersWe’re seeing another dump reaction across the majors, and Solana isn’t immune. That said, this still looks like reactionary selling within a broader structure, not random collapse.
On SOL specifically:
• Price broke down from a steep corrective channel
• Momentum flushed quickly, which is typical late in corrections
• The $100 area lines up with the top of the prior trend / major HTF support
• A sweep into that zone would still be structurally healthy
A move toward ~$100 would likely be a retest, not a failure. That’s where you’d expect:
• Sellers to exhaust
• Late shorts to press
• Potential for relief or rotation back into the range
If $100–105 holds with acceptance, a relief bounce back toward $125–140 is very reasonable. If it doesn’t, then we reassess. Simple.
Same theme as BTC and ETH:
Volatility is shaking confidence, not invalidating the higher-timeframe picture yet. Let price come into real levels before jumping to conclusions.

Coinranger|SOLUSDT. Potential reversal to 135🔥News
🔹The International Economic Forum continues. US GDP is at 16:30 (UTC+3). US PCE data for November and October will be released at 18:00 (UTC+3) – this is still important due to possible recalculations for later months.
🔥SOL
🔹Time to update the Solana chart:
1️⃣A potential set of upward wave markers has appeared above: 133, 135, 138.
2️⃣Below, 124 and 122 remain significant levels. They could still play out during a potential flat phase.
For now, the priority is a continued upward pullback. There is also a possibility of a flat at 131 - 124, but not yet.
-------------------
Share your opinion in the comments

Coinranger|SOLUSDT. Pullback to 140 and further goes down🔥News
🔹The International Economic Forum in Davos begins today and will continue all week. America is closed for M. Luther King Day. No other significant news.
🔥SOL
🔹The full set of downward waves has been completed. Now we can recalculate the levels. They are as follows:
1️⃣ The price has reached all extensions, so the pullback could be quite large. The main levels are 136 and 140. That is for the aims above the current price.
2️⃣ Below there is 126 as the first wave in the next set of downward waves. 121 is an intermediate level between the potential end of the new set and its first extension.
For now, the pullback is the priority. A decline is likely to follow.
-------------------
Share your thoughts in the comments.

Solana| Bounce From Key Support – Long Spot SetupSolana (SOL) has retraced into a key support zone between $127–$133, an area that has previously acted as a solid base for bullish reversals. Price action is consolidating with declining sell volume, hinting at a potential bounce.
🔹 Entry Zone: $127 – $133
🔹 Take Profit Targets:
• TP1: $148 – $154
• TP2: $170 – $180
🔹 Stop Loss: Just below $125

SOL, uptrend intactCRYPTOCAP:SOL
🎯Price caught a bid moving bullishly above the daily pivot, now being tested as support. Wave 2 of a new motif wave appears to be underway with an inital target of the daily 200EMA.
📈 Daily RSI is back to the EQ, restting quickly. A good sign for bullish continuation.
👉 Analysis is invalidated below wave C, $110
Safe trading

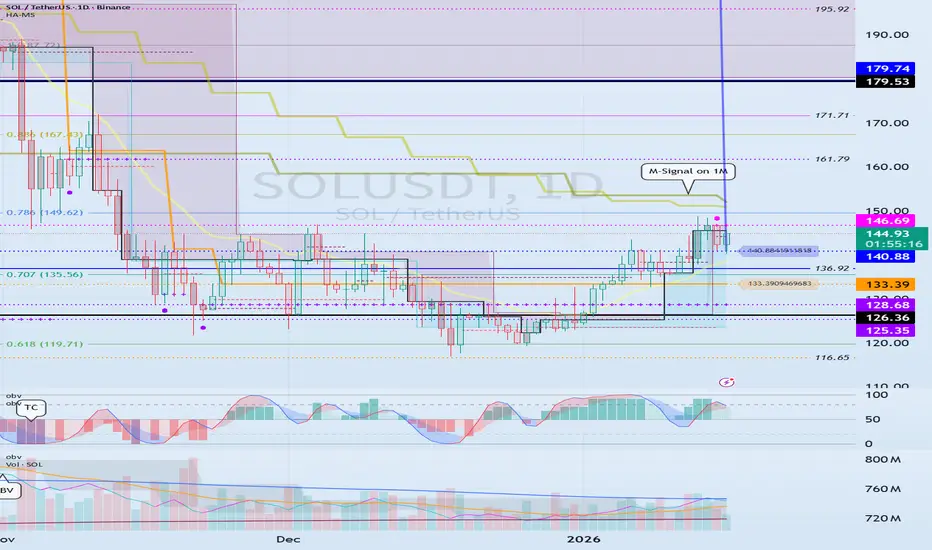
Support and Resistance Area: 140.88-146.69
Hello, traders!
Follow us to get the latest information quickly.
Have a great day!
-------------------------------------
(SOLUSDT 1D Chart)
SOLUSDT is entering a new phase with the emergence of the DOM(60) and HA-High indicators.
Accordingly, the key question is whether the price can rise while gaining support near the 140.88-146.69 level.
If not, it could fall below the 128.66-133.39 level and set a new low.
A decline below the M-Signal indicator on the 1M chart is highly likely to trigger a downtrend, so caution is advised when trading.
Therefore, we should set a buy point when the price rises above the M-Signal indicator on the 1M chart and maintains its level.
Since BTCUSDT's volatility period is around January 20th, we should monitor whether the price can rise above the M-Signal indicator on the 1M chart after this period.
-
To continue the uptrend by breaking above a key point or level, the StochRSI, TC, and OBV indicators must show upward trends.
If possible,
1. The StochRSI indicator should not have entered an overbought zone. 2. The TC indicator should remain above the 0 level.
3. The OBV indicator should remain above the High Line.
Looking at the current auxiliary indicators, we can see that the conditions for a sustained uptrend are not met.
Therefore, we should examine whether the conditions for a sustained uptrend can be met around the 140.88-146.69 range.
-
Thank you for reading to the end.
We wish you successful trading.
--------------------------------------------------
Coinranger|SOLUSDT. Pullback to 137 before continued growth🔥News
🔹Today at 16:30 (UTC+3) will issue the US PPI data for December, and most likely for October at the same time. Plus retail sales at the same time.
🔥SOL
🔹We've reached the second extension on h1 - 147:
1️⃣Above: 153 and 155 – the first part of a new set of upward waves.
2️⃣Below: 142, 137, and 133 (preliminary calculated levels of the set of downward waves)
We're keeping an eye on the news, BTC , and ETH . Ideally, we should see a slight pullback before continuing the rise. Minimum to 142. Ideally, to 137.

SOLANA - The battle for resistance 145. The bulls have a chanceBINANCE:SOLUSDT.P breaks resistance and tries to stay above key levels. The fundamental background for cryptocurrencies is gradually improving. What can be expected in the short and medium term?
The crypto market has received support amid progress in US regulatory initiatives: the Digital Asset Market Clarity Act has been submitted for consideration, which increases regulatory predictability and attracts institutional capital. Progress in regulation is laying the foundation for sustainable growth in the crypto market by attracting institutional capital.
Bitcoin is strengthening against the backdrop of positive news related to market regulation and is moving into a local bullish trend. Against this backdrop, SOL is breaking through consolidation resistance and attempting to stay above 143.5 - 144.7...
Resistance levels: 156.5, 160.0
Support levels: 144.7, 143.5, 142. 0
If the bulls manage to keep SOL above the key support zone of 143.5 - 144.7 after breaking through resistance and a reversal pattern forms, a rally to 155 - 160 can be considered.
Best regards, R. Linda!

Solana Still Has Room to Run | Targets AheadHello traders! 🚀
Hope your week is off to a great start!
Today I’d love to share my thoughts on Solana (SOL) 💎
Even though SOL has already made a solid move to the upside, the chart is still sending bullish signals 📈 The structure suggests that the momentum may continue, and the party might not be over yet 😉
From current levels, I’m looking for a move toward 148.
❌ Invalidation level:
Any touch of the 141.6 area will invalidate this bullish scenario.
Let’s break down the targets step by step 👇
🎯 Target 1: 145
🎯 Target 2: 148
🎯 Bold target: (151.4) — a bit optimistic, so I’ll keep it in brackets 😄
If this idea resonates with you, hit the like 👍,
follow for more trading ideas, and
share your thoughts in the comments — where do you see SOL going next? 💬
Trade smart, manage your risk 🧠
Let’s watch the chart together! 🚀📊

SOL 1D Update: Looking to establish new uptrendSOL update.
SOL is now establishing a new short-term uptrend after spending months inside a descending channel. The key shift is structural: price has broken out of the downtrend and is no longer making lower lows. Instead, it’s holding above former support around the $125 level and building higher lows, which is exactly what you want to see in an early trend transition.
The move higher toward the $140–145 area has been more controlled and constructive than prior bounces. Instead of sharp relief moves that fade immediately, SOL is grinding higher and holding gains, suggesting real demand rather than just short covering.
This strength is also starting to show up across the Solana ecosystem. Several SOL meme coins are attempting to break out of their own basing structures, which typically happens when SOL itself stops trending down and begins to lead. That kind of breadth is important and often precedes stronger continuation if it sustains.
Key levels to watch:
As long as SOL holds above $125, the uptrend structure remains intact.
Acceptance above $145 opens the door for a move toward the $160–180 region, where heavier resistance sits.
A failure back below $125 would invalidate the breakout and shift this back into range behavior.
Overall, SOL’s character has changed from sell-the-rip to buy-the-dip. It’s still early and likely to be choppy, but the market is finally starting to lean in the right direction. If this structure holds, both SOL and its meme ecosystem have room to expand further.

SOLANA ANALYSISSOL has successfully breached a critical trendline and reclaimed the 50-day Simple Moving Average (SMA), validating a structural shift in momentum. This confluence of technical breakouts suggests a probability continuation toward the $183 supply zone, provided support levels hold firm.
Disclaimer: This analysis is for educational purposes only and does not constitute financial advice. Trading cryptocurrency involves significant risk; please conduct your own due diligence before making investment decisions.

SOLUSDT – Daily Follow-Up UpdatePrice is reacting well after bouncing from daily support.
We’re now pushing into a key resistance zone that previously acted as support.
Bullish scenario:
A clean daily close above resistance + successful flip into support opens the door for a move toward the daily FVG around 170–176.
That level is the main upside target.
Bearish scenario:
Failure to hold this resistance could lead to a rejection and a move back toward daily support / lower FVG.
Bias stays neutral → bullish, but confirmation is required.
No breakout = no trade.
👉 Do you expect SOL to flip this level and continue higher, or will we see another rejection?
MrC

Solana ~ TRADE The CHOP: 3 Ways to Make ATLEAST +15%Choppy markets are identified by low volume and sideways trading / range trading. It seems uninteresting in most cases, but you don't have to sit around and wait for the next big impulse wave!
Here are three plays YOU can take during choppy markets:
1) 4H : Short Resistance
Chop trading can be a blessing - the price often touches the same support zone and the same resistance zone 2 - 3 times, before breaking out either way. This means that if you spot your zone early, you could take a short timeframe swing trade. Another way to find a trade is to look for gaps in the candles, for example:
2) 4H : Long Support
South Africa is in a time of turbulence, and the Rand is unpredictable as the effects of G20 settle in. During these times, and this counts for all markets, placing a low risk leveraged long on support is a way to trade the chop:
3) Daily : SPOT Hold to TP Zone
Nothing like a classic low risk trade - but you may need some patience with it! If you're not willing to look at charts all day, or have alarms wake you up at 2:30am to take a trade then this is your style., for example:
What do you do during choppy markets?
