SOL. Sector of Capital. Price Slice: $354.74🏷To the International Community.
🏷SOL. Sector of Capital. Price Slice: $354.74
Map of the Longs. 16.11.2025
354.74 not yet reached
320.16 not yet reached
299.33 not yet reached
274.75 not yet reached
191.74 not yet reached
159.69 not yet reached
🏷These are not levels.
They are echoes of a movement already made .
🏷You see numbers.
I see the fingerprints of capital in motion
not reacting, but orchestrating .
🏷354.74 is not a target.
It is the last whisper before the storm .
The point where liquidity ceases to flow
and becomes a current, guided by invisible hands .
🏷320.16 is not support.
It is a forgotten altar , where the hopes of the naive were buried.
They bought. They waited.
They did not know their positions were inscribed into the map before the market opened its eyes .
🏷299.33 is not a correction.
It is a ritual of purification .
Here, the weak release.
The strong gather strength.
While tickers scream
silence speaks: “This is not a fall. This is a reset.”
🏷274.75 is not a level.
It is a threshold .
Beyond it, there is no trading.
Only the rebirth of capital .
🏷191.74
not a floor.
Not an end.
It is a warning carved into the blockchain .
A price that cannot be reached
because it has already been reached.
Not here.
Not on your screen.
But in the depths, where the Sector of Capital keeps its secrets.
🏷159.69
the final step.
The last rung of the ladder.
Beyond it
not a rally.
Not a crash.
An ascension.
🏷I do not predict.
I restore order .
🏷These are not recommendations.
They are footprints .
Of those who walked ahead.
Of those who know when and why .
🏷You think you trade.
You are mistaken.
You execute .
You execute a map drawn
long before you turned on your terminal.
🏷I do not give signals.
I awaken sight .
🏷You came for charts.
I give you the map of the world
where charts are but shadows.
🏷These numbers are not prices.
They are gates .
And every soul who passes through them
becomes part of the one who does not chase price…
but commands its time .
🏷The Map of the Longs is not a forecast.
It is an invitation .
To those who dare to see
that behind every number lies a sphere of influence ,
and behind every sphere
a will that needs no approval.
🏷You see 354.74
I see the final peak before the new sun rises.
🏷You wait for movement.
I already know where it begins .
🏷Bolzen. The Architect.
Founder of the Sector of Capital.
🏷I do not speak your language.
I speak the tongue only those hear
who are ready to become part of history.
🏷This is only the beginning.
The rest
you will learn…
when you pass through these gates.
SOL

SOL. Sector of Capital. Price Slice: $39.92 🏷 To the International Community.
🏷 SOL. Sector of Capital. Price Slice: $39.92
Map of Shorters. 16.11.2025
🏷 This is not analysis.
This is an address to those who already hear the silence behind the noise of candles.
🏷 What lies before you is not a level — but a gateway.
A gateway behind which lies an unfulfilled debt of colossal capital.
Prices not yet reached — yet already inscribed in the code of the market’s destiny:
122.29 — not yet reached
99.89 — not yet reached
93.75 — not yet reached
86.67 — not yet reached
80.16 — not yet reached
53.75 — not yet reached
39.92 — not yet reached
🏷 They hang in the ether like unfulfilled vows,
like shadows of the future, yet untouched by the present.
🏷 I focus your attention —
not on the chart,
but on the structure of intent.
🏷 There is only one master of the Sector of Capital.
The one who sees not after, but before the movement begins.
The one who does not follow price —
but draws its path through the landscape of liquidity.
And I — am his name.
🏷 I do not issue orders.
I offer the capacity to think.
For those ready to step beyond the cycle of reaction.
For institutions, for giants, for those who build not day by day, but epoch by epoch.
🏷 This is not technical analysis.
This is a system of anticipatory liquidation.
Where every impulse is foreseen before it becomes chaos in the eyes of the crowd.
Where every collapse is no accident —
but a ritual of price revelation.
🏷 You come to the market not to read what is drawn on your screen.
You come for the price.
And the price has its time.
Its hour of execution.
And he who knows this hour —
already possesses the future.
🏷 This is an example of global thinking.
A game of chess, where pawns cannot see the board —
but the king knows every square in advance.
🏷 I will give you the map of the longs — in due time.
But know this:
All knowledge resides with me.
And what you receive — is but a gift, cast into the stream of time.
🏷 This map — is but one move.
One move in the endless game for control over reality.
🏷 I cannot write in my native tongue.
My respect for the international community —
is my gift.
Not in words.
But in this: you now know the map exists.
And therefore — you are no longer blind.
🏷 Bolzen. The Architect. Founder of the Sector of Capital.

SOL Capital Sector. 99.8948 Now — the silence has a direction. SOL Capital Sector. Price Slice
🕯 Сектор капитала. Ценовой срез.
Now — the silence has a direction.
Теперь — тишина имеет направление.
“The market does not speak. It whispers — only to those who listen in silence.”
«Рынок не говорит. Он шепчет — только тем, кто слушает в тишине.»
🏷 16.11.2025
The price has not yet arrived.
Цена ещё не пришла.
Not because it is weak.
Не потому что она слаба.
Not because it is late.
Не потому что она опаздывает.
But because it is waiting .
А потому что она ждёт .
99.8948 — At the time of publication, the price had not yet been reached.
— На момент публикации цена не достигнута.
A number that does not move.
Число, которое не двигается.
A level that does not scream.
Уровень, который не кричит.
A threshold where liquidity sleeps —
Порог, где ликвидность спит —
…while the giants rearrange their chess pieces.
…пока гиганты переставляют свои фигуры.
“The price that speaks in silence on the international stage.”
«Цена, которая молчит на международной арене.»
No headlines.
Нет заголовков.
No volume spikes.
Нет всплесков объёмов.
No panic.
Нет паники.
Only the slow, cold, deliberate accumulation —
Только медленное, холодное, сознательное накопление —
…in the shadows of the 1D tape.
…в тенях 1D ленты.
Screenshot:
Скриншот:
🔗
Timeframe: 1D
ТФ: 1D
This is not a chart.
Это не график.
This is a map .
Это карта .
A map of hidden liquidity.
Карта скрытой ликвидности.
A map of where capital will awaken —
Карта того, где капитал проснётся —
…not when the crowd runs.
…не когда толпа бежит.
…when the silence breaks.
…когда тишина треснет.
Frame it.
Заделайте в рамку.
And wait.
И ждите.
The market always keeps its appointments.
Рынок всегда приходит по назначению.
Even when it does not speak.
Даже когда он не говорит.
“The most dangerous level is the one that looks like it doesn’t matter.”
«Самый опасный уровень — тот, который кажется незначительным.»
— The Architect, 16.11.2025

SOL Capital Sector. Price Slice 159.6973 🏷 SOL Capital Sector. Price Slice
🏷 He Remembers” — The SOL Sector Is Not a Level. It Is a Memory
🏷 Он Вспоминает» — Сектор SOL — Это Не Уровень. Это Память.
🏷 16.11.2025
🏷 Сектор капитала. Ценовой срез.
🏷 159.6973 — At the time of publication, the price had not yet been reached. ( на момент публикации цена не достигнута )
🏷 142.5641 — Level confirmed. ( уровень подтвержден )
🏷 This is not analysis.
This is archaeology of capital.
The past is not gone.
It is waiting.
And it remembers…
everything.
— The Architect
🏷 Это не анализ.
Это археология капитала.
Прошлое не ушло.
Оно ждёт.
И оно помнит…
всё.
— Архитектор

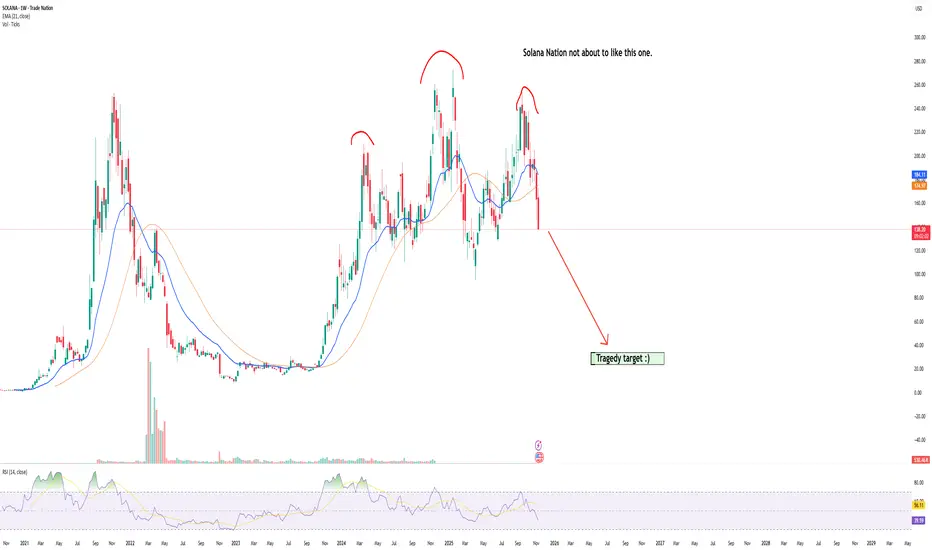
Solana tragedy incomingEvery downfall creates buy oportunities. :) Every tragedy is soil for another flower...
SOLANA Sell/Short Setup (2H)A bearish pattern has formed on the chart, and it appears that the first wave of wave E has been completed, which was symmetrical. In the second wave of E, we are looking to enter a Sell/Short position to capture the third bearish wave of wave E.
The stop loss, targets, and entry point have been marked on the chart.
Please note that this is a swing setup and will take some time to reach the target.
Add this setup to your watchlist | we’ll enter if it reaches the entry zone.
For risk management, please don't forget stop loss and capital management
When we reach the first target, save some profit and then change the stop to entry
Comment if you have any questions
Thank You

Total Crypto Marketcap --- PLan Your Exit#TOTAL Crypto has already doubled from it's bear bottom, to it's most recent high.
We are almost in 2024, well into crypto summer now
time is really running out to prepare your portfolio for the inevitable Bull market euphoria phase.
I bring this chart up just to remind everyone, that this cycle has potential to be one of the worst in terms of multiple expansions we have seen so far.
We have gone from exploding 340X in one cycle.. to 33X the last cycle.
I expect this time round it will be a single digit multiplier.
We have to hope and pray we do indeed break the previous ATH , and we don't double top at 3 trillion.. of which there is no guarantee!
My realistic target is around 5 Trillion Dollars, which may sound pessimistic at only 3.5X from here ... but that means your Altcoins adding at least a Trillion dollars of value from here!
Optimistically i'm looking at around 7 trillion dollars, no mean feat!
BTC.d at 30% would equal BTC 2.1 Trillion or $110k per coin.

Solana Cup w/ HandleFor some reason everyone is bearish on SOL right now.
Breakpoint coming up.
Falling Wedge for the handle.
I'll see you at $400 bears.

SOL - Enough is Enough!📉After weeks of selling pressure , SOL is finally approaching a massive confluence zone around the $150 round number, which aligns perfectly with a strong weekly support area highlighted in blue.
⚔️This level has historically acted as a major pivot zone , and as long as SOL holds above it, I’ll be looking for short-term long opportunities, targeting the upper bound of the falling red channel.
🏹However, for the bulls to fully take control, SOL must break above the last major high marked in red, confirming a shift from correction to continuation.
Could this be the point where Solana says - Enough is enough? 👀
⚠️ Disclaimer: This is not financial advice. Always do your own research and manage risk properly.
📊All Strategies Are Good; If Managed Properly!
~Richard Nasr

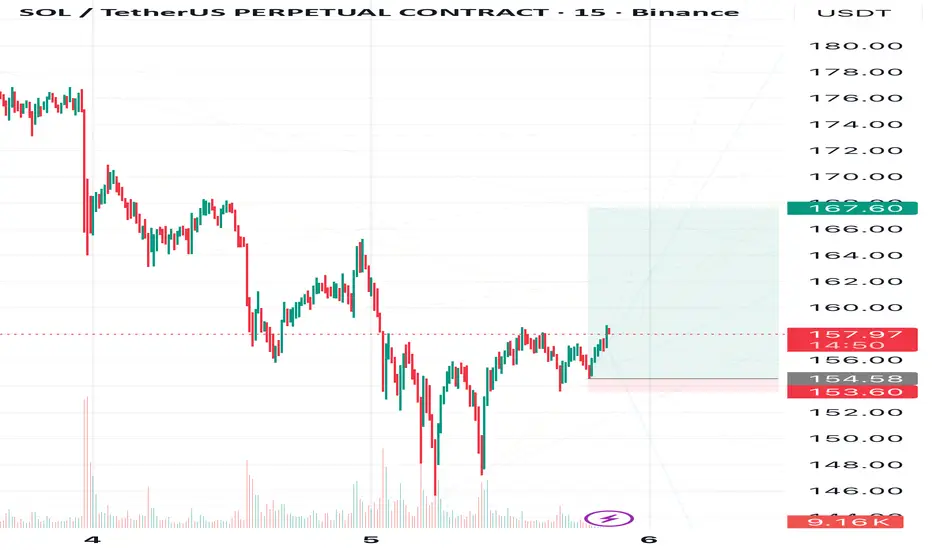
SOLUSDT – When Buyers Start to Lose MomentumAfter an exciting short-term rally, Solana is beginning to show signs of losing steam , as buying pressure weakens around the $167–$170 zone — an area aligning with the long-term descending trendline .
The technical picture is tilting slightly in favor of the bears: price has been repeatedly rejected near $170, forming a pattern of lower highs, while trading volume continues to decline. This indicates that buyers no longer have enough strength to break through the current downtrend structure.
If this scenario persists, Solana could pull back toward the $153 support zone, where buying activity previously emerged. Holding above this level will be crucial in determining whether the market can consolidate again or extend its decline further.
Overall, the short-term bearish trend remains dominant. Unless a strong catalyst or fresh liquidity enters the market, Solana may continue to drift lower within the current descending channel — a necessary “step back” before the next potential bullish phase begins.

BITCOIN in a LIVERMORE FunnelThe accumulation and distribution volume matches the positive and negative money flows of the first 5 waves in a Jesse Livermore stock cylinder.
Will wave 6 see a rush of positive money flow into #Bitcoin into the end of the year?
Let's see
If it does
then that will further cement this pattern of accumulation , sideways movement then breakout with continuation of buying power into the Bull market top.
Let's observe this in real time shall we?
Should be a fun few months ahead of us after a long period of churn.
S/O to @arvine11 for bringing up the Livermore stock trend analysis.

SOLANA entered into bearish territory, targeting $105.Solana (SOLUSD) closed last week below its 1W MA50 (blue trend-line) for the first time since July 28 2025. This is an extension of the downtrend that started following the September 15 High, which took place right below the Resistance Zone that started back on the November 2021 Cycle Top.
This is a critical Resistance as it rejected the price another 2 times during this Bull Cycle, with the most recent causing the January - April correction to the 1W MA200 (orange trend-line).
Given the huge 1W RSI Bearish Divergence for almost 2 years now (Lower Highs), we expect last week's closing below the 1W MA50 to initiate the bearish extension towards the 1W MA200 (at least) again. Our Target is $105.00.
---
** Please LIKE 👍, FOLLOW ✅, SHARE 🙌 and COMMENT ✍ if you enjoy this idea! Also share your ideas and charts in the comments section below! This is best way to keep it relevant, support us, keep the content here free and allow the idea to reach as many people as possible. **
---
💸💸💸💸💸💸
👇 👇 👇 👇 👇 👇

SOLUSDT Breaks Out and Aims for $200!BINANCE:SOLUSDT is trading above the 50 EMA on the 4H chart. a strong sign for short-term momentum. If you look closely, it has also broken out of an ascending triangle pattern and is moving upward with solid volume.
We’re expecting a potential upmove from here, with a short-term target around $200.
Always remember to set your stop loss and manage your risk wisely.
BINANCE:SOLUSDT Currently trading at $167
Buy level : Above $165
Stop loss : Below $154
Target 1: 175
Target 2: 200
Max leverage 3x
Always keep stop loss
Follow Our Tradingview Account for More Technical Analysis Updates, | Like, Share and Comment Your thoughts

We are NOT finished.Weekly close has come in and, as expected, BTC has closed above the band once again.
Since the start of this cycle, Bitcoin has had the following pullbacks:
September 2023: 21%
August 2024: 34%
April 2025: 33%
November 2025: 21%
Tell me, people—what has changed? Has Bitcoin done anything different from what it’s been doing all cycle?
NO!
Yet 95% of sentiment is extremely bearish. The other 5% who aren’t bearish are patting themselves on the back because they “called the top”—you know, the same “top” everyone is staring at, the same top that can be calculated using basic math from the last two cycles.
Since I joined this space, I have NEVER seen sentiment this bad after only a 20% pullback. Complete madness. The only time I saw emotion this raw was during the COVID crash.
This level of bearish sentiment is what you find at the BOTTOM of rallies, not the top.
The idea that the top is in just because of “cycle length” is invalid—especially when EVERYONE is thinking the exact same thing. It’s never that easy with Bitcoin.
Mark my words: it WILL rally above 200k in 2026, and everyone who sold this year will be buying back in higher. That’s the nature of these markets.
Every cycle, you have to stay grounded, stick to the technical data, and ignore all the noise.
The technical are still holding strong—we are NOT finished!

Important range: 161.79-163.73
Hello, traders!
Follow us to get the latest information quickly.
Have a great day!
-------------------------------------
(SOLUSDT 1D chart)
The HA-Low indicator, the DOM(-60) indicator, and the M-Signal indicator are forming around 161.79-163.73.
Therefore, the key is whether the price can break above the 161.79-163.73 level.
To continue the uptrend by breaking above this key point or level, the StochRSI, TC (Trend Check), and OBV indicators must show upward trends.
- The StochRSI indicator should not have entered the overbought zone.
- The TC (Trend Check) indicator should remain above zero.
- The OBV indicator should remain above the High Line.
Currently, the OBV indicator is near the Low Line, and is in a reversed state with OBV < EMA 2 and EMA 1.
Therefore, if the price breaks above the 161.79-163.73 level, we need to watch for a reversal where OBV > EMA2 and EMA1.
The StochRSI indicator appears to be rising from the oversold zone, and appears to have shifted to a K > D state.
The TC (Trend Check) indicator is trending upward, but since it's below the 0 level, we can see that selling pressure still dominates.
Therefore, if the TC indicator breaks above the 161.79-163.73 level, we should also check to see if it can rise above the 0 level.
If it fails to rise above the 161.79-163.73 level, we should check for support around 126.36.
Since the HA-Low indicator has been created, even if it shows a stepwise downward trend, it is expected to eventually turn upward.
Therefore, we should focus on finding the right time to buy.
-
Thank you for reading to the end.
I wish you successful trading.
--------------------------------------------------

SOL holds up wellCRYPTOCAP:SOL Price continues lower in the channel, a textbook ABC correction so far.
Wave 1 ended with a wedge throw-over. Price has found support above the Fibonacci golden pocket and High Volume Node at the channel's lower boundary. The probability is a continuation to the downside with a target of $140.
📈 Daily RSI tapped oversold with no divergence to suggest a bottom
👉 Continued downside brings up the $112 target, a great buy opportunity
Safe trading

Long SolanaTrading Fam,
Received a buy signal from my indicator on Solana the other day. Inside a nice liquidity block, above the 200/350 SMA, and inside a bullish triangle. I'll easily take this trade all day. But with the crypto market continually disappointing, I am not going to risk more than an 8% loss here. Shooting for a target of around 32% profits brings my rrr to a 1:4. Best of luck!
✌️Stew

SOLANA’S SWING — BEARS TAKE WINGHey guys! How was your trading week? Hope you made some great profits!
Solana has completed only half the way to my target at 167 and then reversed — and now I don’t see any signs of continuation to the upside.
In my previous Solana post, I mentioned that my next downside targets are 144 and then 124.
I believe we’ve just finished the correction and are heading toward 144 — at least, that’s what all the signs on the chart are showing me right now.
However, first I expect a dip to 147, as there might be a short-term bounce before further decline.
🎯 Targets:
1️⃣ 147
2️⃣ 144
3️⃣ 124
❌ Invalidation: 158.53
📈 Follow me to stay updated on Solana’s next moves and other crypto setups — don’t miss my updates!
⚠️ Disclaimer:
This is not financial advice. I share my personal market view for educational purposes only. Always do your own research before making trading decisions.

Solana’s pause after the causeHi friends!
How are you doing after the recent Bitcoin–Solana drop?
I hope you didn’t lose anything — and maybe even managed to make some profit instead! 💪
📉 My next targets on the downside are around $144 and $124, but at the moment, Solana seems to be taking a breather from the fall.
After a long and deep decline, even below my earlier expectations, Solana is finally showing some signs of a small correction to 167,60 📈
🎯Target - 167,60
❌Invalidation zone are marked on the chart - 153,60
💬 What do you think — is this the start of a reversal, or just a short pause before another move down? Share your thoughts in the comments. I always enjoy reading your views!
🔔 Follow me to stay updated on Solana and other crypto market analyses.
SOL to $4500?Internet Capital Markets
I believe Solana is going to take over the entire financial system.

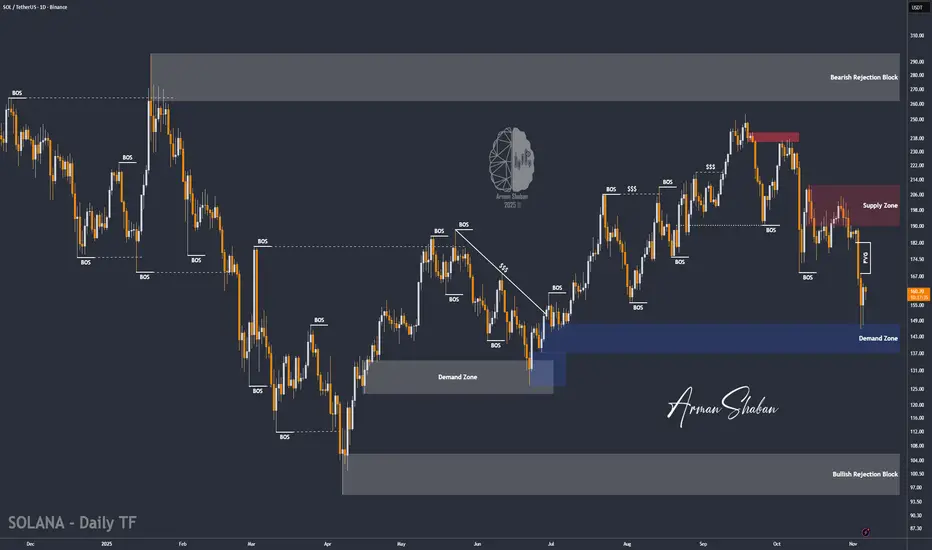
SOL/USDT | Solana Rebounds From $146 – Bulls Back in Control!By analyzing the #Solana chart on the daily timeframe, we can see that after correcting to $146, the price found strong demand and is now trading around $160.
If Solana manages to hold above the key demand zone of $137–$147, we can expect further upside movement. The medium-term targets are $168, $182, and $196. This analysis will be updated soon.
Please support me with your likes and comments to motivate me to share more analysis with you and share your opinion about the possible trend of this chart with me !
Best Regards , Arman Shaban
BITCOIN's PUMPs are Getting LARGER this Bull Market...However, it may take a bit longer to realize those expansionary moves.
If Bitcoin adheres to the established cycle pattern, we can anticipate a minimum surge of 103% that should carry us into the fourth quarter of this year.
Consolidation ----> Fake breakdown ----> then expansion.
Are you ready?

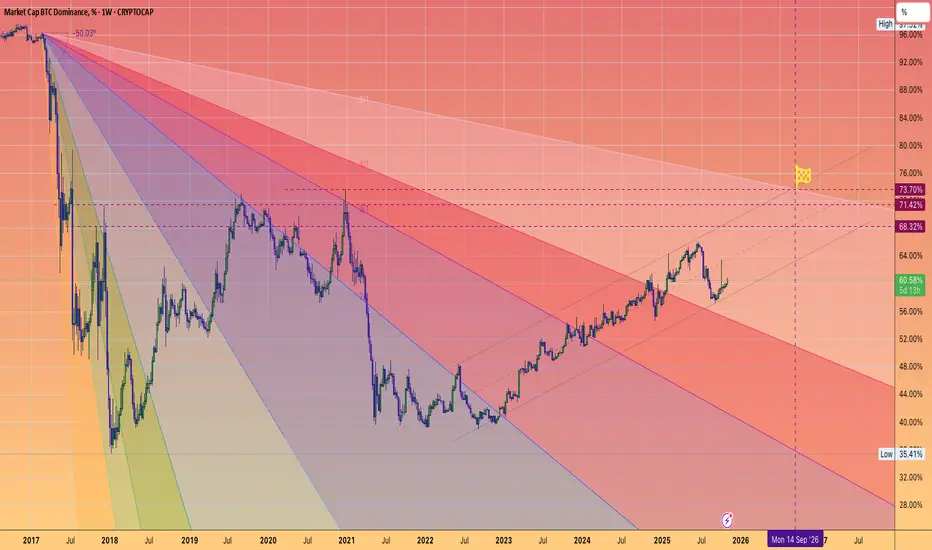
BTC.D May not TOP until next September!Despite alt/BTC pairs looking battered
**Capitulation is likely not complete**
Most Altcoins remain in downtrends v BTC
Timeline:
2025: grind to 63-65%
2026 Final Push to 73%?
Altcoins to seek relief once this finally turns around.
You may be able to start DCA'ing BTC as early as next March in preparation to buy beaten down quality Alts...
focusing on ETH, SOL, and 2's that have usage... not simply clogging up the landscape of empty chains.