$Solana $250+ or DOWN 216?In our recent post, we perfectly predicted the touch of 250 and 190.
Price has now reversed off the supply zone and is making its way back up, lets see what the potential out come for the next two weeks are!
Solana (SOL/USDT) 1H Chart Analysis
Current Price: ~$232
Trend : Price is was inside a clear ascending channel, respecting support and resistance lines - however has now breached resistance.
Key Levels
Support Zones:
$225 → Psychological support + 4H FVG.
$216 → Deeper 4H FVG and strong volume node. ( + 4 Hour Fib GP )
$200 → Major psychological level + prior supply zone flip.
Resistance Zones:
$250 → Psychological resistance + demand zone.
$275 → Next major resistance if $250 breaks.
Bullish Scenario
If SOL holds above $225 and consolidates within the trend channel, price could retest $250.
Break and close above $250 may extend rally toward $275.
Bearish Scenario
Failure to hold $225 could drag SOL to the $216 FVG or even $208.
A breakdown of $208 increases risk of revisiting $200.
Summary
Market structure remains bullish as long as price respects the rising trendline.
$225 is the key short-term pivot: holding above favors $250+, losing it opens downside risk toward $216–200.
Let me know what you think!
Solana

SOLUSD - Up Channel A sharp up channel has formed on solana's daily chart
im allowing further movement up as price bounces off the fib circle ring
bullish towards the top of channel
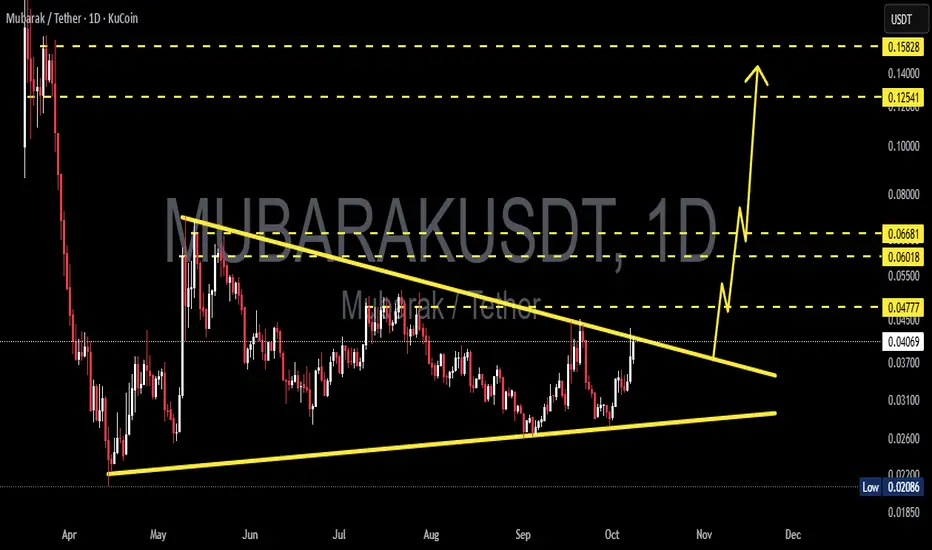
MUBARAKUSDT — On the Edge of an Explosive Move: Bullish BreakoutThe MUBARAK/USDT pair is approaching a crucial moment as price action compresses inside a Symmetrical Triangle, signaling the market’s tension before a major breakout.
Whenever price reaches the apex of a pattern like this, it often precedes a sharp expansion in volatility — a make-or-break moment for traders.
---
🔶 Pattern Overview & Technical Structure
The Symmetrical Triangle represents a battle of equilibrium between buyers and sellers:
The descending upper trendline keeps pushing lower highs.
The ascending lower trendline protects higher lows.
As both lines converge, energy builds up within the pattern — usually leading to an explosive breakout once one side wins.
Declining volume supports this setup, hinting that a big move is imminent.
---
💹 Key Technical Levels
Current Price: around 0.04050 USDT
Main Resistance: 0.04777 → 0.06018 → 0.06681
Dynamic Support: 0.03100 → 0.02600
Major Support: 0.02086 (historical low)
If a confirmed breakout occurs, the measured move projection from this triangle points toward a potential upside target near 0.086, depending on follow-through and volume confirmation.
---
🚀 Bullish Scenario (Upside Breakout)
Confirmation: A daily candle close above the descending trendline with strong volume.
Continuation: Retest of the breakout zone that turns former resistance into new support.
Upside Targets:
TP1 → 0.04777 (initial resistance)
TP2 → 0.060–0.0668 (supply zone)
TP3 → around 0.086 (measured move projection)
Momentum catalysts — such as surging volume or renewed altcoin rotation — could accelerate this breakout move.
---
⚠️ Bearish Scenario (Rejection / Breakdown)
Confirmation: Strong rejection at upper trendline with long wick and close back below resistance.
Breakdown Trigger: Daily close below the ascending trendline with increasing sell volume.
Downside Targets:
0.026–0.031 (dynamic support zone)
Below that → retest of 0.02086 (historical demand level)
Failure to hold support could spark panic selling, especially given MUBARAK’s relatively low liquidity profile.
---
📊 Momentum Checklist
Watch closely for:
Volume spikes → true breakout confirmation.
Daily close above 0.04777 → bullish validation.
Daily close below 0.03100 → bearish confirmation.
Avoid reacting to intraday wicks — focus on daily candle closes for real signals.
---
🧭 Conclusion & Technical Bias
MUBARAK is standing at a critical compression point — the calm before the storm.
A confirmed breakout could open the path toward 0.06–0.086, while rejection at the trendline risks sending price back below 0.03.
Volume and daily close confirmation will determine whether bulls or bears take control next.
---
#MUBARAK #MUBARAKUSDT #CryptoBreakout #TrianglePattern #TechnicalAnalysis #Altcoin #KuCoin #CryptoTrading #SymmetricalTriangle #ChartAnalysis
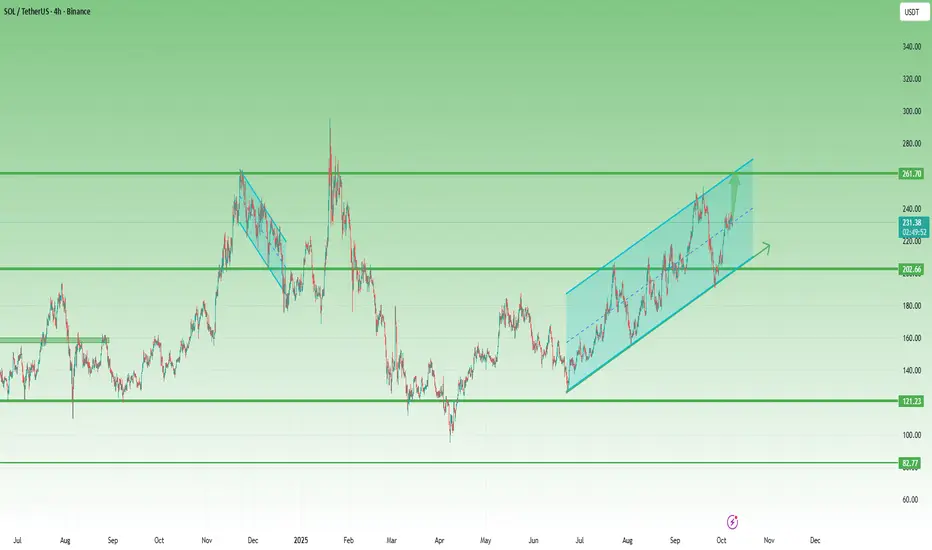
Solana in an Ascending Channel – Bulls Must Hold Above 215After the strong correction from 300 to below 100, Solana finally started to recover. Following an impressive 90% rebound, the price corrected again but managed to form a higher low just above the 120 support zone — a constructive signal for medium-term buyers.
Since then, Solana has been trading inside an ascending channel, showing consistent bullish control with well-defined higher highs and higher lows.
Recently, the market spiked slightly below 200, only to confirm the lower boundary of this channel before bouncing back.
In my previous SOLUSDT analysis, I mentioned that it was imperative for bulls to hold the 200 level to validate the ongoing reversal structure — and that’s exactly what happened. The market respected this support zone perfectly, leading to a 15% advance since then.
At the time of writing, Solana is consolidating near the midline of the ascending channel, suggesting a temporary pause before the next potential leg higher.
If this consolidation breaks to the upside, the next key target for bulls is 260, a confluence resistance formed by the upper boundary of the channel and the November 2024 swing high.
________________________________________
🔹 Summary
• Strong support: 200 (confirmed)
• Ideal bullish threshold: Above 215
• Next resistance: 260 followed by 300
• Structure: Ascending channel – continuation pattern
________________________________________
In conclusion, Solana remains bullish while holding above 200, but ideally, the price should stay above 215 to preserve upside momentum.
A breakout above 240 would likely trigger a test of 260 followed by 300, which becomes very probable— the next key resistance zone. 🚀
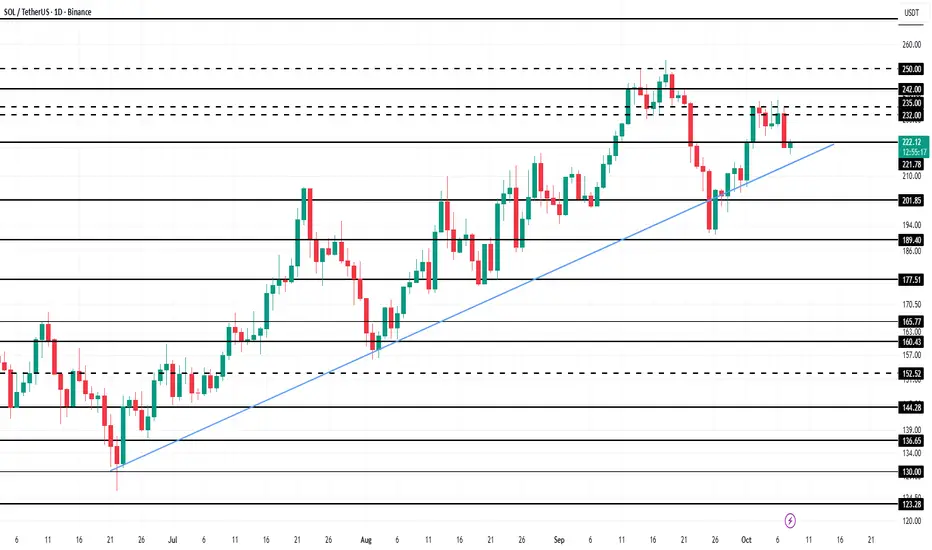
Solana Price’s 4-Month Uptrend Is Intact, But It May Not Last LoAt press time, Solana trades at $222, hovering just above the $221 support level. The altcoin has been in a consistent upward trend for the past three and a half months, making this level crucial for maintaining market structure.
Given current conditions, a dip to $213 seems likely if selling pressure increases. Stronger outflows could accelerate losses, pushing SOL to test the $200 level and breaking its multi-month uptrend.
Conversely, if Solana rebounds from $221 and market sentiment improves, it could climb toward $232 and beyond. Such a move would invalidate the bearish outlook and potentially reignite the rally.
$300 Solana Inevitable!Nice rejection on Solana. Now lets see if we will get the move to the downside for a nice long trade to target $300.
Calculate Your Risk/Reward so you don't lose more than 1% of your account per trade.
Every day the charts provide new information. You have to adjust or get REKT.
Love it or hate it, hit that thumbs up and share your thoughts below!
This is not financial advice. This is for educational purposes only.

solana x binance coin Solana follow it Binance Coin on its journey to $1k
CRYPTOCAP:SOL vs. CRYPTOCAP:BNB

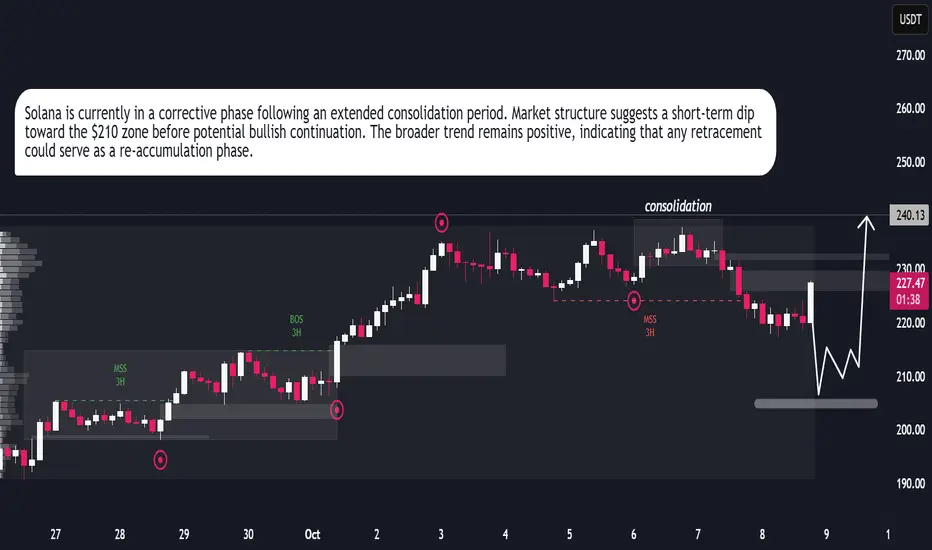
SOL | Network Strength Meets Market MomentumSolana (SOLUSDT) continues to show resilience as both technical and fundamental factors align for potential upside. On the technical side, the market has completed a controlled correction phase, suggesting liquidity buildup below recent lows. The structure remains bullish, with increasing volume and price stability hinting that buyers are regaining control. Fundamentally, Solana’s network growth and strong developer activity have reinforced investor confidence, supported by rising on-chain activity and ecosystem expansion in DeFi and NFTs. This combination of solid fundamentals and technical structure indicates the possibility of another bullish leg, with SOL positioning itself for a gradual climb toward the $240–$250 range in the near term.
KOMAUSDT — Trendline Breakout: Structural Reversal or Bull TrapOverview
KOMA/USDT has finally delivered a significant technical signal after months of consolidation within a tight accumulation range.
The latest daily candle successfully broke above a major descending trendline and a key horizontal resistance, signaling the early phase of a potential trend reversal from long-term bearish pressure to renewed bullish momentum.
This breakout could represent a psychological shift in market sentiment — from distribution to accumulation — and may define the next major leg of price expansion if confirmed by volume and structure.
---
Market Structure Insight
Primary Trend: Bearish since early 2025, marked by consistent lower highs and lower lows.
Structural Shift: A clear daily breakout above the descending trendline suggests the start of a higher-high structure formation.
Key Zone (Accumulation Range): The 0.020–0.027 area has acted as a multi-month resistance zone, now potentially flipping into new structural support (S-R Flip).
Momentum Confirmation: A strong breakout candle accompanied by volume expansion hints at growing institutional interest.
---
Technical Pattern Breakdown
The pattern combines two powerful structural elements:
Descending Trendline Breakout → indicates exhaustion of long-term selling pressure.
Range Accumulation Base → acts as the energy build-up phase before a new impulsive move.
If the price performs a successful retest of the breakout zone, this pattern transitions into a trend reversal base, which historically precedes sustained bullish continuation phases.
---
Bullish Scenario (Primary Bias)
1. Validation Conditions:
Daily close above 0.027 with sustained trading above the breakout zone.
Rising volume and RSI holding above the 50 line.
2. Continuation Setup:
A clean retest followed by a higher low formation would confirm structural reversal.
3. Upside Targets:
TP1: 0.0489 — First expansion resistance.
TP2: 0.0633 — Mid-term structural level.
TP3: 0.0935 — Major resistance zone.
Extended targets: 0.128 – 0.169 if momentum persists.
4. Stop-Loss Placement:
Below 0.020 or under the most recent swing low.
5. Risk/Reward Outlook:
Strong R:R potential (>3R) from the breakout base with multi-tier scaling opportunities.
---
Bearish Scenario (Alternative Bias)
1. Invalidation Trigger:
Daily close below 0.020 or a re-entry into the previous range (false breakout).
2. Market Implications:
A bull trap scenario could trigger a deeper correction toward 0.0142, the historical low support.
3. Volume Confirmation:
A drop with rising sell volume would confirm distribution rather than accumulation.
4. Bias Reversal:
If this occurs, the broader bearish structure remains intact and consolidation may resume.
This type of breakout often marks the transition from accumulation to markup phase, particularly if confirmed with a successful retest and sustained buying volume.
KOMA/USDT has just broken through the upper boundary of a long-standing downtrend — a technical milestone that could set the stage for medium-term reversal momentum.
However, confirmation is key. Without a retest that holds, this move could remain a temporary liquidity sweep.
Traders should closely monitor daily closes and reaction around the 0.027 zone to confirm whether this is a true structural reversal or merely a bull trap.
#KOMA #KOMAUSDT #CryptoAnalysis #BreakoutTrading #TechnicalAnalysis #PriceAction #AltcoinWatch #CryptoMarket #TrendReversal #SupportResistance #RiskManagement

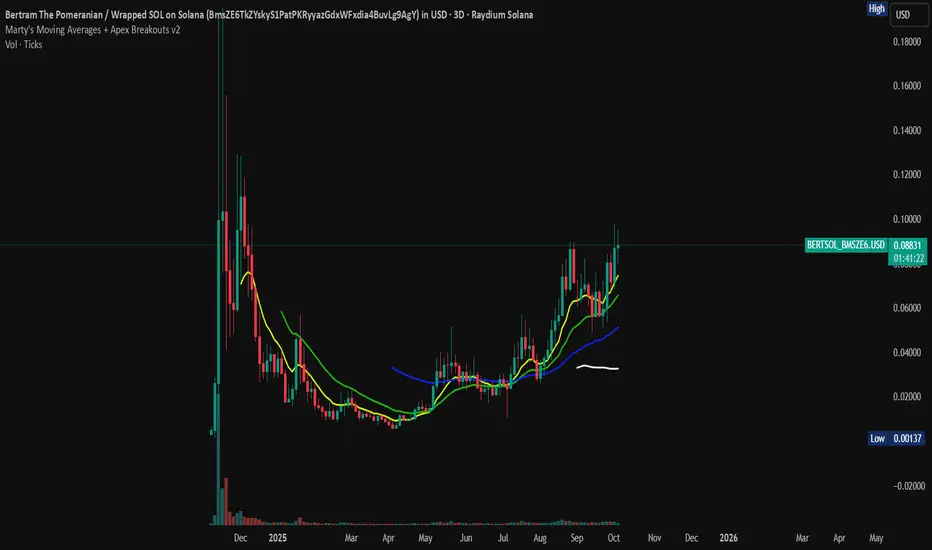
BERT getting ready for parabolic moveBERT is above the major metrics, and looks like it's arming for a parabolic move.
Clear trend, good weather on the 12hr chart with compressionary force active on major period lengths. I would not expect a swing low for a better entry as the price is peeling up at the moment.
On the 4hr chart we are seeing tremendous compression. A very large move is possible within the next couple of days. Although I'd say it depends on the major cryptos bring more inflows into the ecosystem. But Bitcoin is certainly poised for its melt up.
Bitcoin hits all-time high, altcoins follow suit!Bitcoin (BTCUSD) has smashed a new all-time high, reaching $125,700! The rally is fueled by steady inflows into spot ETFs, rising institutional interest, expectations of a softer Fed policy, and growing demand for safe-haven assets. Additional tailwinds include tech upgrades across networks and a revival in trading activity. This historic milestone for Bitcoin has lifted the entire crypto market. Investors are turning their attention back to top-10 altcoins — names with strong recognition, loyal communities, and clear development roadmaps.
Ethereum (ETHUSD) — trading around $4,558.76. The network has undergone major upgrades, making wallets more user-friendly and transactions faster and more stable. Layer-2 solutions are gaining traction, fees are becoming more predictable, and the network load is better distributed. As a result, investor interest in ETH-based tools and its ecosystem continues to grow. If Ethereum’s roadmap stays on schedule, it could further strengthen its position as the go-to platform for decentralized applications.
Solana (SOLUSD) — around $233.30. The ecosystem is preparing a high-performance validator module aimed at significantly boosting speed and resilience. This is critical for high-traffic use cases like exchanges, gaming, and micro-payment services. Solana is also set to gain the spotlight during a major industry conference later this year — a typical launchpad for new partnerships, grants, and product announcements. If improvements are implemented successfully, Solana could gain more ground in the fast and low-cost transactions segment.
BNB (BNBUSD) — approximately $1,208.83. The network continues to cut costs for users and developers, expand its toolkit for launching apps, and maintain price stability through regular supply control. The easier it becomes to build and scale on BNB Chain, the greater the volume — and the stronger the token demand. With security and performance updates expected on schedule, BNB remains a top-tier infrastructure asset.
FreshForex analysts believe Bitcoin’s record high reaffirms the global appetite for digital assets, while strong developments across major altcoins add depth and resilience to the market. Q4 2025 could deliver solid returns for active buyers — with the most powerful surge expected in Q1 2026.

Long the king, and short the "Sol" Jack ?Being long Bitcoin is being long on a healthy market rally with BTC.D bouncing, and therefore Bitcoin leading.
If BTC.D bouncing means an overall retrace on the market, I think Sol makes a good candidate for a short position to target 150s
I think the DATs and the ETF narratives are getting pretty exhausted, and that could make an extra argument, even if this is the part where it gets tricky (timing tops is hard).
Still, i think playing this with 30/40% of the Bitcoin long is EV+
Game on!

BNB/USDT | BNB Smashes $1200 Target – Momentum Remains Strong!By analyzing the BNB (Binance Coin) chart on the weekly timeframe, we can see that the price continued its bullish rally exactly as expected, breaking multiple new all-time highs (ATHs) and hitting the $1200 target.
It’s now trading around $1220, and the previous analysis remains valid. The next upside targets are $1400 and $1550, while the main support and demand zone lies between $980–$1050.
This setup has delivered over 30% profit so far — hope you made the most of it!
Please support me with your likes and comments to motivate me to share more analysis with you and share your opinion about the possible trend of this chart with me !
Best Regards , Arman Shaban

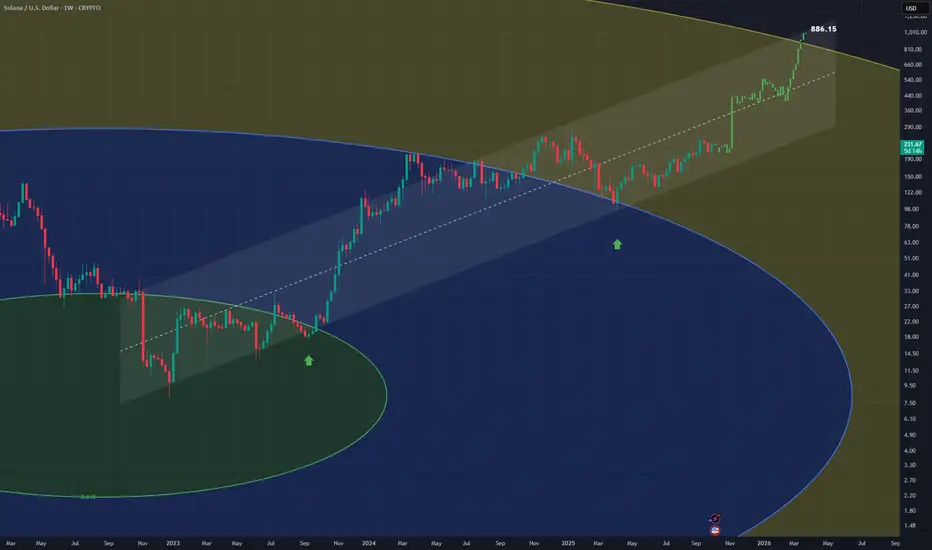
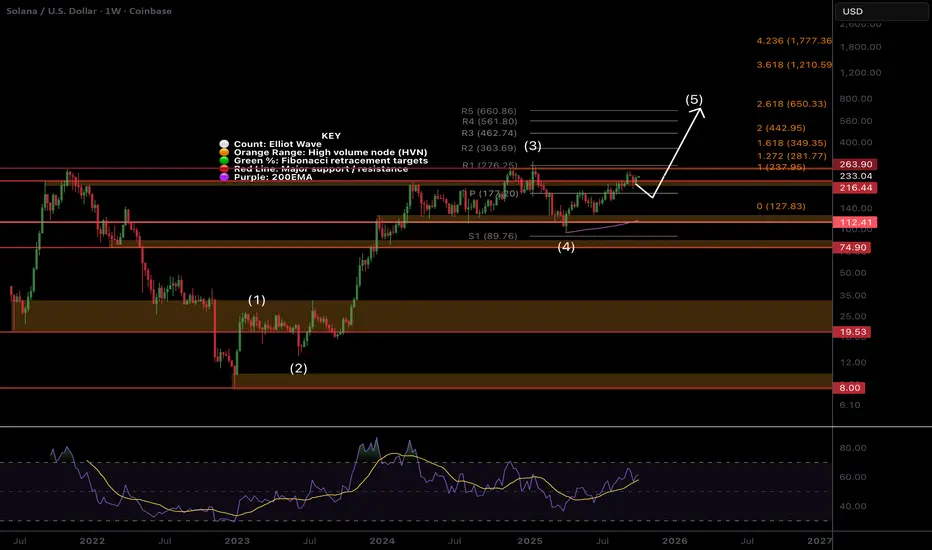
SOL Macro - Time for Price discovery?$SOLWeekly RSI has returned to the EQ giving Solana plenty of space for upside growth! Price is attempting to break into all time high but just can’t find the momentum it needs. This is good thing for now, keeping volatility to a minimum!
Weekly R5 Pivot and Fibonacci extension targets are $660. Price is above the weekly pivot showing the uptrend is in tact and may well test it as support again!
Consolidating under resistance for an extended period often leads to a breakout!
Safe trading
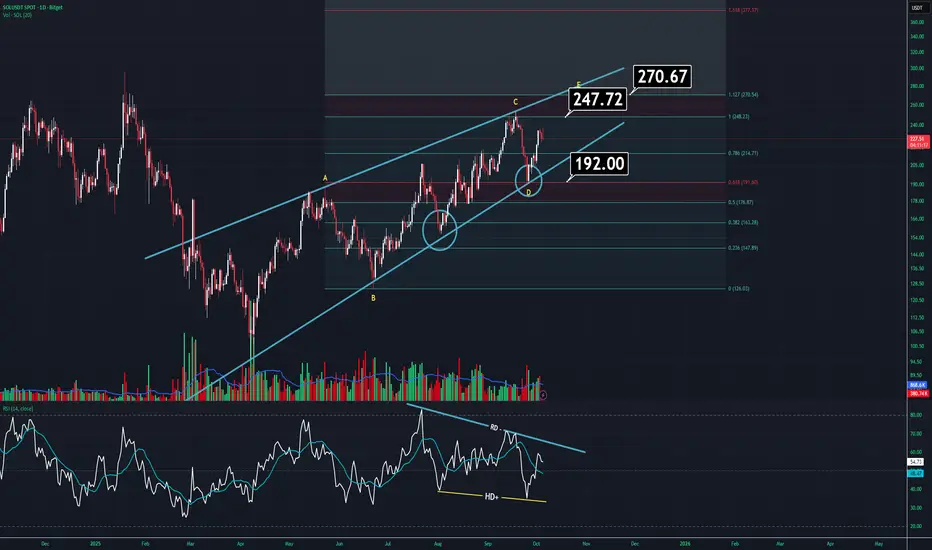
SOLANA UPDATE (1D)SOL is currently at a decision point, mainly due to both the ongoing recession and the delayed ETF approvals.
On the daily chart, it’s getting squeezed inside a large wedge pattern. Normally, it should make one more top before breaking down. However, just to be clear — if price drops below 192, there’s a strong possibility of a sharp sell-off. That’s where both the character shift and wedge breakdown would occur.
Some additional details:
Volume is flat and indecisive. It’s moving in line with the wedge, which isn’t a great sign. Typically, this kind of volume behavior is seen during wedge formations.
The RSI looks unusual — there are both negative and hidden bullish divergences. If you’re wondering which one matters more, it’s the hidden bullish divergence — it’s the stronger signal here.
If the recent high is broken, we could see SOL climbing towards the 270 region, after which we’ll know whether the wedge remains valid. However, in general, the outlook doesn’t look too strong at the moment.
TradersCity Pro | Solana Bulls Eye Breakout Beyond Resistance👋 Welcome to TradeCity Pro!
In this analysis, I’ll be breaking down Solana (SOL),one of the most popular “Ethereum Killer” projects, currently ranked #6 on CoinMarketCap with a market cap of $122.87B.
⌛️ 4-Hour Timeframe
On the 4-hour chart, Solana started a bullish move after being supported at the $194 zone. Once it broke the trigger at $213.14, it rallied strongly toward the next resistance zone I’ve marked on the chart.
✨ At the moment, that bullish wave has cooled off. The RSI has exited the overbought zone, and price has been rejected from the resistance ceiling.
✔️ The next bullish trigger we’re watching will be a clean breakout of this resistance zone. On future retests, we can identify the exact resistance level more precisely and use it as an actionable entry trigger.
⭐ The main resistance for SOL is at $248.58. A breakout here would confirm the start of a larger bullish wave in the higher cycles. That’s why it’s important to already have a position before this breakout—so if the level flips, you’re not left behind and your earlier long runs into solid profit.
🔍 If price pulls back, the outlook remains bullish as long as SOL stays above $213.14. In that case, I see more probability for the next bullish leg than for a trend reversal.
📊 However, if $213.14 breaks and price consolidates below it, that would be the first confirmation of a bearish shift and a possible trend reversal.
📝 Final Thoughts
Stay calm, trade wisely, and let's capture the market's best opportunities!
This analysis reflects our opinions and is not financial advice.
Share your thoughts in the comments, and don’t forget to share this analysis with your friends! ❤️

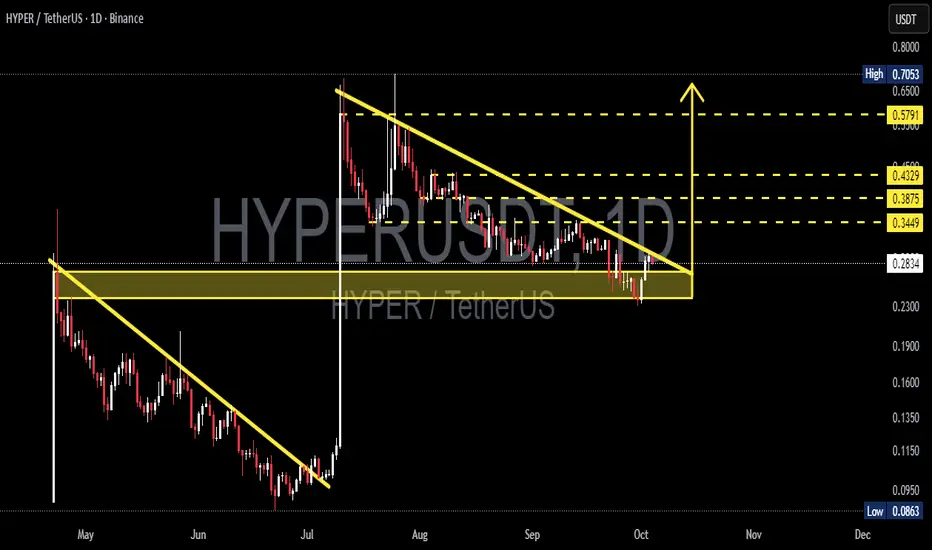
HYPER/USDT — Descending Triangle: Breakout or Breakdown?🔎 Overview
HYPER/USDT is currently trading inside a crucial consolidation zone (0.23–0.29 USDT) while being compressed by a descending trendline.
This setup forms a descending triangle pattern, typically a bearish continuation, but in some cases (especially after a strong rally), it can act as an accumulation phase before another bullish leg.
The market is now at a decision point — waiting for either a confirmed breakout to the upside or a breakdown below support.
---
📌 Pattern & Market Structure
Previous Trend: Strong pump in early July → followed by consolidation with selling pressure.
Main Pattern: Descending Triangle = flat horizontal support + descending trendline of lower highs.
Support Zone: 0.23 – 0.29 (highlighted yellow box on the chart).
Key Resistance Levels (if breakout occurs):
0.3449 → initial target
0.3875 → mid resistance
0.4329 → major resistance
0.5791 → extended target if momentum continues
Historical High/Low: High 0.7053 / Low 0.0863.
---
🚀 Bullish Scenario
1. Confirmation: A strong daily close above the descending trendline, ideally above 0.31.
2. Retest: Breakout gains strength if price retests the trendline and holds as new support.
3. Upside Targets:
TP1: 0.3449
TP2: 0.3875
TP3: 0.4329
TP4: 0.5791 (if rally extends)
4. Invalidation: A daily close below 0.23 invalidates the bullish setup.
---
🐻 Bearish Scenario
1. Confirmation: A daily close below 0.23 with strong volume confirms breakdown.
2. Downside Targets:
0.16 – 0.135 zone → historical support area
0.0863 → previous cycle low, major bearish target
3. Invalidation: If price reclaims and sustains above 0.34, the bearish outlook fails.
---
⚖️ Conclusion & Outlook
Neutral Zone: As long as price stays between 0.23 – 0.30, the market remains sideways without clear direction.
Bullish Outlook: Needs confirmation with daily close above trendline.
Bearish Outlook: Breakdown below 0.23 would shift momentum clearly bearish.
Best Strategy: Wait for confirmation on daily close & volume before entering, since descending triangles are prone to false breakouts.
---
📝 Notes for Traders
Apply strict risk management (1–2% risk per trade).
Take partial profits at each resistance level.
Focus on daily closes and volume spikes for confirmation, not intraday wicks.
---
#HYPERUSDT #Crypto #TechnicalAnalysis #Altcoin #PriceAction #ChartPattern #DescendingTriangle #Breakout #Bearish #Bullish #SupportResistance
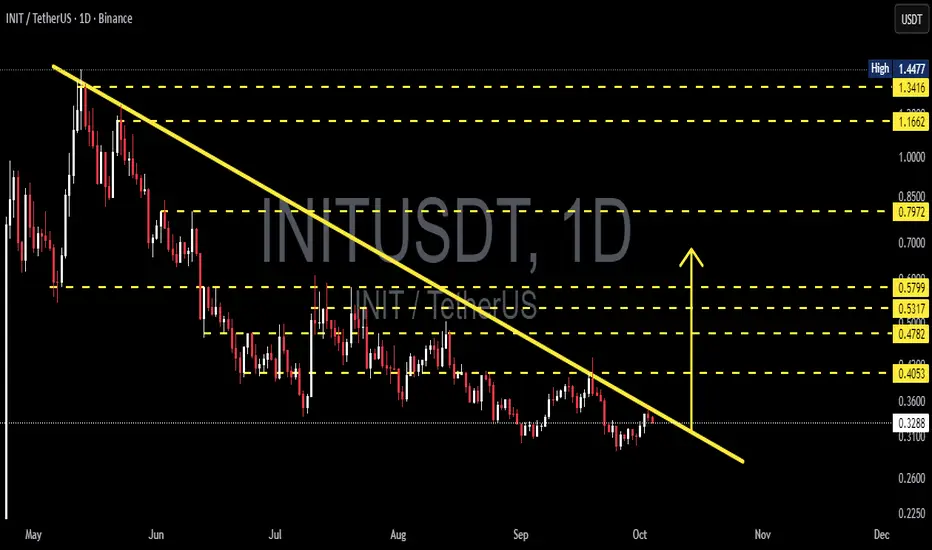
INIT/USDT — Breakout or Continuation of Downtrend?🔎 Chart Analysis
INIT/USDT has been in a clear downtrend since its peak earlier this year. The yellow descending trendline connecting the series of lower highs continues to act as a major dynamic resistance. Current price is trading around $0.3295, right at a critical decision zone.
Key elements on the chart:
Main Trend: Bearish (lower highs & lower lows).
Dynamic Resistance: Descending trendline (yellow).
Horizontal Resistances: $0.4053 – $0.4782 – $0.5317 – $0.5799 – $0.7972 – $1.1662 – $1.3416 – $1.4477.
Nearest Support: Consolidation zone around $0.3000 – $0.3100.
The price is now pressing against the trendline. A decisive move (breakout or rejection) will determine the next major direction.
---
📈 Bullish Scenario
1. Breakout Confirmation: Daily close above the descending trendline is required.
2. Retest Validation: A successful retest of the broken trendline turning into support would strengthen the bullish case.
3. Upside Targets:
First target: $0.4053 (+23%)
Next levels: $0.4782 (+45%), $0.5317, $0.5799
Extended targets: $0.7972, $1.1662, $1.3416, up to $1.4477 if a trend reversal solidifies.
4. Risk Management: Stop loss can be placed slightly below the retest level or below the $0.31 support zone.
---
📉 Bearish Scenario
1. Rejection at Trendline: If price gets rejected at the yellow line, the downtrend remains intact.
2. Breakdown of Support: A daily close below $0.30–$0.31 support zone could trigger a move to new lows.
3. Trading Plan: Aggressive traders may short at trendline rejection with stops above the rejection candle; conservative traders may wait for a breakdown + retest confirmation.
---
📊 Pattern & Structure
The chart highlights a descending trendline pattern, typical of bearish market conditions. However, the longer the price tests this resistance, the higher the chance of a breakout. At this stage, INIT is clearly at a make-or-break level.
---
📝 Conclusion
A confirmed breakout above the trendline could trigger a trend shift to bullish.
A rejection at the trendline confirms further downside pressure.
Horizontal levels act as step-by-step targets/resistances.
Risk management is crucial here due to the high probability of false breakouts.
---
#INITUSDT #INIT #Crypto #Breakout #Downtrend #BullishScenario #BearishScenario #TechnicalAnalysis #SwingTrading
SOL: Ready for a Big MoveWe can see CRYPTOCAP:SOL is currently in a period of accumulation, just like it was back in 2021 before a massive rally . The key rising support line has been holding up strong, and after periods of accumulation, the price has consistently exploded upwards, reaching new highs.
Right now , the price is approaching its previous all-time high (ATH), and if history repeats itself, we could be in for another "boom" phase. The price is holding well above the key support, which strengthens the bullish outlook.
Keep an eye on the price action around the ATH level, if we break through, it could signal the next major leg up. This setup looks very similar to past accumulation phases that led to significant price jumps.
#PEACE
Stay tuned for more updates

Bonk InuSEED_DONKEYDAN_MARKET_CAP:BONK 💹
Bonk Inu, one of the pioneers of the Solana memecoin category, is heading toward new highs with a broadening wedge.

SOLUSD sell at Market PriceHi everyone.
I think we can sell our Solana at this level.
I'll partial exit at first tp that I mentioned, and I think it will has potential to go lower.
Let's see what happens.
Good luck.
Dear traders, please support my ideas with your likes and comments to motivate me to publish more signals and analysis for you.
Best Regards
Navid Nazarian

Solana SOL price analysis📞 Rumor has it that as soon as the global geopolitics reach a “temporary lull”, the following ETFs will be launched
Solana ETF is the most likely to be the next one (but there are at least 2 coins more on the list, which we will talk about in the coming days)
🪙 So, are you ready to buy CRYPTOCAP:SOL in your investment portfolio? For example, in the range of $117-123
🤖 Maybe we need to launch a long trading bot OKX:SOLUSDT so that it can buy in micro portions on the current possible price correction to get a “tasty price” as a result
◆ Would you like to join such a trading bot and copy them?
◆ And then compare the results with all “ETF candidates”
_____________________
Did you like our analysis? Leave a comment, like, and follow to get more

ETH/USDT | ETH Weekly Setup – Strong Demand Pushes Toward $6K!By analyzing the Ethereum chart on the weekly timeframe, we can see that after entering the $3,800 demand zone, ETH gained strong buying pressure and reached the $4,200 and $4,600 targets.
Currently, Ethereum is trading around $4,500, up about 19%, and I expect further bullish movement soon. The next upside targets are $4,950, $5,500, and $6,000.
THE LATEST TA :
Please support me with your likes and comments to motivate me to share more analysis with you and share your opinion about the possible trend of this chart with me !
Best Regards , Arman Shaban
