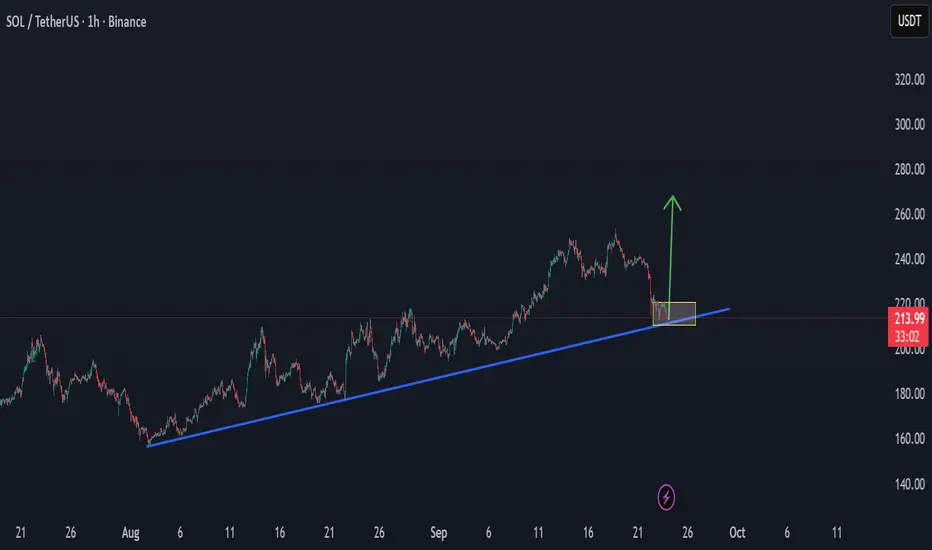
$SOL for Long Monthly ChartThis target will complete in next 1000 Days. Long target for SOL.
Cup & Handle Pattern on Monthly.
Short term
target is 900$
Target 2 is 1200$
Let's go.
Solana

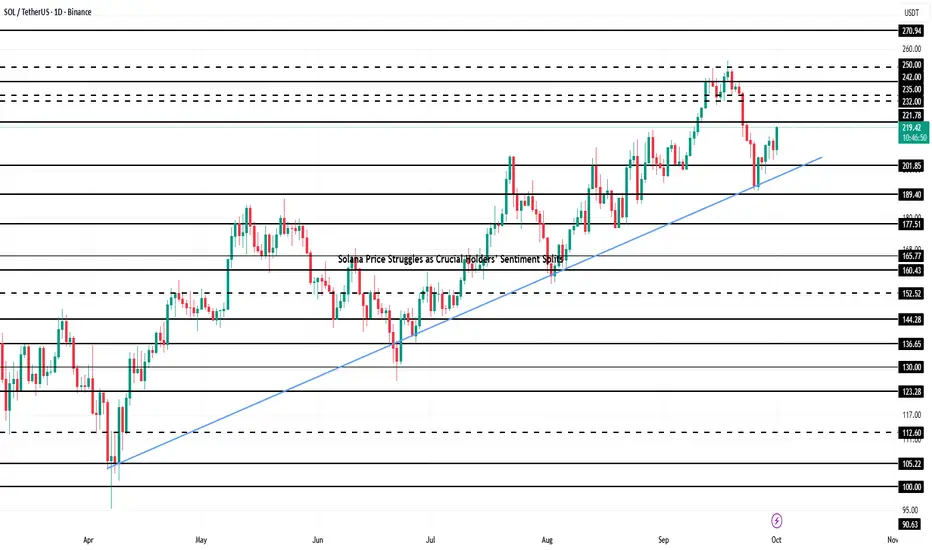
Solana Price Struggles as Crucial Holders’ Sentiment SplitsSolana is trading at $209, holding above the $206 support level and testing its uptrend line. The steady recovery underscores investor commitment to maintaining bullish momentum after brief interruptions caused by increased selling pressure from LTHs.
The mildly bullish outlook could extend Solana’s rally. If momentum holds, SOL could climb past $214 and $221 resistance levels. A push beyond those thresholds would open the path to $232, reinforcing optimism about further gains in the coming weeks.
However, if selling pressure from long-term holders intensifies, Solana risks slipping below $206. A drop to $200 would invalidate the bullish thesis, signaling weakness and potentially sparking renewed bearish sentiment in the altcoin’s market structure.
$PUMP 50% Gann Retrace - Primed for Next Leg UpBack in on the NYSE:PUMP trade 🚀
Had a full 50% retrace on its CRYPTOCAP:SOL pair which should be enough ammo for the next leg higher.
Need to have several daily closes above the 20MA for confirmation.
*NOTE* I'm only trading SPL pairs rn. This way I can maintain constant exposure to SOL even if my bids do not hit and minimize the downside.

WIF back to $3Complete look at Dog WIF Hat
We had some pretty nice technical setups on this meme.
#HVF
#DoubleTop
#InverseHeadandShoulders
#BullFlag
Currently it has two active patterns ...

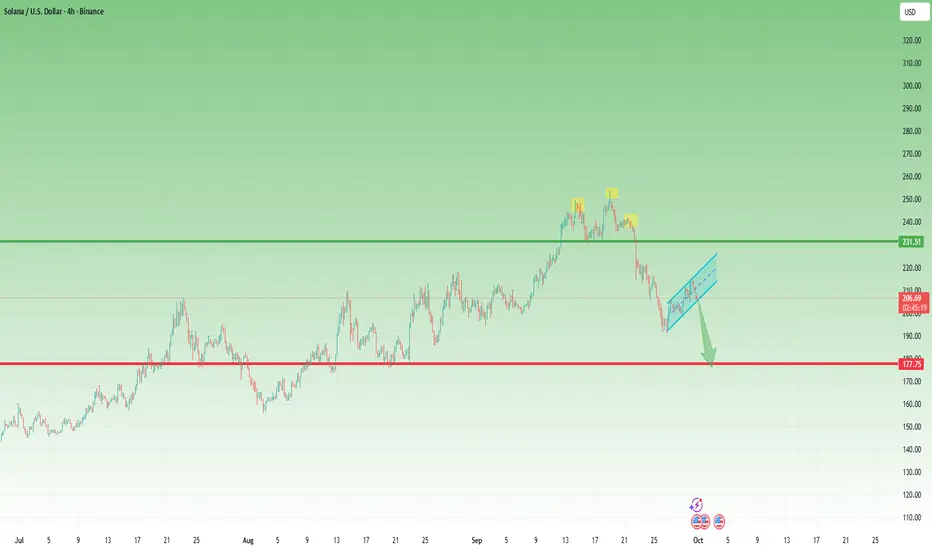
Solana: From 254 Highs Back to the 200 Line – What’s Next?At the end of August, I wrote that as long as 190 remained intact, Solana had room to rise toward 250, and I suggested a buy around the 200 level. That trade worked beautifully, with price reaching as high as 254.
From there, Solana started to roll over. At first, it looked like a normal correction, but the picture changed after a weak bounce attempt. Price broke decisively below 230, and the recent low was set right back at 190.
Currently, Solana is recovering once again. However, the structure of this bounce looks corrective in nature, forming what appears to be a bearish flag.
🔑 Key levels to watch:
• A break below the flag’s support – and more importantly below 200 – would likely trigger another leg down.
• In that case, the market could head toward a 175–180 major support zone, which is the next critical area for buyers to defend.
Until then, the bias remains cautious: Solana must prove it can break free from the corrective structure before bulls can regain control. 🚀
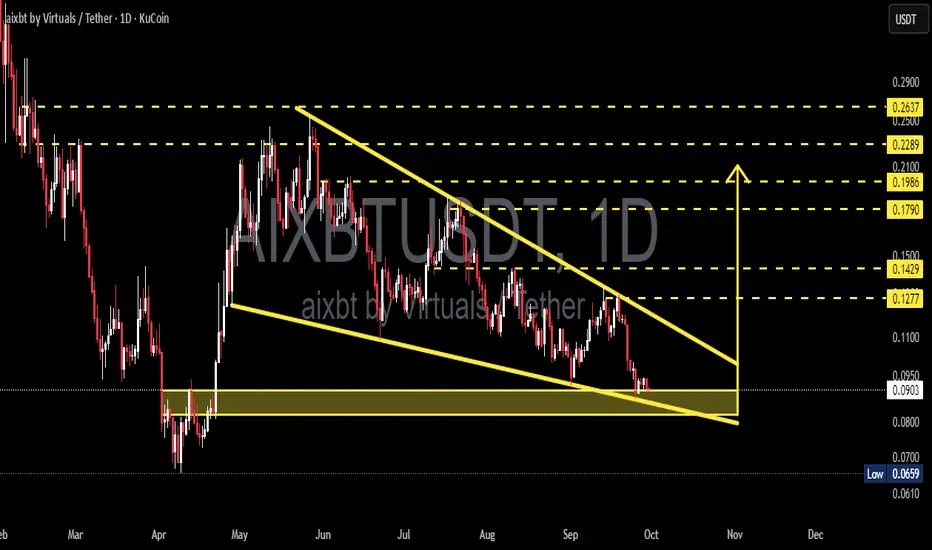
AIXBTUSDT — Falling Wedge at Demand Zone: Reversal or Breakdown?Analysis
AIXBT/USDT is currently trading within a Falling Wedge pattern on the daily timeframe, a classic setup that often signals a potential bullish reversal if confirmed by an upside breakout.
Right now, price is sitting exactly at the 0.08–0.09 demand zone, a key support area that has held multiple times before. This makes the current level a critical decision point: will we see a strong rebound (bullish reversal) or a breakdown to new lows?
---
Technical Structure
Main Pattern: Falling Wedge → generally bullish once a breakout occurs.
Key Demand Zone: 0.08–0.09 (currently being tested).
Next Major Support if Breakdown: 0.0659 (previous swing low).
Resistance / Upside Targets:
0.1277
0.1429
0.1790
0.1986
0.2289
0.2637
---
Bullish Scenario
Price holds above 0.08–0.09 and forms a reversal candle (hammer, bullish engulfing, pin bar).
Breakout confirmed with a daily close above the wedge trendline + rising volume.
Upside targets: 0.1277 → 0.1429 → 0.1790, with further extension possible toward 0.1986–0.2289.
Example aggressive setup:
Entry ~0.085, Stop ~0.078.
First target 0.1277 → offering R:R above 5, attractive for swing traders.
---
Bearish Scenario
A daily close below 0.08 invalidates the demand zone.
Breakdown opens the path to 0.0659 as the first target.
If that fails, the psychological level around 0.05 becomes the next liquidity zone.
Example short setup (margin traders only): Entry 0.079, Stop 0.088, Target 0.0659 → R:R ~1.4.
---
Falling Wedge Insight
This wedge reflects weakening selling pressure, with lower highs and lower lows converging toward the apex. Often, such setups resolve with a strong move upward, especially after prolonged downtrends. However, traders should beware of false breakouts — confirmation via daily close + volume + successful retest is essential before scaling into larger positions.
---
Strategy & Risk Management
Aggressive: Buy within 0.08–0.09 demand zone with a tight stop below 0.078.
Conservative: Wait for a confirmed breakout above the wedge (~>0.13) and enter on retest.
Risk management: Limit exposure to 1–3% per trade; scale out profits at resistance levels.
Note: Low-cap altcoins can be volatile with wide spreads — use limit orders and watch liquidity closely.
---
Conclusion
AIXBT/USDT is at a critical inflection point. With a falling wedge pattern and price sitting right inside the 0.08–0.09 demand zone, the market is preparing for a decisive move.
If support holds: strong chance of reversal toward higher resistances.
If support breaks: expect deeper correction to 0.0659 or lower.
In short, AIXBT is not in ordinary sideways action — it’s at a crossroads where the next move could define its medium-term trend.
---
#AIXBT #AIXBTUSDT #Crypto #Altcoin #TechnicalAnalysis #FallingWedge #Support #Breakout #BullishScenario #BearishScenario #RiskManagement
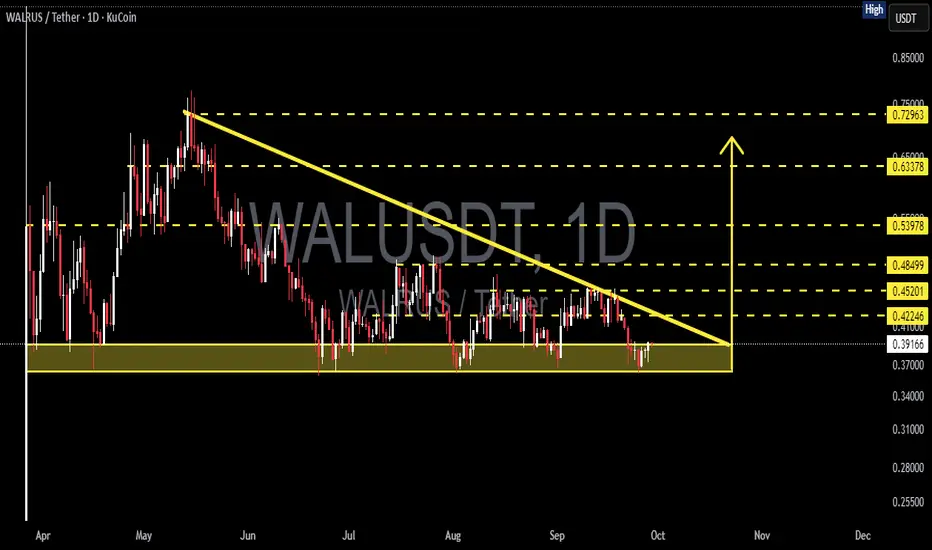
WALRUS/USDT – Descending Triangle at Critical Support!WALRUS/USDT is currently trading within a descending triangle pattern on the daily timeframe. This structure is formed by a series of lower highs pressing from above (descending trendline), while the 0.36–0.40 support zone (yellow box) acts as a major floor below.
This highlights strong selling pressure from the top, but at the same time buyers are still holding the support area. The price is now consolidating within a narrowing range, waiting for a decisive breakout that will dictate the next big move.
---
Bullish Scenario (Upside Breakout)
If WALRUS can break above the descending trendline with a daily close above 0.422–0.452, this descending triangle may flip into a bullish reversal. That would signal buyers regaining control.
Bullish Targets:
Target 1: 0.485
Target 2: 0.539
Target 3: 0.633 – 0.729 (if momentum continues strongly)
Validation: breakout with high volume + successful retest of breakout level as support.
---
Bearish Scenario (Downside Breakdown)
If WALRUS closes daily below 0.36, the descending triangle will confirm as a bearish continuation. This shows sellers overwhelming buyers at support.
Bearish Targets:
Target 1: 0.31 – 0.30
Target 2: 0.255 (long-term demand zone)
Validation: strong bearish daily close with volume, without quick recovery above 0.36.
---
Pattern & Interpretation
The descending triangle often acts as a bearish continuation pattern.
But in strong support zones, it can turn into a reversal pattern if an upside breakout occurs.
WALRUS is at a decision point: the tighter the consolidation, the bigger the potential explosive move once a breakout happens.
---
Conclusion
Bias: Neutral → Bearish as long as WALRUS remains below the descending trendline.
Bullish confirmation: daily close above 0.422–0.452 → potential rally to 0.485 – 0.539.
Bearish confirmation: daily close below 0.36 → possible drop to 0.31 and 0.255.
Traders should wait for volume-backed breakout confirmation before positioning. WALRUS is now at a make-or-break level: will it bounce or break?
---
#WALRUS #WALRUSUSDT #CryptoAnalysis #TechnicalAnalysis #DescendingTriangle #Breakout #SupportResistance #PriceAction
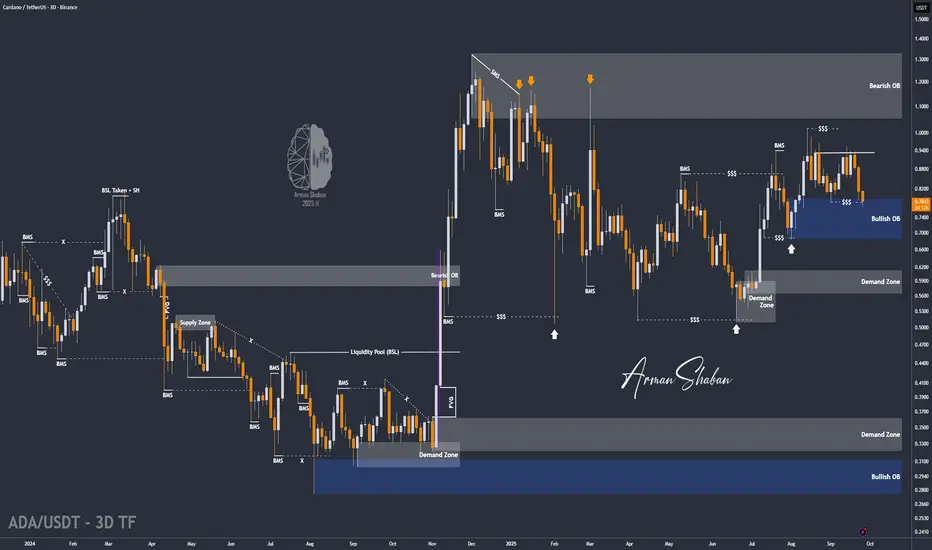
ADA/USDT | ADA Testing $0.68–$0.78 Demand – Next Pump Ahead?By analyzing the Cardano (ADA) chart on the 3-day timeframe, we can see that the price started correcting as expected and has now reached $0.78, entering the key $0.68–$0.78 demand zone. Now we need to see whether this zone can stop ADA from dropping further.
If the price holds in this strong demand area, we could expect a big bullish move. The short-term targets are $0.85, $0.95, and $1.00, while the mid-term targets are $1.05, $1.17, and $1.33.
Please support me with your likes and comments to motivate me to share more analysis with you and share your opinion about the possible trend of this chart with me !
Best Regards , Arman Shaban
MUBARAK/USDT — Confluence Accumulation Zone?🔎 Overview
MUBARAK/USDT is currently testing the critical support zone (0.022 – 0.028 USDT), which aligns with a medium-term ascending trendline. This confluence makes the area a decisive “do or die” zone: either a strong rebound that may trigger a reversal, or a confirmed breakdown that could push prices much lower.
---
📍 Key Technical Levels
Current Price: ≈ 0.0298
Main Support Zone (yellow box): 0.022 – 0.028
Critical invalidation support: 0.0208
Resistances:
R1 = 0.03862
R2 = 0.04299
R3 = 0.04999
R4 = 0.06630
---
🧩 Structure & Patterns
1. Accumulation zone: price repeatedly bounced within 0.022–0.028, suggesting active buyers.
2. Ascending trendline: supports higher lows on the mid-term structure.
3. Lower highs still dominate → bulls need a breakout above 0.0386 to flip the structure.
4. Potential double bottom: a strong rejection here could mark a classic bullish reversal.
5. Breakdown scenario: a daily close below 0.022 with volume = bearish continuation toward 0.0208 → 0.0164.
---
🚀 Bullish Scenario
Confirmation signals:
Strong rejection candle (long lower wick + close above zone).
Volume expansion.
Daily close above 0.0386.
Upside targets:
TP1 = 0.03862
TP2 = 0.04299
TP3 = 0.04999
TP4 = 0.06630
Strategy:
Conservative entry on retest after rejection.
SL below 0.0208.
Scale out profits gradually.
---
⚠️ Bearish Scenario
Confirmation signals:
Daily close below 0.022 with strong volume.
Failed retest (support turns resistance).
Downside targets:
S1 = 0.02080
S2 = 0.01640
Strategy:
Cut longs if breakdown is confirmed.
Aggressive traders may short toward 0.0208 → 0.0164.
---
📑 Entry Checklist
1. Wait for daily close confirmation (not intraday wick).
2. Volume above average.
3. Successful retest (support ↔ resistance flip).
4. RSI divergence or recovery.
5. MACD bullish cross / rising histogram.
6. BTC & overall altcoin sentiment aligned.
---
🛡️ Risk Management
Risk per trade: 1–2% of total capital.
Use SL strictly below 0.0208 for longs.
Move SL to breakeven after TP1.
Accumulation zones often produce false breaks → do not enter without confirmation.
---
🌍 Market Context
Altcoins remain correlated with BTC: a BTC rebound could boost upside potential.
On-chain events (token unlocks, listings, or major news) may drive volatility.
Liquidity is thin → expect high volatility and manage position sizes accordingly.
---
📌 Conclusion
MUBARAK is at a golden zone of decision: a confirmed rejection could spark a +100% rally toward 0.066, while a breakdown would likely drag it back to 0.0208 or even 0.0164.
This is where market makers and big players decide the next major move — patience and risk control are key.
---
#MUBARAK #MUBARAKUSDT #CryptoAnalysis #Altcoins #SupportResistance #BreakoutWatch #RiskManagement

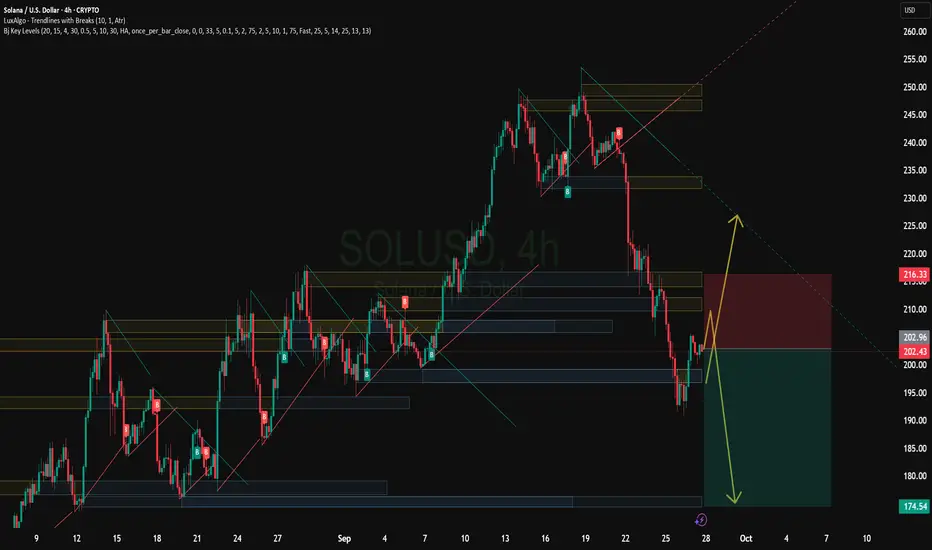
Solana Weekly Forecast and ScenariosWeekly Forecast and Scenarios
Bullish scenario: SOL holds support near $200–$210 and breaks through the $245–$250 zone, leading to a directional move toward $270 and beyond (even to $300).
Consolidation: The price may fluctuate within the $200–$245 range, awaiting volume and news, without a clear trend.
Bearish scenario: A breakout from the support range (below ~$188–$200) could lead to a pullback to lower levels of $170–$180.
SOLUSDT 1D - Bulls back in control with Golden Cross and channelOn the daily chart, SOLUSDT is forming a bullish continuation structure. After the Golden Cross (MA50 crossing MA200), the price is now pulling back toward the midline of the ascending channel and the 0.5 Fibonacci level at 166.38. This confluence with the broken trendline and 200 EMA makes this zone a prime technical area of interest.
Support: 166.38 (0.5 Fibo), EMA200 (161.77), broken trendline
Resistance: 182.84–189.67 (Fibo 0.705–0.79), 206.54, target - 255.93 (Fibo 1.618)
This retracement looks healthy, supported by higher volume during the prior bullish leg. As long as the 166.38–161.77 zone holds, continuation toward 206.54 and potentially 255.93 is on the table.
Fundamentally, Solana remains a key L1 narrative with strong traction in DePIN and AI-linked dApps. The rising TVL and investor sentiment support the trend.
Watch price action around 166 for confirmation - this is the battleground.

Is the SUI / SOL ratio forming a cup and Handle?Key Takeaways of a Cup and Handle:
The cup and handle pattern represents a bullish technical price formation that manifests on a price chart as a cup accompanied by a handle, indicating a possible buying opportunity.
This pattern generally develops over a span of seven to 65 weeks and is defined by a "U" shaped cup followed by a handle that slopes downward.
In order to trade the cup and handle pattern, traders may opt to place a stop buy order just above the upper trend line of the handle or wait for the price to close above it, establishing a profit target based on the height of the cup.
Instances such as Wynn Resorts illustrate how a properly formed cup and handle pattern can lead to substantial price movement once the pattern is validated and the resistance level is breached.
However, limitations include the duration required for the pattern to form and the variability in the depth of the cup, necessitating its use in conjunction with other signals and indicators.

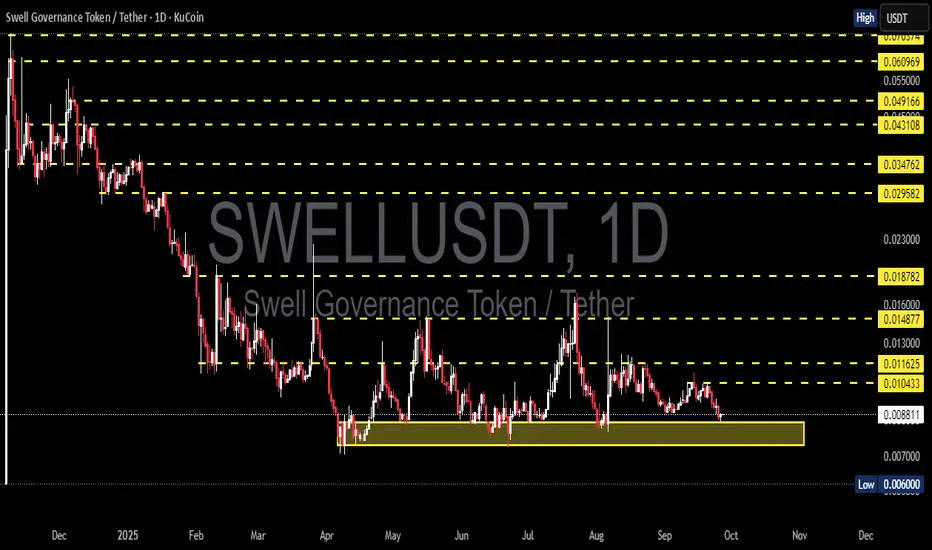
SWELL/USDT – Key Demand Zone: Relief Rally or Breakdown?Full Analysis
SWELL is currently at a critical juncture. After a prolonged downtrend since early 2025, the price has shifted into a range-bound structure, with a strong demand zone around 0.0060 – 0.0088 (highlighted in yellow).
This zone has been tested multiple times over the past few months, suggesting that buyers—potentially whales or institutions—are defending it. However, the more a support level is tested, the weaker it often becomes, raising the stakes for what comes next.
---
Structure & Price Pattern
Primary trend: bearish since the start of the year, but the momentum of the decline has slowed since Q2 → forming a range market.
Current pattern: multi-touch support combined with lower highs on the upside → signaling a phase of accumulation or distribution.
Key levels:
Support zone: 0.0060 – 0.0088.
Resistance layers: 0.0104 → 0.0116 → 0.0149 → 0.0187.
If the support zone holds, the probability of a relief rally is high. If it breaks, we could see a new capitulation phase.
---
Bullish Scenario
1. Bounce from demand zone
Confirmation: a strong daily rejection candle (hammer / bullish engulfing) with rising volume.
Short-term target: 0.0104 – 0.0116.
Extended targets: 0.0149 – 0.0187 if a breakout gains traction.
Upside potential: +30% to +100% from current levels.
2. Structural breakout
If price closes above 0.0116 on the daily chart, structure shifts into a higher-high formation.
This would significantly increase the probability of a larger bullish leg.
---
Bearish Scenario
1. Support breakdown
If the daily close falls below 0.0060, the demand zone will have failed.
This could trigger another strong sell-off and force the price to search for lower support levels.
Downside potential: at least -30% from current price, possibly more under heavy selling pressure.
---
Implications for Traders
Aggressive traders may consider entering within the demand zone with a tight stop-loss just below 0.0059. High risk, but potentially high reward if the bounce materializes.
Conservative traders should wait for a confirmed breakout above 0.0116, then enter on the retest. This approach provides a clearer bullish structure and better confirmation.
Risk management is critical here—SWELL is a small-cap altcoin with high volatility.
---
Conclusion
SWELL/USDT is standing at a major decision point. The 0.0060–0.0088 demand zone is the battlefield where the next trend direction will be decided—whether we see a relief rally toward higher resistances or a bearish breakdown into uncharted territory.
For traders, this is the time to stay patient and wait for confirmation: watch daily candle closes, volume spikes, and market reactions around this zone before making a move.
---
#SWELL #SWELLUSDT #CryptoAnalysis #Altcoin #TradingView #PriceAction #SupportResistance #Breakout #CryptoTrading #TechnicalAnalysis
PYR/USDT — Critical Zone: Accumulation for Rebound or Breakdown?PYR/USDT is now trading at a critical decision zone. After a prolonged downtrend since late 2024, the price has been consolidating inside the demand zone at 0.78 – 0.98 USDT. This area has repeatedly acted as a strong foundation to prevent deeper declines. With multiple retests, the market is approaching a tipping point: will PYR stage a significant rebound or break down into new lows?
---
🔎 Market Structure & Price Pattern
Long-Term Trend: Bearish, characterized by sharp declines and a series of lower highs since early 2025.
Mid-Term Trend: Sideways / Range-bound, with the lower boundary at 0.78–0.98 and upper boundary near 1.38.
Pattern Observed:
Potential Double/Triple Bottom formation at major support. If confirmed, this could signal accumulation before a trend reversal.
Failure to hold this zone, however, would turn the structure into a distribution breakdown, triggering new selling pressure.
---
📈 Bullish Scenario (Rebound Potential)
1. Price holds above 0.78 – 0.98 with a clear bullish reversal candle (engulfing / hammer / piercing line) on the daily timeframe.
2. Additional confirmation if daily close sustains above 1.045.
3. Step-by-step upside targets:
🎯 T1 = 1.181
🎯 T2 = 1.382
🎯 T3 = 2.148 (major mid-term resistance)
🎯 T4 = 2.592 – 3.458 if momentum extends further.
4. Bullish structure strengthens once a higher low forms after the rebound.
---
📉 Bearish Scenario (Breakdown Potential)
1. Price fails to hold and closes daily candle below 0.78.
2. A retest of the 0.78–0.98 zone as new resistance would confirm the bearish bias.
3. Downside targets:
⚠️ 0.60 (psychological support)
⚠️ 0.45 – 0.40 (deeper historical demand zone)
4. Such a breakdown will likely be accompanied by heavy sell volume, signaling panic selling and loss of key support.
---
📌 Conclusion & Strategy
The 0.78–0.98 zone is the golden decision point for PYR.
Bullish case: wait for a confirmed breakout above 1.045, with targets at 1.18–1.38.
Bearish case: breakdown below 0.78 opens room for a deeper sell-off.
Best strategy: stay patient, wait for confirmation, and let price action decide whether this zone becomes an accumulation base or a distribution top.
#PYR #PYRUSDT #CryptoAnalysis #Altcoin #SupportResistance #DemandZone #CryptoTrading #TechnicalAnalysis

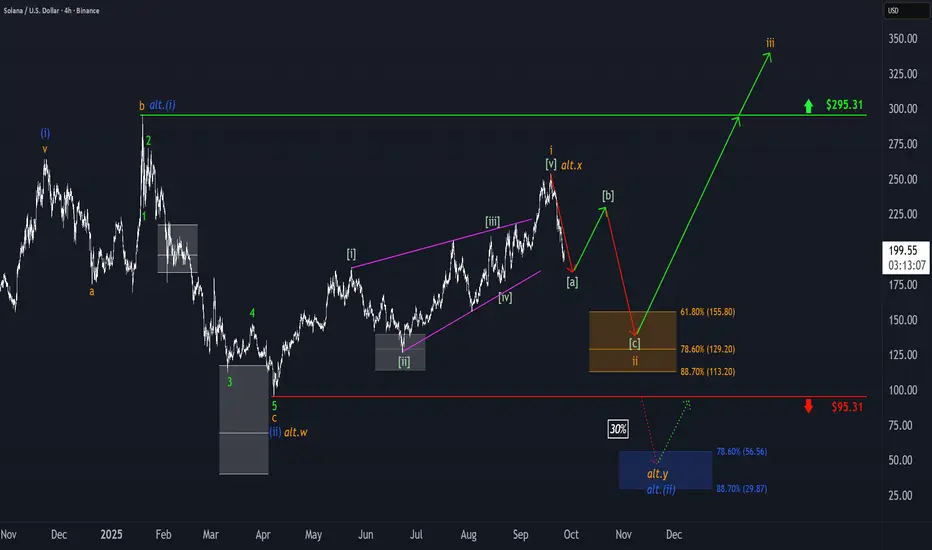
Solana: Target Zone in FocusSOL has dropped more than 20% from last Thursday’s high. In light of this, we now believe that last week’s high—reached on Thursday—marked the top of wave i in orange, and that price is currently undergoing a wave ii corrective phase. This correction should play out as a downward, three-part move labeled - - in green, ultimately targeting our orange zone between $155.80 and $113.20. We expect the low of this wave ii to occur within that Target Zone, which should set the stage for a bullish reversal. The following wave iii in orange is projected to push SOL to new all-time highs, breaking through resistance at $295.31.
Solana's oversold RSI. Major upward move ahead.Solana Fibonacci .618 retracement resets RSI to oversold, which signals a major move ahead.
A major move would also coincide with the upcoming major ETF approval on October 10.

Solana coin up another 60% Whats next In this video I recap our previous video calling for a pullback into $150 with a target of $240 which has now been fulfilled .
The question is whats next from $240, we are top heavy and despite market structure still bullish I anticipate a move up to fill the single prints at $245/250 before a healthy pull back into $200 zone .
I also recap Bitcoin and the ETH /BTC pair
Take the trades level by level and plan ahead . Enjoy

ETH/USDT | Correction Over? Big Rally Loading After Demand ZoneBy analyzing the Ethereum chart on the weekly timeframe, we can see that after Bitcoin’s heavy dump , ETH also corrected and is now trading around $4,200 .
Based on the previous analysis, the $3,300–$3,900 zone is still a key demand area. If the price enters this zone, I expect Ethereum to start its next bullish wave.
The possible upside targets for this rally are $5,100, $5,500, and $6,000.
Please support me with your likes and comments to motivate me to share more analysis with you and share your opinion about the possible trend of this chart with me !
Best Regards , Arman Shaban
solana to the depthsthere is a scenario where we could go for an sfp, but there have been many within this higher time frame one, so not sure if it'll come again before heading lower

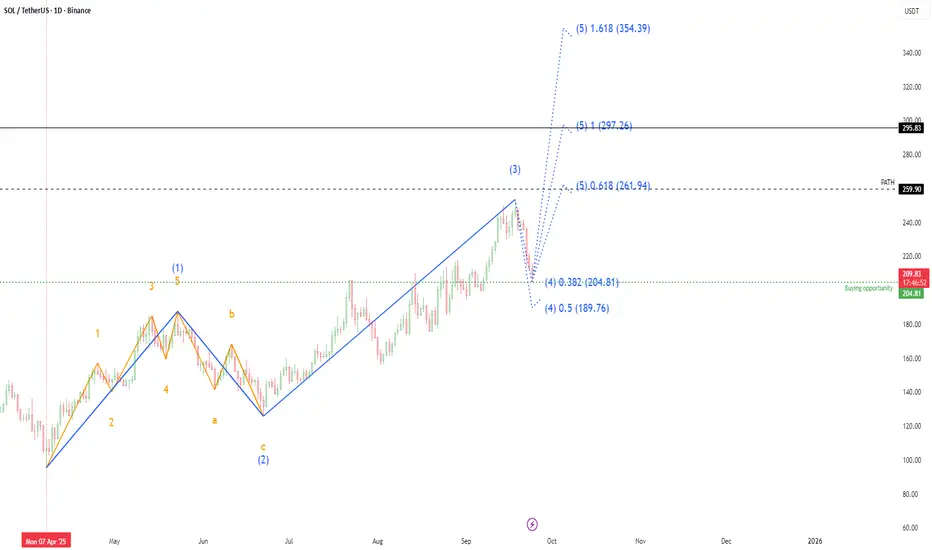
Solana - Elliott Wave Analysis Based on Elliott Wave Theory, Solana appears to be completing Corrective Wave 4, with a potential buying opportunity in the $189 – $204 range. The market structure suggests the development of Impulse Wave 5, which is becoming increasingly evident on the daily chart.
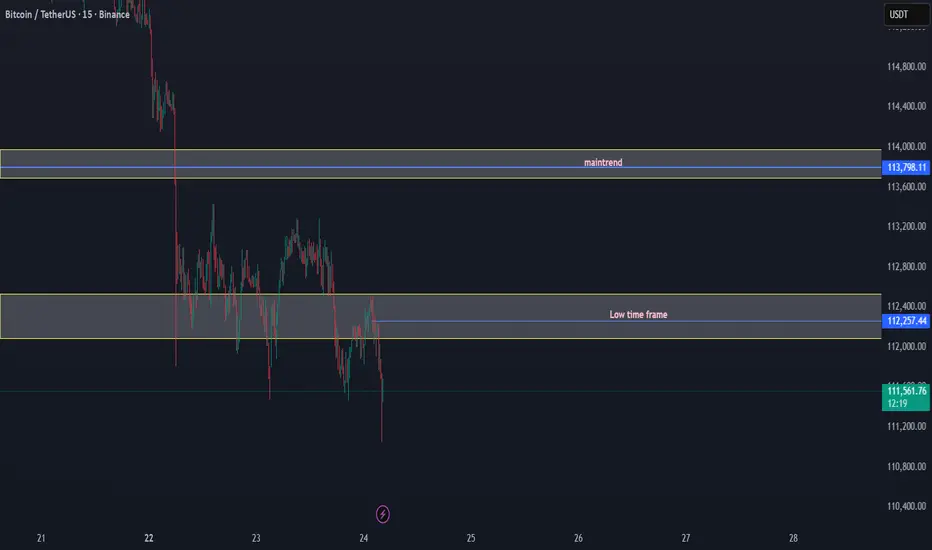
BTC/USDT Breakdown: Loss of Key Levels Confirms Bearish Structur📉 BTC/USDT Market Update
Bitcoin has broken down key structural levels, confirming a bearish outlook in the short to mid-term.
✅ Low Time Frame Support Lost: The $112,083 – $112,531 demand zone has failed to hold, indicating that buyers are losing control on lower time frames.
✅ Main Trend Zone Rejected: The $113,798 – $114,000 supply area acted as strong resistance, and BTC was unable to reclaim this key trend level.
✅ Momentum: Current price action shows continuation to the downside, with sellers stepping in aggressively after repeated failed attempts to sustain higher levels.
Bias: Bearish
As long as BTC trades below $113,800, the market structure favors sellers. Further downside pressure may target the $111,000 – $110,800 range in the near term.
⚠️ Key Levels to Watch:
Resistance: $113,800 – $114,000 (Main trend rejection zone)
Support: $111,000 – $110,800 (Next liquidity pool)
Solana - The sleeping giant waking up!🔦Solana ( CRYPTO:SOLUSD ) will still head higher:
🔎Analysis summary:
Yes, over the past four years, Solana has overall been just consolidating. But eventually, Solana will catch up with the entire crypto market and create a new all time high. Specifically with bulls picking up momentum lately, it becomes more and more likely that Solana will do exactly that.
📝Levels to watch:
$250
SwingTraderPhil
SwingTrading.Simplified. | Investing.Simplified. | #LONGTERMVISION

SOLANA can hold the cycle trend to up $250Solana is now at an important level of trend, and can hold in the coming time the cycle key level for a new power trend increase to up $250 in the coming time.
On the low time frame $220 can be the next target, when BTC has a stability trend or an increase trend.