BNB/USDT | BNB Bull Run Continues – No Signs of Correction Yet!By analyzing the Binance Coin (BNB) chart on the weekly (logarithmic) timeframe, we can see that the price has set a new ATH above $1,000. Since the last time I analyzed BNB — over 2 years ago — the price has increased by more than 400%!
Currently, BNB is trading around $1,060, and there are still no signs of a correction on the chart. With the current momentum, I expect further growth, possibly pushing the price to levels above $1,200. This analysis will be updated again!
Please support me with your likes and comments to motivate me to share more analysis with you and share your opinion about the possible trend of this chart with me !
Best Regards , Arman Shaban
Solana

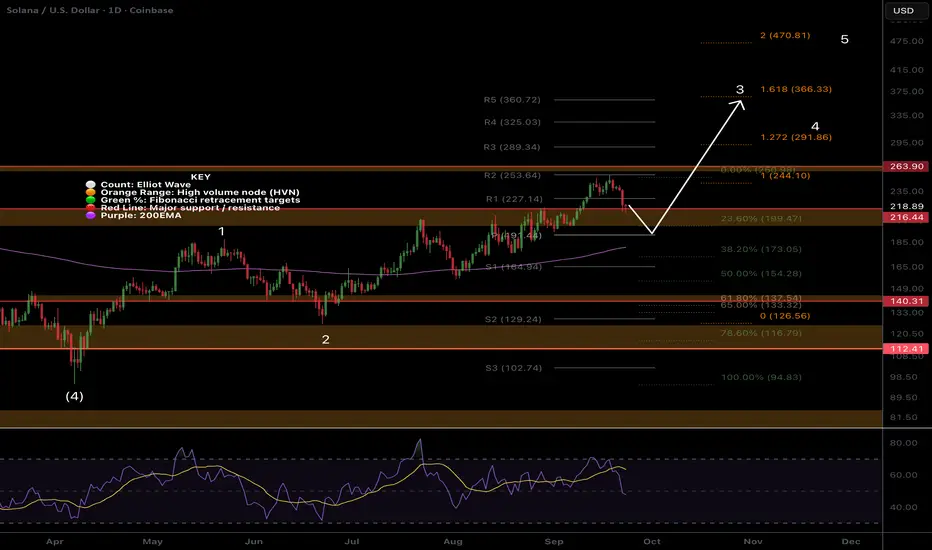
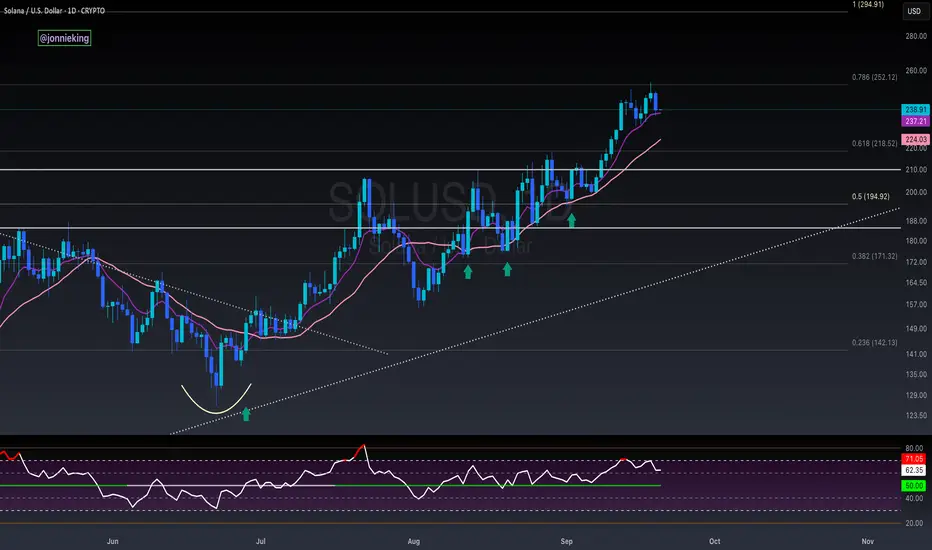
SOL Rejected at all time high! Whats next?Local Analysis / Targets / Elliot Wave
Solana attempted to break into price discovery but was rejected harshly back to the High Volume Node support trapping new traders and investors with the all time high excitement. Wave 3 appears to be underway with a minimum target of $365 the 1.618 Fibonacci extension and R5 daily pivot. Wave 3 pull backs should be shallow.
Continued downside bring up the ascending daily 200EMA and 0.382 target of $173. RSI is at the EQ and crossed bearishly.
Standard Deviation Band Analysis
Solana continues in the expected range just above fair value. Its attempts to break through the SD+2 threshold continue to thwarted but the next attempt will be number 4, the higher probability breakout!
Safe trading
SOL/USDT: Pullback Toward Key Confluence Zone After Double TopSOL/USDT is currently retracing from the 250 resistance zone after forming a double top pattern, signaling near-term weakness. On the 4H chart, an upward channel intersects with a downward trendline, creating a critical confluence area between 200 and 210.
If the price rebounds from this zone, buyers may attempt a retest of 230, with potential to extend the move higher. The broader bullish structure remains intact as long as support at 200 holds, keeping the upside momentum in play

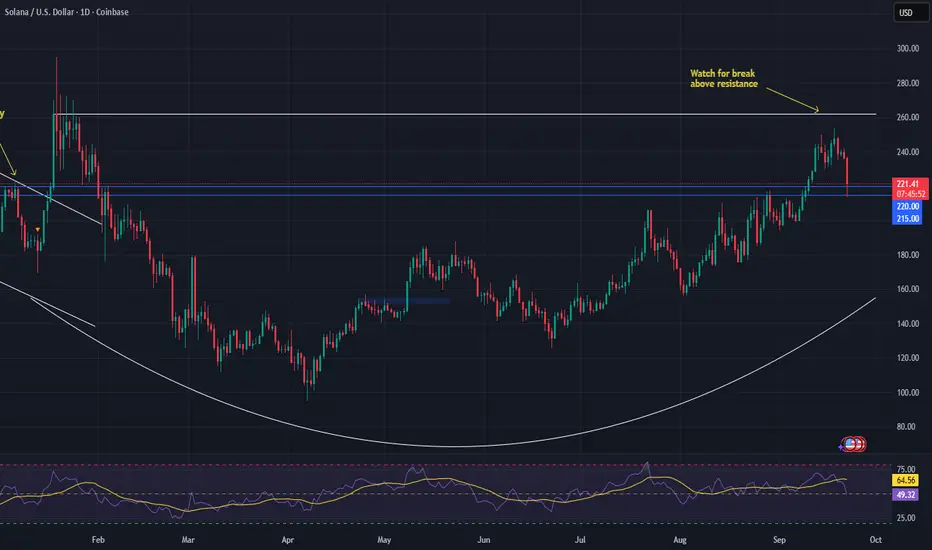
SOLANA (SOL) – Major Breakout Setup BrewingSolana is showing one of the cleanest technical setups in the DeFi space right now. The daily chart reveals a textbook saucer formation, a pattern that often precedes strong upside moves.
🔍 Key Levels to Watch:
• Support: $215–$220 – This zone must hold to keep the bullish structure intact.
• Breakout Zone: $250–$260 – A close above this range confirms the saucer breakout.
• Target: $480–$500 – Based on the pattern’s depth and duration.
The path of least resistance is up, and with altcoin sentiment turning bullish again, this could be a precursor to alt season.
📈 Monitoring closely for a confirmed breakout.
#Solana #SOL #Altcoins #CryptoTrading #DeFi #ChartPatterns #TechnicalAnalysis #CryptoSetup #Altseason
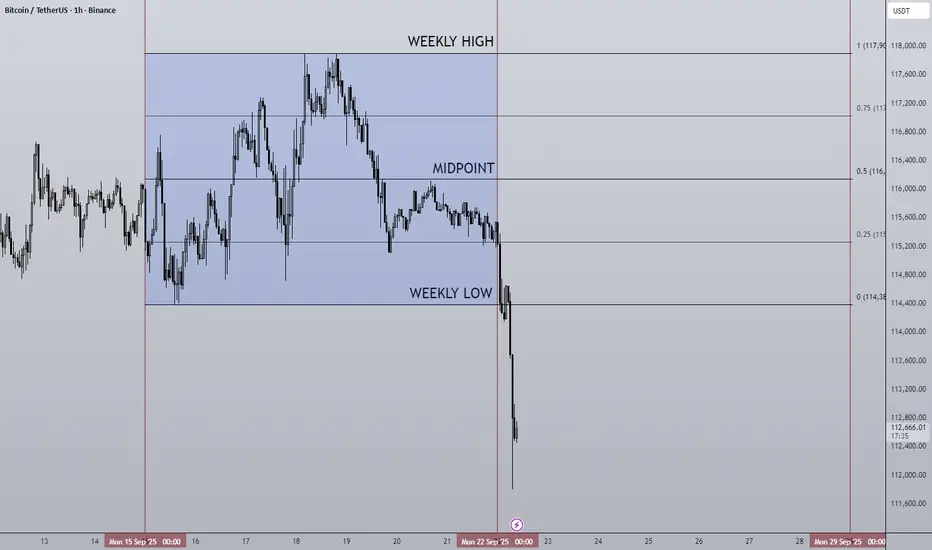
22/09/25 Weekly OutlookLast weeks high: $117,904.04
Last weeks low: $114,383.99
Midpoint: $116,144.01
A very interesting start to the week to say the least! In the opening hours of this week BTC has plunged 3% to tag $112,000, this comes off the rejection of $117,500 key level post FOMC.
The FED cut interest rates by 25bps as was expected by most, the resulting rally failed to break $117,500 resistance and rejected back to the origin of the rally at the 0.25 line. The dip from the opening hours of this week is in my opinion continuation of this rejection level. It is clear the bulls still don't have the firepower to break the range and push on, the question this week is where will BTC find support?
For me there are some key levels, 1D 200 EMA is still an option at $106,000, the daily local how at $107,500 could provide double bottom support. The Monday close will provide more context to this move, should the reaction be minimal and the daily candle closes as it is now the September curse could continue.
This week I'll be closely monitoring how altcoins react to this move, I believe the general consensus is that altcoins will outperform BTC in Q4. Historically the final quarter of the year has provided some great returns over the years, however that does not necessarily mean that will be the case this time around. If it does happen this dip may provide some good entries.
Good luck this week everybody!
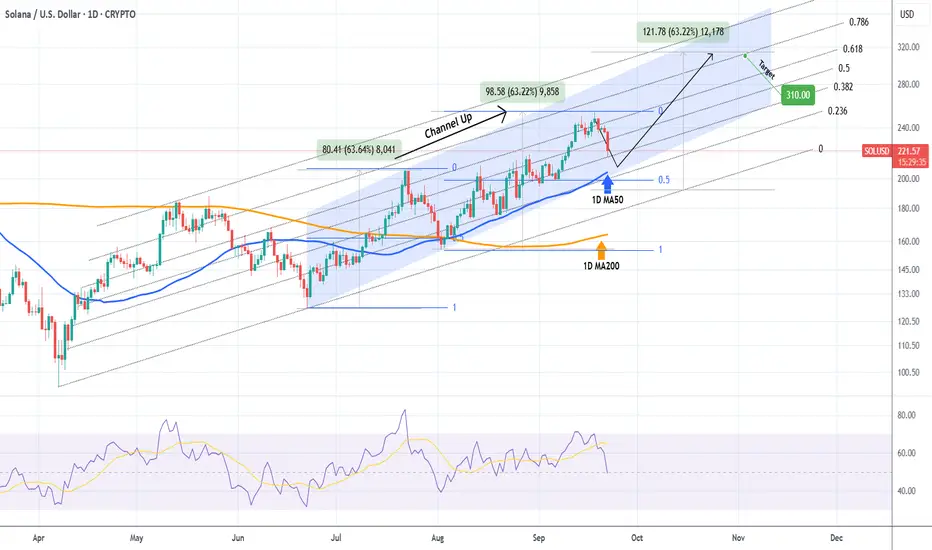
SOLANA Is a 1D MA50 pull-back needed for a $310 rally?Solana (SOLUSD) has been trading within a Channel Up since the June 22 Low, which goes even further back on a Fibonacci Channel Up started on the April 07 market bottom.
The price is pulling back at the moment, having completed a +63.22% Bullish Leg, same as the previous one that then pulled back to its 1D MA50 (blue trend-line) and 0.5 Fibonacci retracement level before starting the next Bullish Leg.
As a result, we expect the current correction so seek validation on the 1D MA50 at least and then rebound for a medium-term +63.22% rally, targeting $310 at least.
-------------------------------------------------------------------------------
** Please LIKE 👍, FOLLOW ✅, SHARE 🙌 and COMMENT ✍ if you enjoy this idea! Also share your ideas and charts in the comments section below! This is best way to keep it relevant, support us, keep the content here free and allow the idea to reach as many people as possible. **
-------------------------------------------------------------------------------
💸💸💸💸💸💸
👇 👇 👇 👇 👇 👇
LTC/USDT | Litecoin Consolidating – Can Bulls Smash $150 RSTNCE!By analyzing the Litecoin (LTC) chart on the weekly (logarithmic) timeframe, we can see that after our last analysis, the price successfully reached the targets at $92.5 and $115. Currently, it is trading around $115.
The price now faces a strong resistance zone between $120–$150. Litecoin is consolidating and building enough momentum to attempt a strong breakout of this zone. If it manages to break through, the next bullish targets will be $155, $200, and $268.
Please support me with your likes and comments to motivate me to share more analysis with you and share your opinion about the possible trend of this chart with me !
Best Regards , Arman Shaban

WLFI/USDT — Ascending Triangle Pressing: Major Breakout?📊 Full Analysis
The WLFI/USDT pair on the 4-hour timeframe is forming a clear Ascending Triangle pattern:
A strong horizontal resistance around 0.2410, repeatedly tested but not yet broken.
Higher Lows along the ascending trendline (yellow) show growing buyer strength and continuous accumulation.
This structure is a classic bullish continuation pattern, signaling that the market is building momentum for a potential breakout.
Still, crypto markets are never one-sided. Failure to break higher could lead to a sharp rejection or even a breakdown.
---
🟢 Bullish Scenario
1. A valid breakout occurs if the 4H candle closes above 0.2410–0.245 with strong volume.
2. If confirmed, upside targets based on the measured move are:
Conservative target: 0.28 – 0.30
Full measured move: 0.30 – 0.32
3. Watch for a possible retest of 0.241 as new support. A successful retest bounce would reinforce bullish continuation.
---
🔴 Bearish Scenario
1. If the price fails to break 0.2410, a rejection may send it back toward the ascending trendline support.
2. A confirmed breakdown below 0.225–0.228 invalidates the ascending triangle.
3. Bearish downside levels to watch:
First support zone: 0.20
Major support: 0.161 (previous significant low).
---
🎯 Key Levels
Resistance zone: 0.2410 – 0.245
Dynamic trendline support: 0.225 – 0.228
Next supports: 0.20 → 0.161
Bullish targets: 0.28 – 0.32
---
⚖️ Conclusion
WLFI/USDT is at a critical crossroads. The Ascending Triangle signals that buyers are steadily pressuring resistance. A confirmed breakout above 0.2410 with volume could unlock the path toward 0.30–0.32.
However, failure at resistance combined with a trendline breakdown could trigger a correction back to 0.20 or even 0.161.
Best strategy: wait for confirmation (breakout or breakdown), manage risk carefully, and scale out profits at key target levels.
---
#WLFI #WLFIUSDT #Crypto #Altcoin #AscendingTriangle #ChartPattern #Breakout #Bullish #Bearish #SupportResistance #PriceAction #TechnicalAnalysis

BTC/USDT | BTC Correction Done? Next Pump Loading…By analyzing the Bitcoin chart on the 4-hour timeframe, we can see that the price moved higher as expected, reaching around $118,000. After that, Bitcoin corrected down to the $115,000 demand zone. Once it touched this level, demand stepped in again and the price bounced back.
Currently, Bitcoin is trading around $116,000. If the price holds above the $114,400–$115,000 support zone, we can expect the start of another bullish wave.
Please support me with your likes and comments to motivate me to share more analysis with you and share your opinion about the possible trend of this chart with me !
Best Regards , Arman Shaban

MBL/USDT — Descending Triangle: Breakout or Breakdown Ahead?🔎 Detailed Analysis
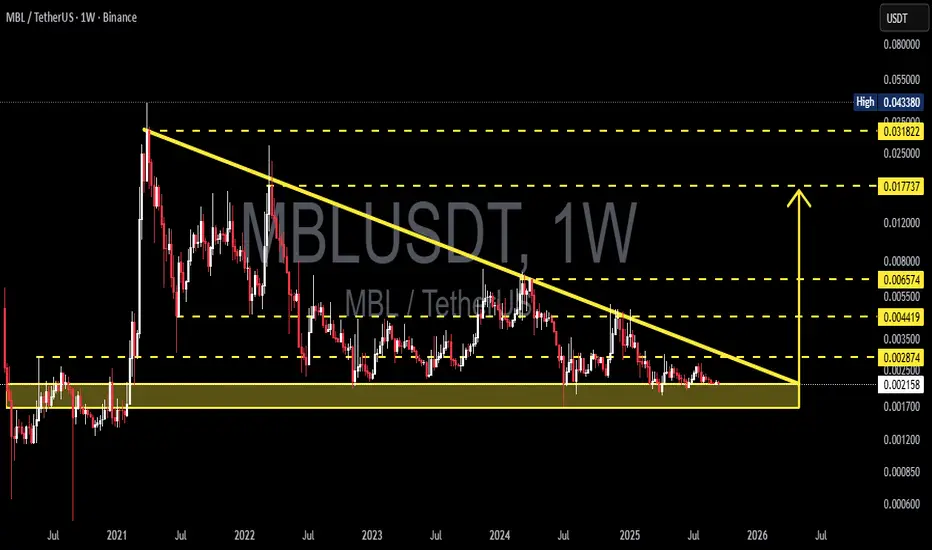
The MBL/USDT pair on the weekly chart is currently in a long-term price compression phase. The structure forms a Descending Triangle, characterized by:
Consistent lower highs along a long-term descending trendline (since 2021).
A strong horizontal support zone at 0.0017 – 0.0023 USDT (yellow box).
Price action consolidating into the triangle apex, suggesting a potential major breakout or breakdown in the coming weeks/months.
This pattern has been building for over 3 years, which makes any confirmed breakout highly significant.
---
📈 Bullish Scenario
Confirmation: A weekly close above the descending trendline and pivot level at 0.002874 USDT, supported by strong volume.
Retest: A successful retest of the breakout level turning into support strengthens the case for upside continuation.
Bullish Targets:
Target 1: 0.004419 USDT (nearest resistance).
Target 2: 0.006574 USDT.
Extended Target: 0.0177 – 0.0318 USDT if broader altcoin momentum strengthens.
✨ If this bullish breakout occurs, it could mark the beginning of a major reversal after years of consolidation.
---
📉 Bearish Scenario
Confirmation: A weekly close below the 0.0017 USDT support zone with strong bearish follow-through.
Implication: A breakdown of this historical support could open the door to much lower levels (sub-0.001), with an extreme projection toward 0.0006 USDT.
Note: Descending triangles often resolve bearishly in textbook cases, but in crypto they can also serve as accumulation zones before explosive rallies.
---
🛡️ Risk Management
Avoid entering positions solely because the price “looks cheap” — wait for clear confirmation.
Always set a Stop Loss below support (for longs) or above invalidation (for shorts).
Manage position sizing carefully → high reward potential but also high risk.
Use indicators (RSI, MACD, Volume) to confirm momentum shifts.
Weekly close is the strongest signal — avoid acting on intraday noise.
---
⏳ Timeframe & Potential
As this is a weekly timeframe pattern, confirmation may take several weeks to months.
The closer price gets to the triangle apex, the more explosive the breakout is likely to be.
Broader altcoin market sentiment will strongly influence which direction this resolves.
---
✨ Conclusion
MBL/USDT is at a critical crossroads:
Holding the 0.0017 – 0.0023 support and breaking the descending trendline could trigger a multi-fold rally.
Losing this support zone could lead to a sharp drop into uncharted sub-0.001 territory.
📍 This setup is highly attractive for swing traders and mid-to-long term investors waiting for a major move after extended consolidation.
---
#MBL #MBLUSDT #Crypto #Altcoins #TechnicalAnalysis #DescendingTriangle #Support #Breakout #Bullish #Bearish
$SOL Maintains Uptrend With Daily CloseIgnore the noise.
CRYPTOCAP:SOL is still very much in an uptrend and has closed the day above the 9EMA.
Bulls need to maintain this, otherwise a retest of the 20MA ~$224 will be retested.
Solana Price Forecast | SOLUSDT Market OutlookSOLUSDT has completed a strong upward cycle and is now unwinding through a structured retracement. This phase is not showing disorderly selling but rather a controlled reset, where liquidity is being cleared to prepare for the next expansion.
The chart reflects a market that is cycling through accumulation, breakout, and pullback phases with consistency. Current downside movement is shaping a foundation zone that could serve as the springboard for renewed upward momentum.
Overall, the asset is displaying a constructive trajectory: corrections are functioning as fuel rather than weakness, pointing toward continuation of its broader growth path once this reset stabilizes.

Signal Breakout as SOL Targets ATH and $300+Solmate’s $300M Launch in the UAE Sparks Solana Treasury Wave: Institutions Signal Breakout as SOL Targets ATH and $300+
The Solana ecosystem is entering a critical new phase of institutional adoption and capital formation, with multiple catalysts converging to form one of the strongest bullish narratives in crypto today. The headline development: Solmate has launched with a $300 million mandate to establish a Solana-focused treasury in the United Arab Emirates. This move, paired with growing institutional interest, potential ETF approvals, and increasingly favorable technicals, has set the stage for a potential breakout rally. Some market participants now see a credible pathway to $300+ for SOL, while others point to new all-time highs as fundamentals and momentum align.
This piece explores the strategic implications of Solmate’s treasury launch, the growing momentum behind Solana among institutions like Forward Industries, the macro tailwinds surrounding ETF approvals, and the technical structure that supports a bullish continuation. We’ll also assess the potential risks, the role of on-chain growth, and how the UAE’s regulatory and capital environment could accelerate Solana’s trajectory.
Solmate’s $300M UAE Treasury: Why It Matters
Solmate’s $300 million capital pool dedicated to establishing a Solana treasury in the UAE is more than a headline number—it’s a signal that institutional-grade asset management for crypto-native assets is globalizing beyond traditional finance hubs. The UAE, and particularly Abu Dhabi and Dubai, have positioned themselves as crypto-forward jurisdictions with clear regulatory sandboxes and proactive frameworks. Establishing a Solana treasury there creates:
• A regional liquidity hub: Concentrating capital in a friendly regulatory environment can improve market depth for SOL and Solana-native assets during aggressive expansion phases.
• Institutional standardization: A treasury framework can adopt disciplined risk controls, custody standards, and transparent rebalancing strategies, making it a template for other funds and corporates to emulate.
• On-ramp for Middle Eastern capital: Sovereign wealth funds, family offices, and regional asset managers have shown interest in digital assets. A Solana-focused treasury in the UAE lowers friction for capital allocation.
•
Mechanics of a Solana Treasury
Treasury operations are more than passive holdings. They typically involve:
• Core SOL accumulation: A base allocation that reflects long-term conviction in network value capture, staking yields, and governance.
• Liquidity provisioning: Deploying assets in DeFi protocols, AMMs, and order books to enhance liquidity and earn fees, subject to risk controls.
• Staking strategies: Validator diversification, slashing protection, and yield optimization through auto-compounding and programmatic rebalancing.
• Venture and ecosystem exposure: Strategic allocations to Solana-native projects, tokens, real-world asset (RWA) initiatives, and infrastructure plays (or via index-like baskets).
• Hedging overlays: Options and perp hedges to manage drawdowns while maintaining directional exposure.
By anchoring these flows in the UAE, Solmate not only signals conviction; it operationalizes a repeatable structure that can absorb larger institutional checks as compliance frameworks and counterparties mature.
Forward Industries Bets Big on Solana
Forward Industries’ publicized pivot toward SOL underscores a broader shift: institutions are no longer simply “diversifying” into Solana—they are actively rotating into it as a core position. The drivers include:
• Performance-to-throughput ratio: Solana’s execution environment continues to deliver high throughput and sub-second finality with low fees, supporting consumer-grade applications such as payments, on-chain order books, and gaming without UX compromise.
• DePIN, payments, and consumer apps: From real-time order execution to growth in tokenized assets and payments rails, Solana’s app layer is demonstrating product-market fit in areas where latency and cost matter.
• Developer momentum: Tooling, runtimes, and TypeScript-centric development are attracting teams that want to ship quickly with rich UX. Growth in Saga and mobile-focused experiments adds tailwind.
• Liquidity concentration: As more capital pools into SOL pairs and Solana’s native DEXs, slippage decreases and the market becomes more attractive for block-sized orders.
The “buying frenzy” moniker stems from combined flows across centralized exchanges, on-chain wallets, staking platforms, and prime brokers. Institutional trade sizes are up, and block liquidity providers report rising interest for SOL borrow and cross-margin facilities—both signposts that levered directional exposure and basis trades are heating up.
The ETF Wave: SEC Approvals Could Reshape Flows
A critical macro catalyst is the likelihood of multiple ETF approvals in the coming months. While much of the focus has been on Bitcoin and Ethereum, the structural changes triggered by ETF adoption—standardized custody, audited NAV calculations, and regulated market-making—create spillover effects across large-cap crypto assets.
Here’s why ETF approvals matter to Solana:
• Legitimacy funnel: When institutions obtain board approvals for crypto exposure via ETFs, internal compliance friction declines. From there, investment committees often explore other large-cap crypto assets with similar liquidity and adoption—enter SOL.
• Portfolio construction: Multi-asset crypto strategies reweight based on momentum, liquidity, and correlations. If BTC and ETH ETF flows stabilize, allocators often diversify into high-beta assets with compelling adoption narratives—again, SOL is a prime candidate.
• Derivatives market deepening: ETF market-making expands basis, options, and hedging activity. Robust hedging tools lower the barrier to building large SOL positions.
Even if a Solana ETF is not immediately approved, the institutional infrastructure and behavioral changes catalyzed by BTC/ETH ETFs provide a clear path for capital to migrate into SOL through other compliant vehicles.
Technical Structure: SOL Aligns for a Breakout
From a technical perspective, SOL’s setup reflects several bullish elements frequently observed in assets that break into new cyclical highs:
• Higher lows and a strong weekly structure: Persistent higher lows on the weekly timeframe suggest bid support from larger accounts. Breakouts from multi-month accumulation ranges often lead to trend extensions.
• Volume confirmation: Rising volume on up weeks and muted sell volume on retracements indicate absorption by patient buyers. This is often a hallmark of institutional accumulation.
• Moving average alignment: When the 50-day and 200-day moving averages turn up in tandem and compress beneath price, they function as dynamic support. Golden cross conditions on high timeframes historically reinforce trend persistence.
• Momentum oscillators: Constructive RSI behavior (staying in bullish regimes, respecting 50-55 on pullbacks) supports the case for sustained upside. MACD crossovers above the zero line add confirmation.
• Market structure breaks: If SOL clears prior supply zones with strong breadth in Solana ecosystem tokens, it often precedes a sharp expansion leg.
From a pure charting lens, the path to retest the all-time high (ATH) becomes plausible once prior resistance shelves are flipped to support with convincing retests. The next leg can extend if funding stays balanced and derivatives don’t overheat.
Why $300+ Is on the Table
Calling specific price targets in crypto is always probabilistic, but the $300+ scenario reflects a confluence of factors:
• Elastic demand: As SOL regains narrative dominance, every incremental institutional participant must source supply in a relatively illiquid float, especially with high staking participation. This creates reflexivity: higher prices attract more attention and flows.
• Ecosystem beta: When Solana majors rally, Solana ecosystem tokens and NFTs often follow, generating wealth effects that feedback into SOL via fees, staking, and treasury rebalancing.
• On-chain revenues and usage: Fees and MEV-like revenue capture, combined with consistent L1 usage, differentiate SOL as more than a speculative token. If fee markets remain healthy without compromising UX, valuations can adjust quickly.
• Capital markets maturity: Prime brokerage services, credit lines, and custodial lending for SOL increase leverage capacity for funds. Managed responsibly, this deepens liquidity and smooths volatility while supporting upside.
•
Institutional Signaling and Order Flow Dynamics
Institutions leave footprints:
• Options skew: A shift toward call dominance and tightening call spreads near key strikes suggests demand for upside exposure. Calendar spreads can hint at timing expectations around catalysts like ETF decisions or protocol upgrades.
• Basis behavior: Persistent positive basis with manageable funding indicates steady demand for levered long exposure without frothy excess. Sharp basis expansions often precede blow-off tops, but controlled elevations are constructive.
• Block trade prints: Larger fills on the offer with minimal price impact imply sophisticated execution algorithms are absorbing liquidity. VWAP-style participation in uptrends is a hallmark of fund flows.
•
Solana Fundamentals: Not Just Hype
The bullish case is reinforced by fundamentals:
• Throughput and reliability improvements: Ongoing client and scheduler upgrades have meaningfully reduced congestion and improved consistency, aligning the chain for mainstream-scale apps.
• Developer ecosystem: Grants, hackathons, and venture inflows are driving an uptick in deployment across DeFi, DePIN, payments, and consumer social. More apps mean more transactions, fees, and network effects.
• Staking and validator health: A broad validator set with improving decentralization metrics, plus liquid staking growth, provides both security and capital efficiency. Mature slashing protections and monitoring infrastructure reduce operational risk.
• Cross-ecosystem bridges and RWAs: Safer bridging architectures and the growth of tokenized real-world assets on Solana expand the total addressable market and institutional relevance.
The UAE Vector: Why Location Matters
The decision to anchor a Solana treasury in the UAE amplifies several advantages:
• Regulatory clarity: Entities can obtain approvals and operate with predictable oversight, facilitating custody, staking, and DeFi participation at institutional scale.
• Geographic diversification: Reduces dependence on US and EU regulatory cycles, creating a global liquidity map that supports 24/7 markets.
• Access to sovereign and family office capital: The region’s investor base is comfortable with alternative assets, infrastructure, and frontier technologies, making Solana’s high-throughput narrative particularly compelling.
• Talent and infrastructure: The UAE’s growing fintech and crypto workforce supports operational resilience for treasury and market activities.
Risk Factors and What Could Go Wrong
No thesis is complete without acknowledging risk:
• Regulatory shifts: Unexpected adverse rulings in key jurisdictions, or delays/denials around ETFs, could dampen flows and sentiment.
• Network incidents: Performance degradation or security issues would hurt adoption narratives and compress multiples.
• Liquidity shocks: If derivatives positioning becomes crowded, a deleveraging event could trigger cascading liquidations. Watch funding, OI, and CVI-like measures.
• Macro correlation: A sharp risk-off in global markets—driven by rates, growth scares, or geopolitical events—can compress crypto valuations, including SOL, even amid strong fundamentals.
• Competitive pressure: Advances from competing L1s or L2s, especially around modular architectures and data availability, could siphon developer and liquidity attention.
Signals to Track in the Coming Months
For investors and observers, keep an eye on:
• ETF decision timelines: Not just for SOL, but for broader crypto products. Watch S-1 updates, surveillance-sharing agreements, and authorized participant rosters.
• On-chain metrics: Daily active addresses, fee revenue, transaction success rates, and validator participation. Sustained growth here supports the fundamental re-rating.
• Derivatives health: Funding rates, options IV, skew, and term structure. Healthy markets allow trends to persist without disorderly squeezes.
• Treasury disclosures: Any public filings, attestations, or wallet monitoring from Solmate and similar entities. Evidence of steady accumulation bolsters the thesis.
• Ecosystem catalysts: Major app launches, RWA integrations, payments partnerships, and mobile distribution wins (e.g., Saga ecosystem) that translate to real usage.
Strategy Considerations for Different Participants
• Long-only funds: Dollar-cost averaging with disciplined rebalancing can mitigate timing risk. Consider partial hedges around known catalysts to manage drawdowns.
• Crypto-native funds: Use options to express directional views while capping tail risk. Calendar call spreads around ETF windows or ecosystem launches can be capital-efficient.
• Corporates and treasuries: For those inspired by Solmate’s model, start with staking policies, custody/vendor selection, and risk dashboards. Establish governance before deploying into DeFi strategies.
• Retail participants: Avoid over-leverage. Respect invalidation levels and maintain a cash buffer. Focus on time in market rather than perfect entries.
•
Why This Cycle Is Different for Solana
Cycles rhyme, but specific drivers evolve. For SOL, three differentiators stand out:
• Real usage at scale: Consumer-grade apps processing real volumes, with fee revenues that matter.
• Institutional-grade infrastructure: Custody, staking-as-a-service, credit lines, and compliance tooling that make large allocations feasible.
• Global capital alignment: The UAE initiative symbolizes a broader dispersion of crypto capital formation—less dependent on any single regulator or geography.
The Road to ATH and Beyond
Reclaiming all-time highs requires both narrative strength and structural support. Solana’s current setup has:
• Narrative: High-throughput chain powering next-gen consumer and financial apps, now validated by serious capital allocators.
• Structure: Disciplined treasury formation, institutional flows, deepening derivatives, and growing on-chain revenues.
A move to fresh ATHs could unfold in stages:
1. Clearance of major resistance with rising spot volume
2. Healthy consolidation with elevated but not extreme funding
3. Fresh leg higher fueled by ecosystem beta and positive macro catalysts (ETF approvals, corporate adoption)
4. Volatility expansion near psychological round numbers, followed by a volatility contraction if treasuries and market makers absorb flows
If these stages play out with controlled leverage and robust spot participation, the path toward $300+ becomes more than aspirational—it becomes a function of order flow and narrative reflexivity.
Bottom Line
• Solmate’s $300 million launch to build a Solana treasury in the UAE is a landmark institutional milestone that could catalyze regional and global capital into SOL and its ecosystem.
• Institutional players like Forward Industries are signaling a pronounced shift toward Solana, reinforcing a buying frenzy dynamic supported by liquidity and execution improvements.
• The likely approval of multiple crypto ETFs later this year is a macro tailwind that indirectly benefits SOL, even before any Solana-specific ETF comes to market.
• Technicals align with fundamentals: higher lows, constructive volume, favorable moving averages, and bullish momentum patterns support the case for an ATH retest and potential breakout toward $300+.
• Risks remain—regulatory, network, liquidity—but the balance of probabilities currently favors continued upside as on-chain usage, institutional infrastructure, and global capital alignment strengthen.
As always, this is not financial advice. Markets are volatile, and conditions can change quickly. But with treasury formation ramping, institutional flows accelerating, and technicals confirming, Solana’s next chapter is setting up to be its most consequential yet. If the current trajectory holds—anchored by the UAE treasury initiative and sustained by institutional adoption—SOL’s bid for new all-time highs and beyond looks not just plausible, but increasingly likely.

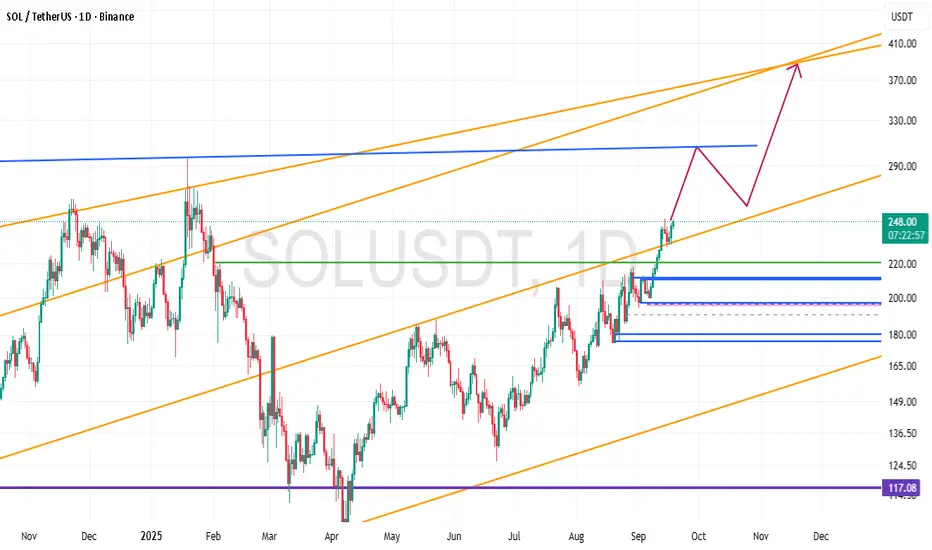
Technical Analysis Report: Solana (SOL/USDT)Current Price: ~$248
Solana is currently trading within a bullish ascending channel on the daily timeframe. The overall mid-term trend remains positive, supported by higher highs and higher lows.
🔑 Key Levels
Support Zones:
$220 → psychological support and trendline retest
$200 → major structural support (critical level)
$180 → strong support in case of a deeper correction
Resistance Zones:
$290 → short-term resistance and potential rejection area
$370 → upper boundary of the channel and main bullish target
📈 Possible Scenario
Price may extend its rally toward $290.
A corrective pullback to the $250–260 range could follow.
If momentum holds, the next bullish target lies around $370 at the channel top.
⚠️ Risk Notes
As long as SOL holds above $200, the bullish trend remains intact.
Losing the $200 support could trigger a decline toward $180.
Risk management and stop-loss placement are essential due to possible short-term volatility.
📌 Summary
Solana maintains a bullish outlook while trading inside its ascending channel. The medium-term upside targets stand at $290 and $370, with key supports at $220–200. Short-term corrections are possible, but the overall structure favors further upside as long as $200 holds.
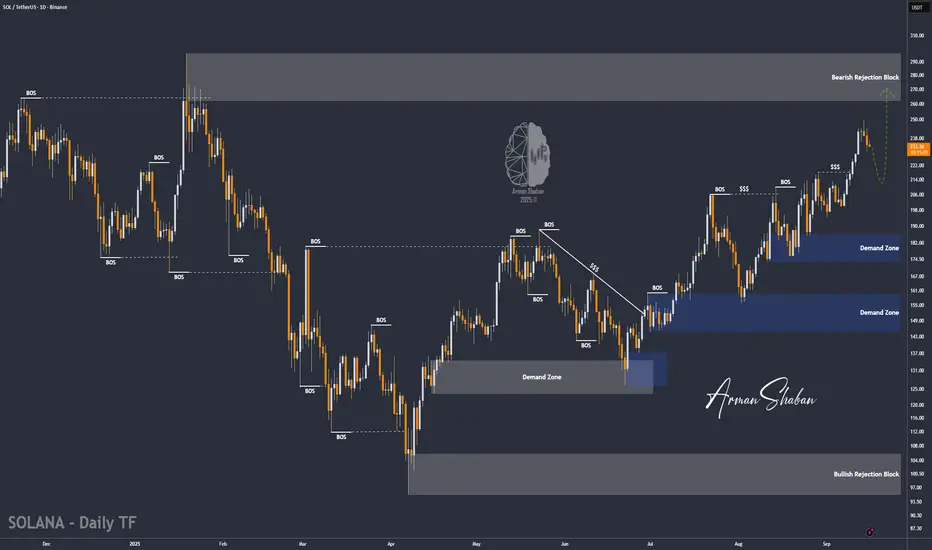
SOL/USDT | Solana Correction Over? Big Rally Loading Soon!By analyzing the Solana chart on the daily timeframe, we can see that after a correction, the price is now trading around $234. In the short term, I expect a small pullback, followed by another strong bullish move from this coin.
The key demand zone is between $210–$220, while the possible upside targets are $250, $260, and $296.
Please support me with your likes and comments to motivate me to share more analysis with you and share your opinion about the possible trend of this chart with me !
Best Regards , Arman Shaban
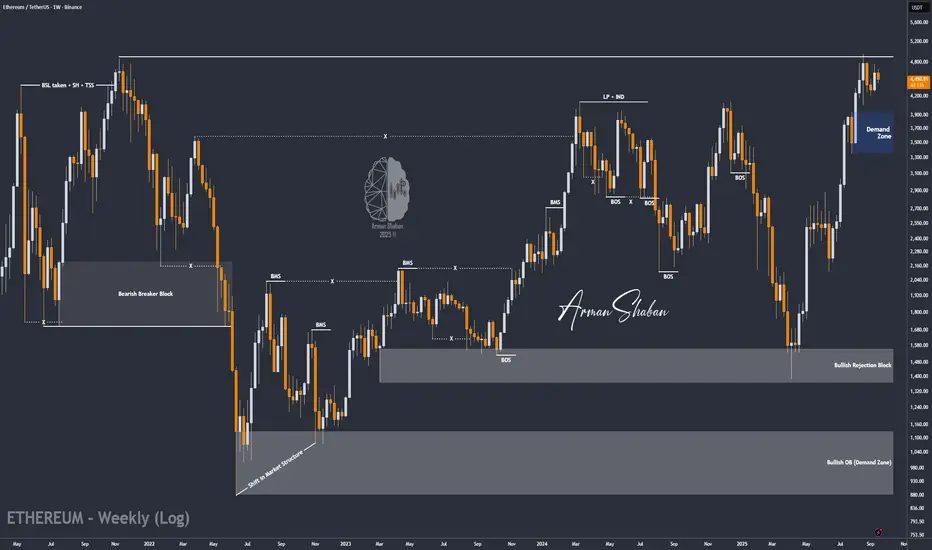
ETH/USDT | Ethereum Pullback Over? Next Stop New Highs! (READ)By analyzing the Ethereum chart on the weekly timeframe, we can see that after climbing to $4,700, the price pulled back and is now trading around $4,500. If ETH can hold above the $4,480 level, we can expect more upside.
However, today the market will be very volatile due to the Fed interest rate decision. With that condition in mind, the next possible bullish targets for Ethereum are $5,100, $5,500, and $6,000.
Please support me with your likes and comments to motivate me to share more analysis with you and share your opinion about the possible trend of this chart with me !
Best Regards , Arman Shaban
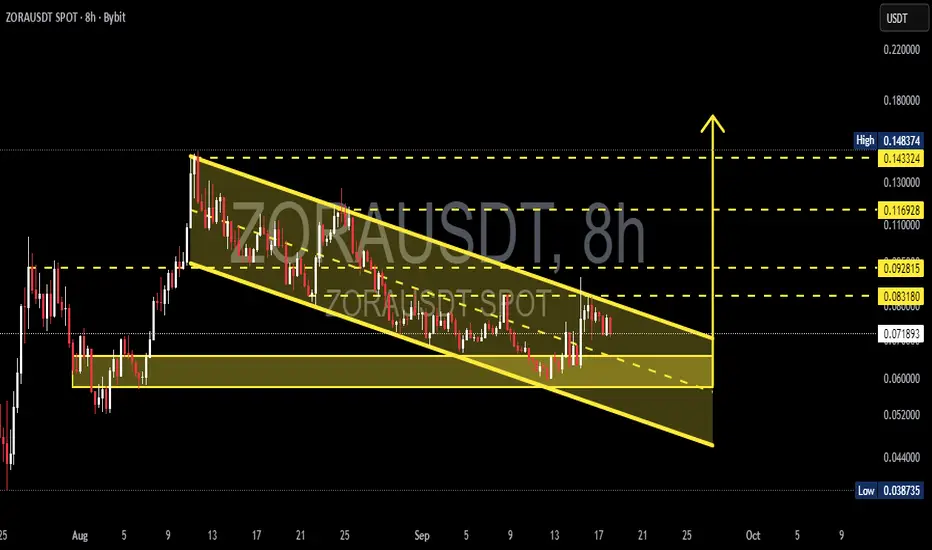
ZORA/USDT — Descending Channel Reaching Decision Point?Currently, ZORA/USDT is trading inside a well-defined descending channel, formed since the mid-August peak. The structure shows a sequence of lower highs and lower lows, reflecting mid-term bearish control. However, this pattern also resembles a falling wedge, which often signals a potential bullish reversal if a breakout occurs.
---
🔹 Technical Structure
Main Pattern: Descending channel (slightly converging, similar to a falling wedge).
Current Price: ~0.0719 USDT
Demand Zone: 0.055 – 0.062 (strong accumulation area tested multiple times).
Key Support: 0.0387 (chart low).
Resistance Levels:
0.0831 → first breakout trigger
0.0928 → next psychological resistance
0.1169 → mid-term target if momentum holds
0.1433 – 0.1483 → major resistance zone / previous rally high
---
🔹 Bullish Scenario
1. Price must close above the channel’s upper trendline and 0.0831 on the 8H timeframe.
2. A valid breakout should be confirmed with strong volume + successful retest of the upper channel as new support.
3. If confirmed, bullish targets are:
🎯 Target 1 → 0.0928
🎯 Target 2 → 0.1169
🎯 Target 3 → 0.1433 – 0.1483
📍 Note: A failed breakout (false breakout) could send price back into the channel.
---
🔹 Bearish Scenario
1. If price gets rejected at the upper channel or fails to close above 0.0831, downside pressure may return.
2. A strong breakdown below the demand zone (0.055–0.062) opens the path toward 0.0387.
3. Bearish outlook is invalidated if the price sustains above 0.0831 with confirmation.
---
🔹 Conclusion
ZORA/USDT is approaching a critical decision zone.
The descending channel structure provides two clear paths:
🚀 Bullish breakout above 0.0831 → upside targets 0.0928 – 0.1433.
📉 Breakdown below 0.055–0.062 → potential continuation toward 0.0387.
Key decision levels: 0.0831 (resistance) and 0.055–0.062 (support zone).
---
📢 Trading Notes
Always wait for 8H/1D candle close for confirmation before execution.
Risk management is crucial — never enter without a stop loss.
Descending channels often lead to explosive moves once a breakout is confirmed — be prepared.
---
ZORA/USDT is consolidating inside a descending channel. 0.0831 is the breakout trigger for a bullish reversal, while 0.055–0.062 remains the key demand zone. Breakout → targets 0.0928 – 0.1433. Breakdown → risk toward 0.0387. Watch candle close + volume for confirmation.
---
#ZORA #ZORAUSDT #Crypto #Altcoins #TechnicalAnalysis #TradingView #ChartPattern #Breakout #SupportResistance #PriceAction
SBR/USDI have been building a position in this asset since early 2025. Patience has been necessary but the promise remains. I have been watching this chart closely and we now have a fully formed head and shoulder pattern on the Stochastic RSI on the daily timeframe. The daily candle still needs too close to confirm a breakout above the neckline but things are looking promising. We are also trading below a trend line that acted as support in the past. I believe this move if confirmed would push us above that resistance. Further evaluation would be needed after that. Larger timeframes SBR is beyond ready to run (potentially an inverse head and shoulders forming on weekly stoch rsi). I'm just looking for that spark. Best wishes in your life and ambitions (only the righteous ones).

BTC/USDT | Bitcoin Rally Setup – Next Stops: $116.7K and Beyond!By analyzing the Bitcoin chart on the 4-hour timeframe, we can see that the price is currently trading around $115,500. As long as it holds above the key support zone of $113,700–$115,300, I expect Bitcoin to continue its bullish move toward higher levels.
The next possible upside targets are $116,700, $117,450, and $118,600. Longer-term targets will be shared in future updates!
Please support me with your likes and comments to motivate me to share more analysis with you and share your opinion about the possible trend of this chart with me !
Best Regards , Arman Shaban

SOL – Bulls Holding the Channel!SOL has been overall bullish, trading inside a clean ascending channel. Price broke above the $215 – $220 structure zone and pushed higher, but is now pulling back for a retest.
This zone is key 🔑 . It aligns with channel support, making it a strong confluence for buyers to step in. If bulls defend it, momentum could continue, and SOL may push toward higher levels inside the channel 🚀.
If the zone fails, a deeper correction could follow before another attempt from the bulls. Until then, the bias remains bullish as long as structure holds.
What do you think — will the bulls 🐂 step in and send SOL flying again, or will bears take over for a deeper pullback? 🤔
⚠️ Disclaimer: This is not financial advice. Always do your own research and manage risk properly.
📚 Stick to your trading plan regarding entries, risk, and management.
Good luck! 🍀
All Strategies Are Good; If Managed Properly!
~Richard Nasr

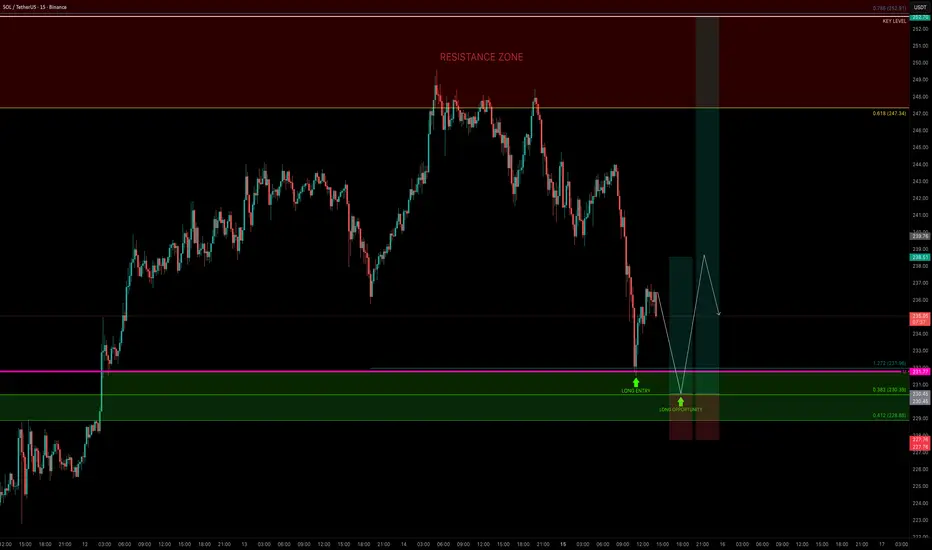
SOL — Bulls Need to Defend $230 for ContinuationSOL had a strong bullish week, almost tapping the $250 psychological level before rejecting down into the monthly level at $231.77, where price found support and bounced. This level also aligned with the 1.272 Fib extension ($231.96), making it a valid long opportunity.
🟢 Next Long Opportunity
The 0.382 Fib retracement ($230.39) of the move from the $199.32 low is the next key level to watch.
A retest here would:
Sweep liquidity from the current low
Offer a low-risk entry
Help fill some imbalances
📌 Overall, $230 is the level that must hold for bullish continuation.
Targets
TP1: $238 → R:R ~1:3
TP2: $252.91 (0.786 Fib retracement) → R:R ~1:8+ if momentum continues
Risk Management
Stop-Loss: Below $229 (clear invalidation)
Risk: Only 1% on this trade setup
Quick Take
If $230 holds, SOL could set up for another leg higher. This zone offers a clean, low-risk, high-reward long setup with clearly defined invalidation and attractive targets.
Solana: Selling Pressure Hits 6-Month High as SOL Price Nears $2Currently, Solana trades at $235, sitting just 6% below the $250 milestone. Over the weekend, SOL attempted to reach this target but failed. However, it has managed to hold steady above the $232 support level.
If bullish momentum continues, Solana could rebound from $232 and test resistance at $242. A successful breach, particularly if long-term holders slow their selling. This could push SOL toward reclaiming $250 in the near term.
However, if selling pressure from long-term holders accelerates, Solana may struggle to defend $232 as support. This scenario could result in a correction toward $221, undermining bullish momentum and invalidating near-term upward projections.

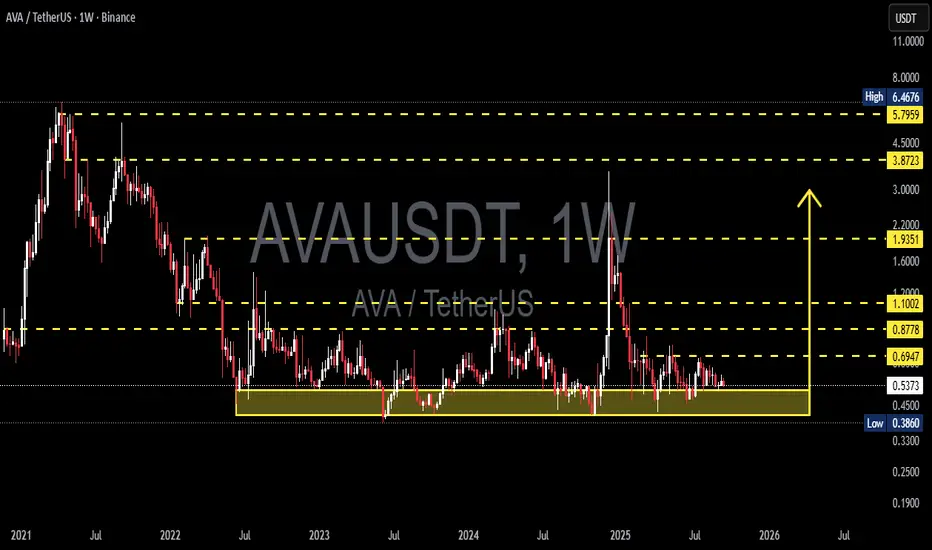
AVA/USDT —Demand Zone: Accumulation or Deeper Breakdown?📌 Overview
The AVA/USDT weekly chart shows a dramatic journey:
From the 2021 peak ($6–7), price has been in a prolonged downtrend followed by sideways consolidation since 2022.
For nearly 3 years, the yellow zone ($0.38 – $0.45) has acted as a battlefield between buyers and sellers.
Each test of this area has resulted in strong rebounds, marking it as a major demand zone.
Now, AVA is once again hovering near this critical support. The big question: Is this the ultimate long-term accumulation zone or the start of a deeper breakdown?
---
🔍 Pattern & Structure Analysis
Macro trend: Bearish since 2021 → long consolidation from 2022–2025.
Dominant pattern: Wide sideways range with a solid base at 0.38–0.45 and tiered resistances at 0.69, 0.87, 1.10, 1.93.
Price character:
Multiple lower wicks into demand zone → sign of liquidity grabs and potential accumulation by bigger players.
Prolonged sideways near lows suggests a possible bottoming formation.
However, compression against support can also lead to a breakdown if bulls lose control.
---
🟢 Bullish Scenario
If buyers defend 0.38–0.45 and push higher:
1. First confirmation: Weekly close above 0.6947.
2. Upside targets:
0.8778 → first mid-term resistance.
1.1002 → psychological & structural breakout zone.
1.9351 → major resistance, early trend reversal confirmation.
3. With strong momentum, a revisit of 3.87 – 5.79 (the 2021 supply zone) remains possible in the next bull cycle.
(Potential gains: +63% to 0.87 / +105% to 1.10 from current price ~0.53).
---
🔴 Bearish Scenario
If a strong weekly close below 0.386 occurs:
1. The 3-year demand zone will fail → showing buyers have lost control.
2. Downside target: 0.25 – 0.19 as the next realistic demand area.
3. Extreme measured-move projection even points to 0.07 (though unlikely, it must be considered).
(Downside risk: −53% to 0.25 from current price).
---
📊 Key Takeaways
$0.38–0.45 = pivotal demand zone for AVA’s next cycle.
Breakout above 0.69 = early bullish signal.
Breakdown below 0.38 = opens risk of new all-time lows.
This zone will decide whether AVA enters a new accumulation phase or faces final capitulation.
---
Critical demand zone = 0.38–0.45.
Watch 0.6947 breakout for bullish bias.
Watch 0.386 breakdown for bearish continuation.
Momentum will reveal if this is smart money accumulation or a last leg down.
---
#AVA #AVAUSDT #CryptoAnalysis #WeeklyChart #Altcoins #TechnicalAnalysis #SupportResistance #CryptoTrading #ChartPatterns