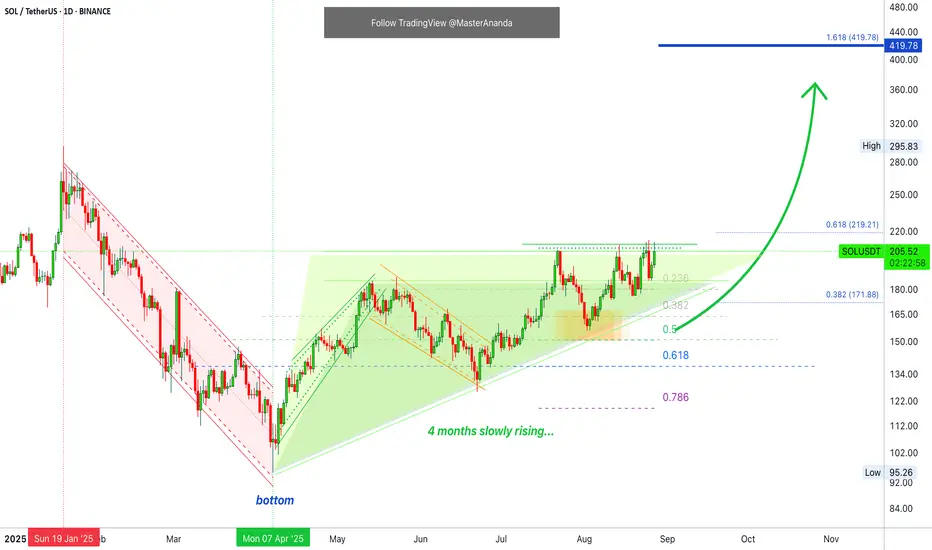
Solana · At The Top of The RangeI've been looking at many charts and seeing a repeating pattern; many pairs are trading right at resistance, at the top of the range.
This same rising triangle we see on SOLUSDT was present in another pair, and many other charts look similar.
The altcoins market is pushing higher, trying to break a local resistance zone. You know what happens when this level breaks don't you? Wave 3 of the bullish cycle, normally the strongest wave, starts.
Wave 5 is still missing of course but it normally tends to be an extension of the third. Sometimes wave 5 can become much bigger than wave 3 but right now we still don't know how things will develop in this current bullish cycle. In general, wave 3 is always the strongest one.
So there is the possibility that we are right in front of the strongest period of bullish action in the entire 2025-2026 Cryptocurrency bull market.
Summary
Solana is going up. Even if prices drop, the end result of the drop would be a higher low, which implies higher prices next.
Regardless of the short-term, SOLUSDT is set to move higher. This statement is supported by market data.
Thank you for reading.
Namaste.
Solana
WHERE ARE WE ? BACK TO BULL MARKET ?I am reading a lot of "bullmarket is back" opinions here and there, and I don't really find an argument for a V reversal for the 17k low on $BTC yet
I think we are in a rangy phase where good investors/ltf traders will get nice opportunities to build their long term portfolio
I already shared my view on the Cosmos ecosystem, so now I will share my list of alts that I am looking to accumulate and in which proportion and at what average price (ideally):
ETH $750,00 - 10%
SOL $17,00 - 20%
ATOM $8,00 - 30%
SYN $0,50 - 10%
LOOKS $0,15 - 10%
the 20% remaining of the portfolio will stay in cash waiting to ride new cycle narratives
I have no interest in Bitcoin as the expected return is probably lower than newer coins/narratives
Exciting times ahead anyway
Cheers

SOL Breakout Alert! 🚨 CRYPTOCAP:SOL Breakout Alert! 🚨
CRYPTOCAP:SOL is currently testing the red resistance zone 🔴
If price breaks out, the first target will be the green line level 🎯
A confirmed breakout would signal bullish continuation and could drive price higher ✅
SHELLUSDT —Accumulation Phase or Breakdown?📌 Overall Chart Overview
Currently, SHELLUSDT is trading within a Descending Triangle pattern on the daily timeframe. This structure is characterized by lower highs pressing down through a descending trendline, while the bottom side is being defended by a strong demand zone at 0.13 – 0.15 (yellow box).
This setup signals that the market is in a tug-of-war phase: sellers are consistently applying pressure, yet buyers are still holding the line at support. The outcome of this compression will likely lead to a major move in the coming weeks.
---
🔼 Bullish Scenario (Breakout)
If the price manages to close above 0.15 and break through the descending trendline:
It would confirm a bullish breakout, signaling the potential start of a short-term trend reversal.
Upside targets to watch:
T1: 0.2047 (minor resistance)
T2: 0.2275 – 0.2400 (supply zone)
T3: 0.2600 (psychological resistance)
Extension: 0.3301 (major level, opening the path toward 0.5941 in the mid-term).
A valid breakout usually comes with a surge in volume, so volume confirmation will be key.
---
🔽 Bearish Scenario (Breakdown)
On the other hand, if price fails to hold the 0.13 – 0.15 zone and we see a daily close below 0.13:
The Descending Triangle would be confirmed as a bearish continuation pattern.
Downside targets:
T1: 0.1200
T2: 0.1077 (previous major low)
Extension zone: 0.1000 – 0.0960 (psychological levels).
This would highlight seller dominance and potentially extend the downtrend further.
---
📊 Additional Insights
Volume & Momentum: Volume is currently flat, reflecting indecision. A spike in volume will likely be the early signal of a major move.
Sentiment: A breakout would turn this demand zone into a golden accumulation area for buyers. A breakdown, however, would act as a trap for weak longs.
Risk Management: Waiting for a daily candle close beyond 0.13–0.15 is the safest approach to avoid fakeouts.
---
✨ Conclusion
SHELLUSDT is at the apex of its Descending Triangle, and the 0.13 – 0.15 range is the critical battle zone. A breakout above 0.15 opens the door for a trend reversal toward 0.20 – 0.26, while a breakdown below 0.13 could drag price down to 0.1077 or even lower.
Traders should remain patient and wait for clear confirmation before committing to an aggressive position. The current market is in a “wait and see” phase, and a powerful move is likely coming soon. 🚀📉
#SHELLUSDT #CryptoAnalysis #Altcoin #PriceAction #TechnicalAnalysis #DescendingTriangle #SupportResistance #BullishBreakout #BearishBreakdown #CryptoTrading #RiskManagement

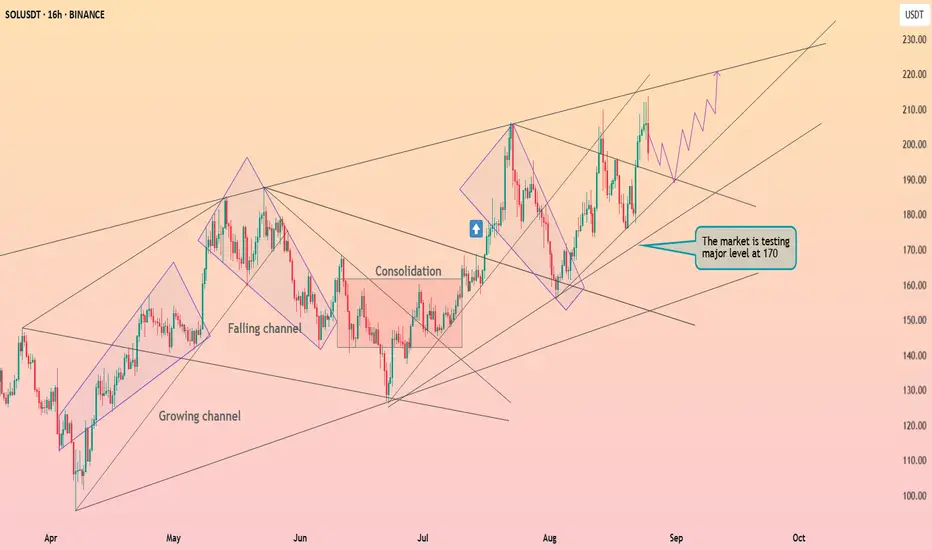
Solana fixed above the $175 ┆ HolderStatBINANCE:SOLUSDT on the 16h chart is testing the major $170 resistance level. Previous consolidations and falling channels have transitioned into higher highs, supporting the broader bullish structure. A breakout above $170 would confirm momentum toward $200, while $160 acts as the critical support for invalidation.
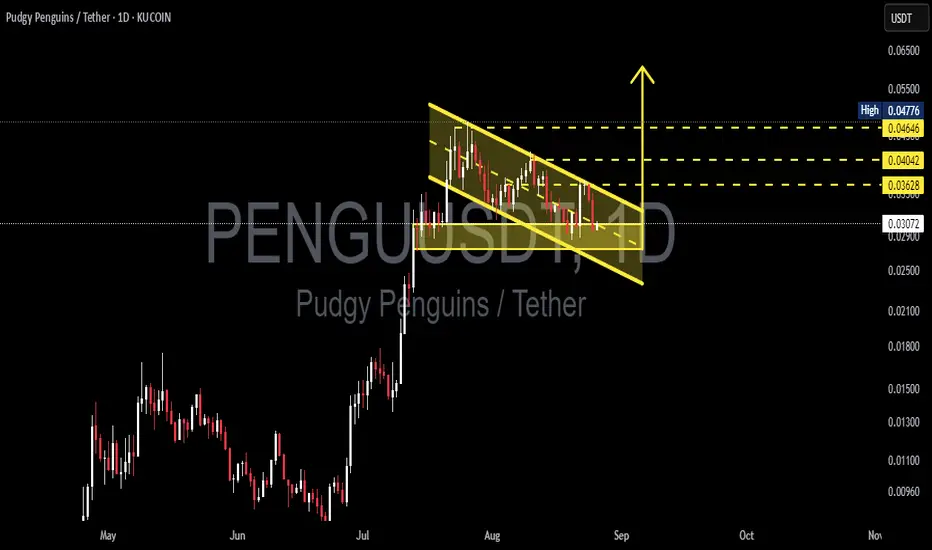
PENGU/USDT — Descending Channel!, Bull-Flag or Breakdown?🔎 Technical Analysis
Currently, PENGU/USDT is trading inside a descending channel following a sharp rally in July–August. This structure often appears as a healthy consolidation after a strong impulse move and can be classified as a bull-flag pattern — a potential bullish continuation setup waiting for confirmation.
Key Support: 0.0306 remains the critical demand zone. Multiple retests have held this level, making it an important line in the sand.
Key Resistance: The upper boundary of the channel, along with 0.03628, 0.04042, and 0.04646–0.04776, are the major upside targets if a breakout occurs.
Pattern Structure: Lower highs and lower lows forming a clean descending channel, but still within the context of a broader bullish trend.
Confirmation: A breakout above the channel with strong volume would confirm the bull-flag setup. A breakdown below 0.0306, however, would invalidate it and shift bias bearish.
---
🚀 Bullish Scenario
1. Channel Breakout: If price breaks above the descending channel and closes daily above 0.03628, upside targets include:
🎯 Target 1: 0.03628
🎯 Target 2: 0.04042
🎯 Target 3: 0.04646 – 0.04776
2. Retest Confirmation: A successful retest of the breakout level could provide a safer long entry.
---
🔻 Bearish Scenario
If price fails to hold 0.0306 and breaks down with strong selling volume, downside levels to watch:
📉 0.02500 – 0.02200
📉 possibly extending toward 0.01800 if bearish momentum accelerates.
Such a move would invalidate the bull-flag and suggest deeper correction.
---
📝 Trading Notes
Aggressive Approach: Enter near 0.0306 support with tight stop-loss below 0.028 → higher risk/reward but less safe.
Conservative Approach: Wait for a confirmed daily breakout above 0.03628 before entering → safer confirmation.
Risk Management: Always apply stop-loss and size positions properly — false breakouts remain a risk.
---
📌 Conclusion
PENGU is at a critical crossroads:
Bullish bias if it breaks out of the channel and reclaims 0.03628 → potential continuation toward 0.046+.
Bearish bias if it loses 0.0306 → downside correction likely toward 0.025–0.022 or lower.
While the overall trend remains bullish from the prior rally, confirmation is key before the next major move.
#PENGU #PudgyPenguins #Crypto #Altcoins #TechnicalAnalysis #PriceAction #BullFlag #DescendingChannel #BreakoutSetup
BRETT/USDT — End of Consolidation, Beginning of a Big Move?BRETT/USDT is currently forming a symmetrical triangle pattern on the Daily timeframe (1D). This structure is shaped by lower highs (selling pressure) and higher lows (buying pressure), which are now converging near the apex zone (0.049–0.064). As price approaches the tip of the triangle, volatility often expands sharply, leading to a major directional breakout.
---
🔹 Pattern & Key Levels
Pattern: Symmetrical Triangle (neutral — can break either way).
Strong Support: 0.045 – 0.049
Key Resistance: 0.064
Major Horizontal Levels:
0.091 → mid resistance
0.115 → strong resistance
0.152 → psychological zone
0.211 – 0.236 → previous highs
Lower Supports: 0.037 / 0.031 / 0.026 / 0.023
---
🚀 Bullish Scenario
1. Breakout confirmation if daily close happens above 0.064 with strong volume.
2. A successful retest of 0.064 as support will further strengthen the bullish setup.
3. Upside targets:
TP1 = 0.091
TP2 = 0.115
TP3 = 0.152
Measured move projection (long-term potential) = ~0.277
4. Stop-loss idea: below 0.049 or under the lower trendline.
---
🔻 Bearish Scenario
1. Breakdown confirmation if daily close happens below 0.045.
2. Failed retest of 0.045–0.049 as resistance would confirm further downside.
3. Downside targets:
TP1 = 0.037
TP2 = 0.031
TP3 = 0.026
Final strong support = 0.0234
4. Stop-loss idea: above 0.058–0.064 (upper trendline zone).
---
⚖️ Conclusion
BRETT/USDT is approaching a critical decision zone. The symmetrical triangle shows market compression — pressure is building up for a powerful breakout.
A bullish breakout above 0.064 could fuel a rally toward 0.091 – 0.152 and potentially higher.
A bearish breakdown below 0.045 may trigger a correction toward 0.026 – 0.023.
Best strategy: Wait for breakout confirmation with daily close + volume, apply strict stop-losses, and take profits step by step at key levels.
#BRETTUSDT #BRETT #AltcoinAnalysis #CryptoBreakout #TechnicalAnalysis #SymmetricalTriangle #ChartPattern #CryptoTA #SupportResistance

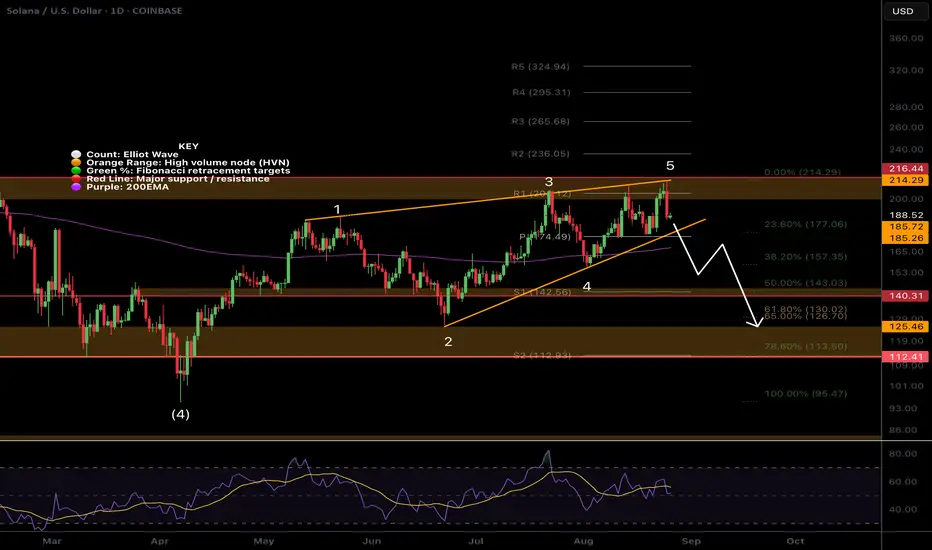
SOL Elliot Wave Count ChangedCRYPTOCAP:SOL Solana appears to have completed an Elliot wave diagonal pattern with a series of ABCs.
Falling below the trend line and 200EMA would confirm this and bring up a first target of $140 at the High Volume Node and 0.5 Fibonacci retracement.
Daily RSI has had bearish divergence for a while. The 'alt-coin golden pocket' 0.786 sits at the wave 2 bottom around $119 which would be a buy for me if price gets down that far.
Safe trading.
Bullish Case For SolanaThis is my bullish scenario for Solana in 2025–2026. It is moving in an ascending channel and is likely to continue toward the upper boundary of the channel. We will face resistance around the middle of the upper channel and experience many corrections along the way. The midline of the lower channel will act as a support line on the way, but overall this remains a bullish case for Solana. The passing of the Clarity Act will be a catalyst for this.

BNB tuched its TPThe first position reached its target with reward 2
Please go and see the previous analysis.
I am waiting for a new high to be recorded

Solana Setting Up For Bullish moveSolona is currently inBullish triangle pattern. Completing Elliot wave ABCDE Pattern. Looking for SOL to move up to Fib level 141.00% which is $251 after move down.

bearish market for solanaGreetings to our dear friends.
After breaking the bottom and pulling back, Solana could fall to the specified bottom and we could witness a bear market.

FUN/USDT — Accumulation at Demand Zone: Rebound or Breakdown?📖 Narrative & Full Analysis
FUN/USDT is currently standing at a critical crossroads. After a strong rally that pushed the price to the recent peak at 0.0248 USDT, the market faced a sharp correction and is now testing the demand zone (0.0075 – 0.0090) — an area that previously acted as major resistance and has now flipped into support.
This is the level that will define the next big move:
Will buyers defend this zone and fuel a new rally?
Or will sellers break through and trigger another deep leg down?
The structure shows accumulation in progress. The sideways consolidation above demand indicates that the market is building momentum, awaiting confirmation for the next direction.
---
📊 Key Technical Levels
📍 Current Price: 0.009467
🟨 Demand Zone (Key Support): 0.0075 – 0.0090
🔑 Upside Resistance / Targets:
0.013887 → first breakout confirmation
0.019766 → mid-term supply zone
0.022897 – 0.024800 → retest of previous highs
⚠️ Downside Risk if Breakdown:
0.0032 → mid-term support
0.001839 → historical low
---
📈 Bullish Scenario
Buyers successfully hold above the demand zone.
A daily close above 0.0139 would confirm bullish momentum.
If momentum builds, FUN could rally in stages: 0.0139 → 0.0197 → 0.022–0.0248.
Bullish strategy:
Accumulate within 0.0075 – 0.0090
Set a stop-loss below 0.0070
Scale out at resistance targets
Potential Reward: From current levels, upside could reach +150% or more if the demand zone holds.
---
📉 Bearish Scenario
If FUN loses the demand zone (daily close < 0.0070), support is broken.
This would open a path for a deeper decline towards 0.0032 and possibly 0.0018.
Bearish strategy:
Aggressive traders could short a confirmed breakdown.
Long-term holders should consider reducing risk or hedging if support fails.
---
🔍 Pattern & Sentiment
Pattern: Base-building / accumulation at demand zone.
Market Sentiment: Neutral-to-bearish in the mid-term, but with reversal potential if demand is respected.
Candlestick signals to watch: Long lower wicks and strong bullish closes from demand → early signs of reversal.
---
🧭 Conclusion & Outlook
FUN/USDT is at a make-or-break zone.
As long as the price holds 0.0075 – 0.0090, the setup favors a rebound with upside potential of +50% to +150%.
A confirmed breakdown below this zone, however, could trigger a 70–80% drop.
🚦This is a golden accumulation area for disciplined traders with tight stops. High risk, but potentially much higher reward.
#FUNUSDT #FUN #Altcoins #Crypto #TechnicalAnalysis #SupportResistance #Breakout #Bullish #Bearish

SOLANA BULLISH MEGAPHONE PATTERN LOADING! solana continues to move step by step towards higher levels within the bullish megaphone pattern, which will make movements towards ATH and more inevitable in the coming period

SOL - Buy it before it's too late!As simple as the chart looks, everything on it is clear with strong targets expected in a short time.
The blue line: a close above it means BOS (Break Of Structure), signaling continuation of the upward move.
🔸Notice: this is the third attempt to break it.
In trading, resistance that the price tests multiple times weakens over time, and when it finally breaks, it usually does so with a huge green candle.
The price has also broken the daily 0.618 Fibonacci level, crossed above the 25 EMA, and made a retest of it.
Your minimum target from here is $400.
It’s a beautiful chart, strong project, and a leading coin in the market with big targets ahead… all that’s left is for you to buy it.
Best Regards:
Ceciliones🎯

Solana Watch: $211- $212 Break of Fake?If Solana can’t break above $211–$212, I’m eyeing shorts this week. Waiting for the perfect setup to strike on day trades.

Solana in on the important junctionThe bar chart is in a mid-upward trend, having started in April 2025 and continued up to the present. Now, the chart is trapped in a triangle for a month. The future trend of the chart depends on the following break. If it can break above the triangle, and respectively exceed the resistance level, at $217, it would increase by $216 in the mid term.
On the other hand, the opposite scenario is a break below. In other words, the price might reduce to $144 if it breaks the support level, at $188, it is a crucial level because of the juncture of the bottom of the triangle, and $188 support level.
To sum up, there are two ways, an increase or a decrease, for SOLANA, and it generally depends on the first break will occur up or down.
Solana at Make-or-Break: Can $213 Unlock the Rally to $270?Solana (SOL/USDT) has been recovering strongly since bouncing from the $110 area and is now testing the critical resistance zone around $205–213. This level has acted as a major barrier multiple times in the past, making it a true “make-or-break” point.
📌 Bullish Scenario (more likely if $213 holds):
• A confirmed breakout and daily/3D close above $213 could trigger a rally toward the next major resistance at $270.
• A successful move beyond $270 may even open the path toward the long-term resistance trendline near $320–340.
📌 Bearish / Alternative Scenario:
• If Solana fails to hold above $213, a pullback toward $180–175 is possible.
• Stronger support lies around $100, which remains the key level to defend for bulls.
⚡ Conclusion:
As long as SOL stays above $200, the structure remains bullish. A breakout above $213 would confirm momentum and unlock a potential move toward $270, while rejection could mean another corrective dip before the next attempt.
Solana is trading around $207-208, showing strong growth.1. Current dynamics
Solana is trading around $207–208, showing steady growth. During the last day, the price has added about 0.5–0.7%, with a weekly gain of about +8%.
2. General technical picture
On timeframes from 1 hour to a month, SOL receives a general “Strong Buy” signal; the pace slows down only on the minute chart.
Indicators confirm: RSI — ~62 (Buy), MACD — Buy, ADX shows a strengthening trend — also Buy.
3. Fundamental levels and scenarios according to TipRanks
The price is above MA100 and MA200, which forms a stable bullish base. However, the price is below EMA20, the signal is Sell, while EMA50 supports Buy.
Pivot points (pivot) approximately:
Support: $177-182
Resistance: $187-200
4. Short-term driver
SOL is trading around $204, forming a triple top at $210.
Breaking this resistance can lead to +10% growth, with targets at $218-$228, and then to $250.
Current indicators: RSI - ~67 (bullish), MACD - confirms bullish momentum.
5. Trading activity review
SOL is trading with a volume of about $7.2-7.7 billion. Market capitalization is about $112 billion.

ORCA/USDT — Symmetrical Triangle Apex: The Calm Before the Storm🔎 Chart Overview
ORCA/USDT has been forming a massive Symmetrical Triangle since early 2024. The pattern is defined by lower highs (gradual selling pressure) and higher lows (steady accumulation by buyers). This represents a phase of tight consolidation, and as the price approaches the apex, the probability of a strong impulsive move ahead increases dramatically.
Currently, the price trades around 2.41 USDT, right inside the demand zone at 2.3 – 2.6 (yellow box). This zone has acted as a critical support multiple times since 2024, making it the key battleground for the next directional move.
---
🔼 Bullish Scenario (Breakout)
Trigger: A confirmed 4D candle close above the descending trendline and reclaim of the 3.00 – 3.41 USDT zone.
Confirmation: A breakout accompanied by rising volume would signal strong bullish momentum.
Upside Targets:
🎯 3.41 (first key resistance)
🎯 5.20 (psychological level)
🎯 7.48 (historical resistance)
🎯 9.90 (ATH / ultimate mid-term target)
Invalidation: A breakdown and 4D close below 2.3 USDT would invalidate the bullish setup.
---
🔽 Bearish Scenario (Breakdown)
Trigger: A breakdown below the 2.3 – 2.6 demand zone and loss of the ascending trendline support.
Downside Targets:
🛑 1.60
🛑 0.90
🛑 0.42 (historical Low) if capitulation unfolds.
Invalidation: A swift reclaim above 2.3 – 2.6 and re-entry into the triangle structure.
---
📌 Pattern Implications
The Symmetrical Triangle is a neutral pattern, but once a breakout occurs near the apex, it often leads to powerful trending moves.
The closer the price gets to the apex, the less time remains before volatility spikes.
Volume expansion will be the most reliable confirmation to separate a genuine breakout from a fakeout.
---
🎯 Extra Insight
The 2.3 – 2.6 demand zone is more than just support — it’s a strategic accumulation area where buyers have consistently defended their ground.
Holding this zone and breaking the descending resistance could trigger a multi-month rally.
Conversely, losing this zone could push ORCA into a capitulation phase before the next major cycle begins.
#ORCA #ORCAUSDT #Crypto #Altcoins #Breakout #PriceAction #TrianglePattern #TechnicalAnalysis #BullishScenario #BearishScenario

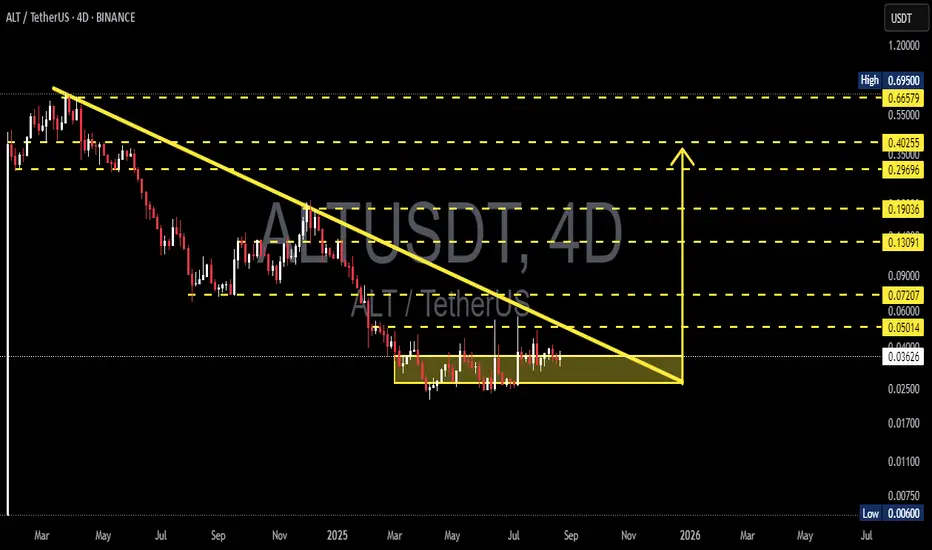
ALT/USDT — Descending Triangle: Breakout or Breakdown?🔎 Overview
ALT/USDT has been in a prolonged downtrend since 2024, consistently forming lower highs along a descending trendline. At the same time, buyers continue to defend the support base at 0.028–0.031 USDT, creating a clear Descending Triangle pattern.
Currently, price action is consolidating inside a yellow accumulation box — squeezed between strong demand below and heavy supply above. This kind of compression often ends with a large expansion move, either a breakout or a breakdown.
---
🧩 Technical Structure
Main Pattern: Descending Triangle (typically bearish continuation, but at the end of long trends it can act as a reversal).
Key Demand Zone (support): 0.028–0.031
Key Supply Zone (resistance + trendline): 0.040–0.042
Major Resistance Levels:
0.050 → 0.060 → 0.072 → 0.090 → 0.131 → 0.190 → 0.270 → 0.403 → 0.666
Support Levels if Breakdown:
0.017 → 0.011 → 0.006
---
🚀 Bullish Scenario (Potential Reversal & Breakout)
1. Confirmation: 4D close above 0.042 and a clean breakout from the descending trendline.
2. Entry Trigger: Retest of 0.040–0.042 holding as new support.
3. Short- to Mid-Term Targets:
0.050 (minor resistance)
0.060 (psychological barrier)
0.072–0.090 (major supply zone)
4. Long-Term Targets (if momentum builds): 0.130 → 0.190 → 0.270
5. Invalidation: Price closes back below 0.038–0.040 after breakout.
---
📉 Bearish Scenario (Trend Continuation)
1. Confirmation: 4D close below 0.028 with strong volume.
2. Entry Trigger: Retest of 0.028–0.031 fails to reclaim (acting as resistance).
3. Targets to the Downside:
0.017 (historical support)
0.011 (extreme support)
0.006 (all-time low risk zone)
4. Invalidation: Price reclaims above 0.031 after breakdown.
---
⚖️ Key Notes
Price is in a compression phase — the longer it consolidates inside the box, the stronger the eventual breakout or breakdown.
Watch for false breakouts/breakdowns, especially around 0.028–0.042 key levels.
The 4D timeframe provides stronger confirmation signals; patience is key.
Always manage risk: maintain R:R ≥ 1:2, scale in/out across marked levels.
---
🎯 Conclusion
ALT/USDT is at a critical decision point: Will it break out of its long downtrend and start a bullish reversal, or will sellers dominate again and push the price to fresh lows?
The Descending Triangle acts like a “technical time bomb” — pressure keeps building, and once released, it could result in a significant move.
Traders should closely watch for a confirmed breakout above 0.042 (bullish) or a breakdown below 0.028 (bearish) to determine the next major direction.
#ALTUSDT #ALT #Crypto #CryptoAnalysis #PriceAction #DescendingTriangle #Breakout #SupportResistance
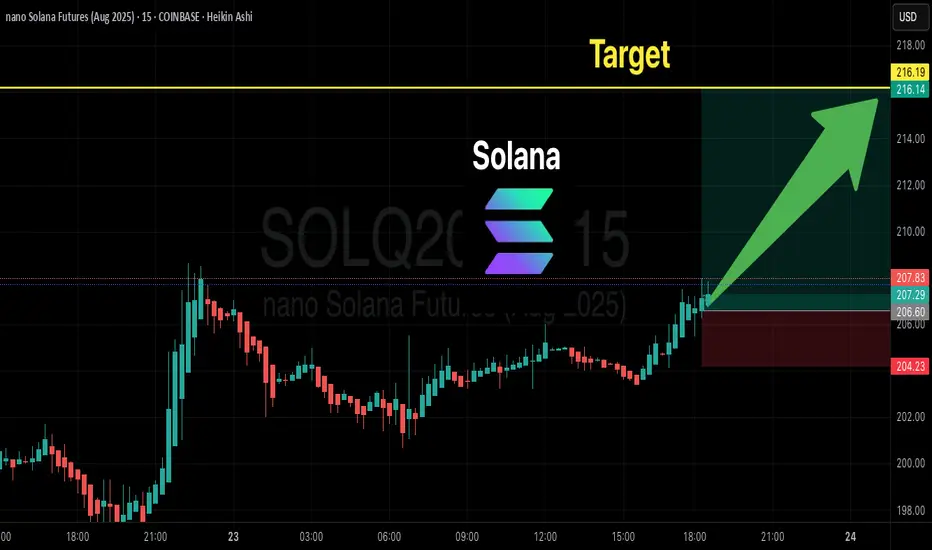
SOLANA (SOL) Ready for Takeoff? | Bullish Trade Setup to $216🚀 SOL (Solana) Crypto Trade Setup – Aug 23, 2025 🚀
🔎 Market Direction
✅ Bias: Mildly Bullish → Price holding above key MAs (EMA9/EMA21/SMA20/SMA50).
⚠️ Caution: Momentum weakening + missing OI data → need tape confirmation (volume/OI).
📊 TRADE DETAILS (Quick View)
🎯 Instrument: SOL
📈 Direction: LONG
💵 Entry: 198.0
🛑 SL: 182.0
🎯 TP: 216.0 (with scaling)
📊 Size: 0.25
💪 Confidence: 70%
⏰ Timing: Market Open
🕒 Signal Time: 2025-08-23 17:09:22
Is Solana about to top?Solana is currently trading just below the target box outlined by the black primary count.
I continue to expect that, over the coming days and weeks, price will eventually reach this zone before any pattern develops that could threaten the red dotted line support areas shown on the below chart.
