SOL 4H – Golden Pocket Rejection, Trend Pressure Still DownSOL continues to trade within a clearly defined bearish structure, with both the daily and 4H trendlines acting as dynamic resistance. The recent push into the 0.618–0.65 Fibonacci golden pocket was rejected cleanly, aligning with prior horizontal resistance near the 144 level — reinforcing this zone as a high-probability supply area.
Price remains capped below the 50 and 100 EMAs, which are now compressing and sloping downward, suggesting downside continuation unless structure is reclaimed. As long as SOL holds below the descending trendlines, rallies are best viewed as corrective rather than impulsive.
On the downside, range support near 123–124 remains the key level to watch. A clean break below this zone would open the door for expansion lower, while any bullish scenario requires a reclaim and hold above the golden pocket and trend resistance — something price has failed to achieve so far.
Momentum shows short-term relief attempts, but trend control remains firmly bearish until proven otherwise.
Solana

Solana ~ TRADE The CHOP: 3 Ways to Make ATLEAST +15%Choppy markets are identified by low volume and sideways trading / range trading. It seems uninteresting in most cases, but you don't have to sit around and wait for the next big impulse wave!
Here are three plays YOU can take during choppy markets:
1) 4H : Short Resistance
Chop trading can be a blessing - the price often touches the same support zone and the same resistance zone 2 - 3 times, before breaking out either way. This means that if you spot your zone early, you could take a short timeframe swing trade. Another way to find a trade is to look for gaps in the candles, for example:
2) 4H : Long Support
South Africa is in a time of turbulence, and the Rand is unpredictable as the effects of G20 settle in. During these times, and this counts for all markets, placing a low risk leveraged long on support is a way to trade the chop:
3) Daily : SPOT Hold to TP Zone
Nothing like a classic low risk trade - but you may need some patience with it! If you're not willing to look at charts all day, or have alarms wake you up at 2:30am to take a trade then this is your style., for example:
What do you do during choppy markets?

SOL in Downtrend: Crypto Winter Hits HardFinally, Solana has broken out of its stagnation.
For a long time, the chart has been building a consolidation in the form of a three-wave WXY correction.
Right now, wave Y is wrapping up. I believe this wave could play out in two scenarios:
🔻• Solana drops from current levels to around 116-118;
🔻• or we see it much lower, in the 108 area.
I’m leaning more toward the second option because the consolidation has been quite prolonged. Plus, as I mentioned earlier, I think we’ve entered a downtrend. Crypto winter has already kicked off and is in full swing.
❌ The invalidation level for my bearish plan is 131.8 — any touch, even briefly, would cancel this scenario.
⚠️Be cautious: don’t trade without stop-losses, and avoid trying to catch the bottom, or you might end up with an unwanted “gift.”
🚀Drop reactions and comments if you want me to post daily updates on Solana.

ETH/USDT | Another try to be bullish? (READ THE CAPTION)As you can see in the Daily chart of ETHUSDT, it went through the supply zone and got rejected there. I expect a fall to the Bullish OB in 2630-2874 zone and then a reaction back to the supply zone to challenge it once more. If it fails to show a reaction and go up after reaching the Bullish OB, I expect a drop to 2117-2328 Demand zone.
Make sure to leave a comment and like the analysis in order to make me motivated to bring you analysis everyday.
Sincerely, Amirali

SOL/USDT | a drop before going bullish again? (READ THE CAPTION)As you can see, SOLUSDT is now consolidating in the main demand zone after a rise to $146 now is trading at 131.50 level. If buyers fail to keep SOL in the demand zone, a further fall is expected to $105 bullish zone, before it regains its bullish momentum with accumulating more liquidity and then goes up high again.
Make sure to like and comment to keep me motivated folks.

SOL/USDT Update — Bullish Trend Structure and Resistance Ahead“🚨 Solana vs Tether: Bullish Heist on SOL/USDT 💰”
📊 Description
Market: SOL/USDT
Bias: Bullish (Swing / Day Trade)
✅ Trade Plan
Entry: 🎯 Any good support / demand area — stay alert & flexible.
Stop Loss: 🛡️ “Thief SL” @ 160.00 USDT — this is my SL, not yours. Manage your own risk!
Targets (TP):
• 🎯 Target 1: 215.00 USDT
• 🏁 Target 2: 240.00 USDT
⚠️ Heads up: Use your discretion. Do not blindly follow my SL/TP — trade responsibly, at your own risk.
🔍 Key Insights / Logic
🚧 Expect resistance & traps near 215–240 — don’t get stuck in overbought zones.
📈 Momentum is building; structure is favorable on retests.
🔊 Watch volume on impulsive moves — rising volume = strength.
🔄 Related pairs / correlation watch:
• BINANCE:SOLBTC — strength vs BTC strengthens the bullish case.
• BINANCE:ETHUSDT — altcoin momentum may carry SOL upward.
• BINANCE:BNBUSDT — BNB strength can support ecosystem flow.
✨ “If you find value in my analysis, a 👍 and 🚀 boost is much appreciated — it helps me share more setups with the community!”
#SOL #SOLUSDT #Solana #CryptoSwing #CryptoDayTrade #AltcoinAnalysis #TradingViewIdeas #CryptoFun

BTC/USDT | a major drop incoming? (READ THE CAPTION)By examining the Daily chart of BTCUSDT, we can see that price has failed to break the 4H FVG at $94000 and has dropped twice from that zone. I expect another try to break through that FVG, but I expect BTC to drop from that zone again and maybe all the way to the bullish OB that is shown in the chart.
If BTC fails to hold above $90000, I expect a drop.

Too Quiet to Be Dead, Too Strong to Ignore401JKUSD is doing exactly what you want to see from a token that’s still early but not fragile. It’s not ancient, but it’s clearly past the danger zone where things just nuke after launch. Price has cooled off without collapsing, which already says a lot. This isn’t a dump chart, it’s a patience chart. The kind where nothing flashy happens for a while and people who understand structure just sit there and let it cook.
The move up already happened once, and instead of giving everything back, price just compressed. Lower highs, tight range, no chaos, no death wicks, no mass exits. That’s not fear, that’s holders chilling. Sellers have tried, but they’re not getting follow-through. Every push down gets absorbed and price just keeps hanging around the same zone like it’s refusing to die. That’s strength, even if it looks boring on the surface.
What really stands out is how clean this is for a newer token. No obvious liquidity grab, no violent retrace, no “oh it’s over” moment. It feels more like quiet accumulation than distribution. The market isn’t screaming, it’s whispering. And those are usually the charts that surprise people later when they least expect it.
The vibe around 401JKUSD matches the chart too. The community isn’t gone, it’s not coping, it’s not panicking. People are still there, still talking, still believing, but without forced hype. That’s honestly one of the most bullish combos in crypto. No overpromising, no exit liquidity energy, just steady conviction and patience.
This setup feels like one of those “you either get bored and leave, or you wait and get paid” situations. Compression like this doesn’t last forever. When it finally decides to move, it usually doesn’t ask for permission. Not saying moon tomorrow, but this is exactly how things look before they stop being quiet.
Overall, 401JKUSD feels alive, healthy, and underestimated. Not cooked, not dumped, not forgotten. Just building, slowly, while most people scroll past it. And in this market, that’s lowkey where the best moves usually start.

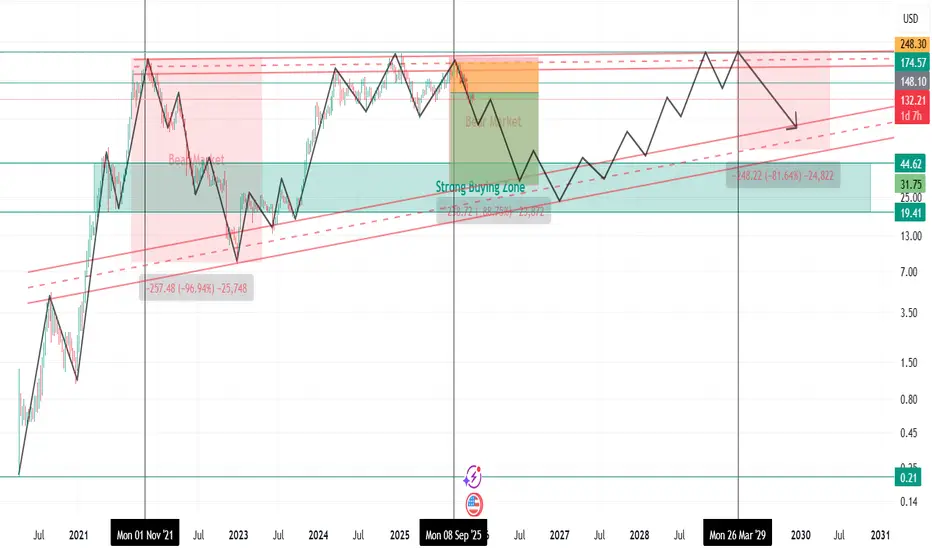
SOLUSD Long-Term Market Cycle Analysis |Bear Market Phase ActiveSolana (SOL) was listed on 10 April 2020 at around $0.21 .
During the 2020–2021 bull market (Altseason Phase-4) , SOL showed an exceptionally strong rally after listing and formed its all-time high near $260 on 6 November 2021 .
From that point, a major bear market started.
Between 7 April 2021 and 29 December 2022 , Solana remained in a clear downtrend , printing continuous lower highs and lower lows.
Price dropped from $260 to nearly $8 , resulting in a −96.9% correction , which is typical for high-beta altcoins during bear cycles.
A new bull market phase began on 30 December 2022 , but according to current market structure and cycle analysis , this bull phase has now ended around 13 September 2025 .
The overall structure has shifted bearish , and Solana is currently trading in a confirmed bear market phase starting from 14 September 2025 .
Key Resistance Zones (Strong Reversal Areas):
$148
$174
$210
These levels are expected to act as major supply zones , where strong selling pressure and reversals are likely.
Bear Market Outlook & Risk Projection
Bear market may extend until October 2026
A further downside move of up to −88% is possible within this cycle
If such a correction occurs, there is an 80% probability that SOL could trade in the $45 – $30 range during September–October 2026
Key Support Zones (Accumulation Areas):
$80
$45
$30
Trading Bias
* Avoid long positions during this phase
* Focus on short setups near resistance zones
* Trade with strict risk management and confirmation
Disclaimer:
This analysis is based on historical market cycles, structure, and technical behavior .
Not financial advice. Always manage risk.
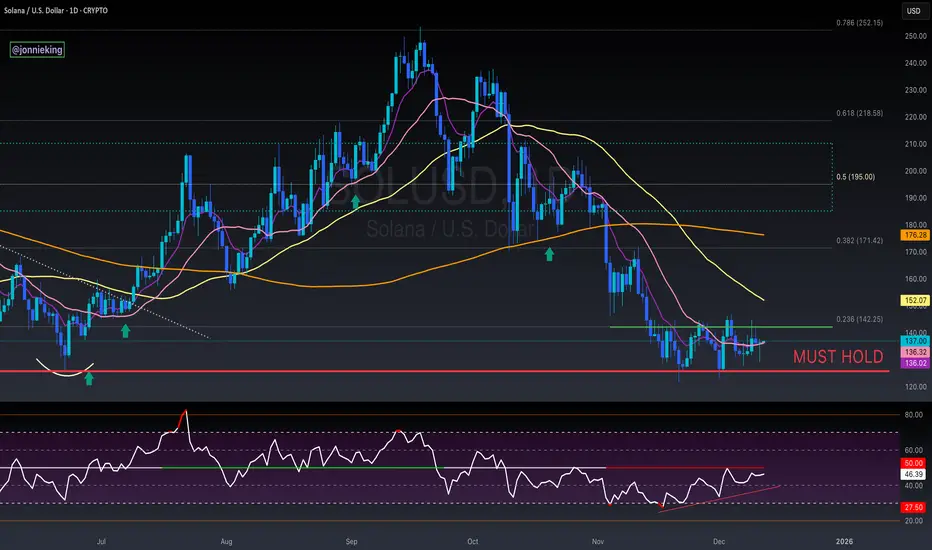
$SOL Stuck In ConsolidationSolana has been stuck in this consolidation range the past month ~$125 - 145
Truly an infliction point for CRYPTOCAP:SOL
a break in either direction should be massive upside or downside.
HOPIUM: bullish divergence appears to be forming on the RSI
Solana Breakpoint just kicked off today, but the market showed very little interest.
Bulls need a huge injection here.
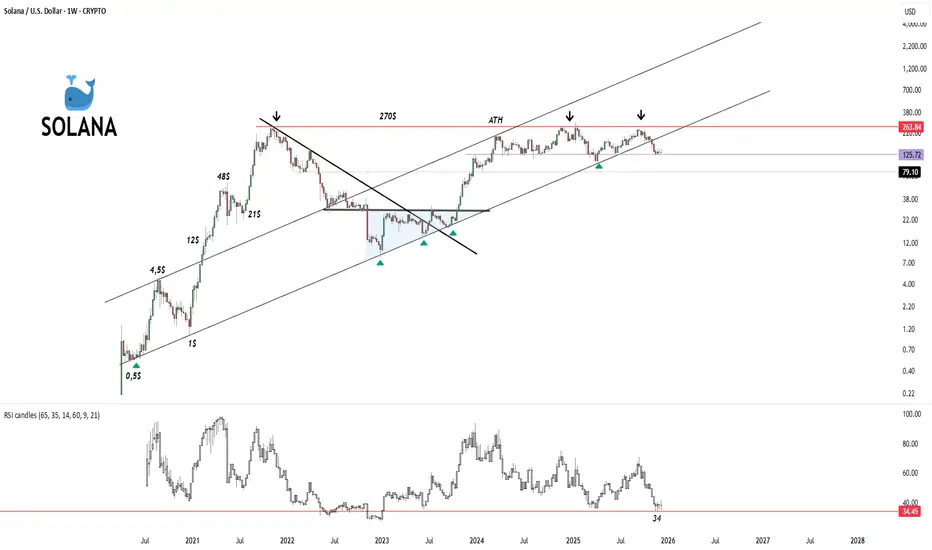
SOLANA MACRO VIEW !
1. Macro Trend: Ascending Channel
The most dominant feature of this chart is the massive ascending parallel channel (the two long black lines sloping upwards).
Long-Term Bullish: Despite volatility, the price has generally trended upward over the last several years, respecting the boundaries of this channel.
Current Status: The price is currently in the lower half of this channel. After being rejected near the top of the channel (around the ATH region), it is retracing downward.
2. Key Support & Resistance Levels
Resistance (The Ceiling):
~$263 - $270 (Red Zone): This is the major historical resistance area, aligned with the All-Time High (ATH). The chart shows three distinct rejections (marked by black downward arrows) in this area over the last year, indicating strong selling pressure whenever SOL approaches this price.
Upper Channel Line: The diagonal upper line acts as dynamic resistance.
Support (The Floor):
~$125.72 (Purple Line): The price is currently trading at $131.50, just above this crucial horizontal support level. This level previously acted as resistance during the recovery phase; holding this line is critical for bulls.
~$79.10 (Dotted Line): If the $125 level fails, the next major historical support is around $79.
Lower Channel Line: The diagonal bottom line is the "trend defender." Every time the price has touched this line (marked by green triangles), it has bounced significantly.
3. Indicator Analysis: RSI (Relative Strength Index)
The bottom panel shows the RSI, which measures momentum.
Approaching Oversold: The RSI is currently at 34.45.
Historical Bounce Zone: The red horizontal line at 34.45 on the RSI panel suggests this is a historical "floor" for momentum. In previous instances (like late 2020 and mid-2022), when the RSI hit this low, the price eventually found a bottom and reversed upward.
Divergence: The RSI is making lower lows, confirming the strength of the current downtrend, but it is reaching a point where sellers often become exhausted.
4. Chart Patterns & Behavior
Rejection at ATH: The "Double Top" or "Triple Top" formation near the $260-$270 level is a bearish reversal pattern, which explains the significant correction SOL is currently experiencing.
Correction Phase: Since hitting the top of the channel, the price has been in a consistent downtrend (lower highs and lower lows on the weekly timeframe).
Summary
The chart depicts a critical decision point for Solana.
The Bearish Case: If the price breaks below the $125 support, it could flush down to the $80 region or the bottom of the channel to find liquidity.
The Bullish Case: The RSI hitting historical support (34) combined with the horizontal price support at $125 suggests a potential bounce area. If buyers step in here, the trend remains intact
-------------------
1. Historical "Bottom" Zone (Momentum Support)
Looking at the bottom RSI panel, whenever the RSI line touches or approaches the 34 level (the red horizontal line), we see that selling pressure tends to exhaust and buyers step in.
Past Examples: Looking at the left side of the chart (late 2020 - early 2021), when the RSI dropped to these low levels, the Solana price found a bottom (around $1) and subsequently launched a massive bullish trend.
Meaning: This level acts as a psychological floor where "bear" (seller) strength runs out and "bulls" (buyers) prepare to take over momentum.
2. Approaching Oversold Signal
RSI typically considers anything below 30 as "oversold." The 34 level is very close to this zone.
The fact that the RSI is currently at 34.45 indicates that the price has dropped sharply and quickly, and this decline is approaching an unsustainable point.
Technically, this is interpreted as a zone where it is "too late to sell, but time to look for buying opportunities."
3. Confluence of Price and RSI
The price is trading at $131.50, trying to hold the $125 support.
The fact that the RSI has hit the 34 support at this exact same moment creates a condition of "Double Support" (support in both price and momentum).
This alignment increases the probability of a reaction bounce from this area.
4. Risk Warning
While the RSI 34 level is strong support, if this level is broken to the downside (meaning RSI slides below 30 into the 20s), it indicates that the downtrend is extremely strong and panic is continuing. In this scenario, there is a risk of the price retracing to the next major support zone around $79.
In Summary: The 34 RSI level is currently a "Make or Break" decision point for Solana. Historical data suggests that this level usually marks a reversal point.
+
SOL/BTC 1w
SOL Dominance
My trading plan is SOL.I will be buying Solana in this price range, aiming to reach $146.
Remember that today is FOMC day, so expect high volatility! Follow your risk management strategy and make your own decisions.
BTC/USDT | Another try before bearish move? (READ THE CAPTION)Good day everyone, Amirali here.
As stated in the previous analysis, BTCUSDT reacted to the supply zone and faced a dropdown and now it is being traded 92,600 level right now. I expect another move to the FVG and seeing how it reacts before making a move. Should it manage to break through the 4H FVG, I expect a move to $96,900, the lower level of daily FVG.

BTC/USDT | Consolidation and fall (READ THE CAPTION!)By examining the 4H chart of BTCUSDT, we can see that BTC is struggling to make a move and is consolidating over the IFVG. If it fails to make a move, a fall to the Demand Zone at 86,600 is possible. However, if it manages to go up, it'll face the FVG at 94,500 level, which then determines whether BTC can make an upwards move or falls again.

TradeCityPro | GRT Testing Key Support in Wide Range Structure👋 Welcome to TradeCity Pro!
In this analysis I want to review the GRT coin for you. One of the DeFi and Solana ecosystem projects that with a market cap of 481 million dollars is ranked 95 on CoinMarketCap.
⏳ 1-hour timeframe
In the 1-hour timeframe, a range box has formed between the zones 0.04491 and 0.4693, and the price has been fluctuating between these two zones for several days.
💥 The zone 0.04491 is a very important support for this coin, and breaking it or being supported from it can start the next movement wave on GRT.
🎯 Since in the higher timeframes like daily and weekly its trend is bearish, then with the break of 0.04491 this trend can continue and we can open a short position with it.
⚡️ If the price is supported from this zone and moves toward the 0.4693 top, we can open a long position by breaking 0.4693.
⚖️ This trigger is the first trigger for a long and is considered a risky trigger. I prefer to wait to get more confirmations for this coin turning bullish.
📊 For now, the main trigger for GRT to turn bullish will be the break of its main resistance at 0.05014.
❌ Disclaimer ❌
Trading futures is highly risky and dangerous. If you're not an expert, these triggers may not be suitable for you. You should first learn risk and capital management. You can also use the educational content from this channel.
Finally, these triggers reflect my personal opinions on price action, and the market may move completely against this analysis. So, do your own research before opening any position.

$SOL Solana is currently in a clear accumulation phase following a strong reaction from the major demand zone.
The horizontal accumulation in this zone indicates both a re-intensification of liquidity and the market gathering energy for the next directional breakout.
As long as the region holds, the structure is positive, and this accumulation will be the key to the next expansion phase.

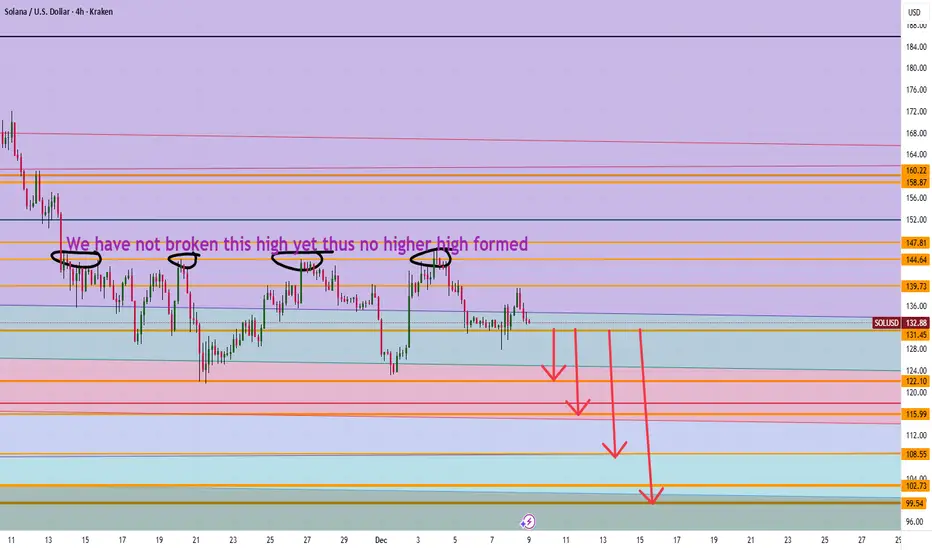
Is Solana heading to $100 It appears we have not made new higher highs in price action on the 4 hour and thus a possible movement down to $108 then 100 levels make sense. However if we can break 139 level then 147 can make sense going up.
Trade Smarter Live Better
Kris
No Clear Path yet...but I Still Favor Higher in Orange or BlackOrange represents a FLAT retracement, whereas Black represents a standard retracement. However, since we have not even traded above the 23.6%, I am still carrying a purple OML count.
Therefore, SOL is about as clear as mud.
Chris

SOL bullish flagSOL has formed a bullish flag, the movement is still within the pattern
Liquidity has formed at the upper level, which the price is more likely to reach
At the bottom of the pattern, an upward movement is observed, as each subsequent bottom is higher than the previous one
Full breakdown with levels and graphs on the website

SOLANA – Key Support Retest, Watching HTF Structure CloselySOL is interacting with one of the most important HTF zones on the chart — the multi-year support level that has repeatedly defined trend transitions. This zone has served as structural support during expansion phases, a breakout base during the run toward all-time highs, and later as a liquidity pool during corrective cycles. Every major deviation from this line has led to a significant move in the opposite direction, making this retest highly meaningful.
Earlier in the chart, support broke and produced a full liquidity sweep, clearing long-position stop clusters before price reclaimed the level and initiated a multi-month advance. The presence of an order block just above this zone adds additional structure: it acted as a redistribution area during the breakdown, and later as the origin of re-accumulation. The recent taps into this region suggest the market is again probing for resting liquidity and responsive buy orders.
Price is now compressing between HTF support and declining 50/100 EMAs, creating a classic higher-timeframe squeeze. EMAs continue to slope downward, signaling a bearish macro trend, but candles remain supported at the long-term horizontal level. This type of compression typically resolves with a decisive expansion once liquidity is absorbed from one side.
The FVG Reaction Zone earlier in the trend shows how SOL tends to return to inefficiencies before choosing direction. The current circled region may represent the same behavior on a larger scale — an attempt to rebalance price before either reclaiming the EMAs or continuing displacement lower.
Momentum indicators add another layer: Stoch RSI is turning upward from deeply oversold territory, suggesting momentum exhaustion on the downside but not yet confirming a trend reversal. Historically on this timeframe, these rotations have preceded multi-week expansions when aligned with structural reclaim, but have also failed when EMAs continued to reject price.
Overall, SOL is positioned at a pivotal HTF decision point:
Hold support → potential base formation and EMA reclaim attempts
Lose support → opens the door to a fresh liquidity sweep into prior structural lows
Until a break in structure or EMA reclaim occurs, this remains a compression zone with elevated importance for trend continuation or reversal.

SOL at a Major Turning Point — Big Move Ahead#SOL
SOL is sitting right on its major weekly support, a zone that has held the chart together multiple times. This area is still acting as the main foundation for the current structure 🧱
If SOL can bounce from here and push back into the resistance zone above, the chart opens the door for a larger continuation toward the upper distribution area 🚀
We can already see how clean the structure becomes once price reclaims that mid-zone.
But if this major support fails to hold, SOL could slide into the deeper accumulation zone — a long-term area where strong buyers usually step in 👀
Right now, SOL is at a critical point. How it reacts here will shape the next big weekly move. Stay patient and follow the reaction, not the prediction ⚡
#SOLUSDT

BRETT/USDT — Approaching the Break Point: Breakout or BreakdownBRETT/USDT is approaching one of its most critical zones of the entire downtrend structure. After months of sustained bearish pressure under a persistent descending trendline, the market is now forming a large falling-wedge compression, a pattern that often precedes strong trend reversals when a breakout is confirmed.
The chart shows a clear dynamic:
Price continues to respect the descending resistance, while the lows begin stabilizing around a gradually flattening support zone. As these two structures narrow, the market is essentially coiling, building pressure before releasing its next major directional move.
The key level to watch is 0.02120.
This isn’t just another resistance—it's the decision point that separates a continuation of the downtrend from the first true structural shift toward bullish territory.
A confirmed daily close above 0.02120, ideally supported by a volume expansion, would mark the first legitimate breakout from the multi-month wedge. If this happens, BRETT opens a wide path toward a series of upside targets:
0.02550 → 0.03050 → 0.03850 → 0.04800 → 0.05600.
Each of these levels represents both structural and psychological checkpoints where momentum tends to accelerate once the wedge breaks.
However, as long as price remains below 0.02120, bears still have control. A strong rejection at this level could trigger renewed sell pressure, dragging price back toward the mid-support zone at 0.013–0.014, or even a retest of the major low around 0.01101 if sentiment weakens.
BRETT is now in its compression phase, often the calm before a significant move. Conservative traders will wait for a confirmed breakout, while aggressive price-action traders may already be watching for early signals in volume and candle structure.
In short:
The market is quiet—
not because it's dead, but because it's preparing for a major decision.
And that decision will be dictated by the battle around 0.02120.
---
Bullish Scenario
If 0.02120 breaks with confirmation:
Trend shifts from bearish → neutral → bullish.
Targets unlock sequentially: 0.0255 → 0.0305 → 0.0385 → 0.0480 → 0.0560.
Expect momentum acceleration as the wedge breakout gains participation.
Validation: strong daily candle close + higher-than-average 7-day volume.
---
Bearish Scenario
If 0.02120 rejects strongly:
Market falls back into distribution.
Downside targets: 0.014 → 0.011.
A breakdown below 0.011 may create new cycle lows and extend the bearish trend.
#BRETT #BRETTUSDT #CryptoAnalysis #BreakoutWatch #FallingWedge #PriceAction #TrendReversal #KeyLevels #CryptoOutlook #MarketStructure

BTC/USDT | Another run over 100K? (READ THE CAPTION!)By analysing the 4H BTCUSDT chart, we can see that a fall into the FVG and dropping all the way too $87700, it has reacted positively and is now being traded at $91700!
We shall see if BTC manages to go through the daily FVG, which is the $96900-$98000 zone. If BTC goes over than zone, another run to over $100K is possible!
This analysis will be updated!
