SOLANA entered into bearish territory, targeting $105.Solana (SOLUSD) closed last week below its 1W MA50 (blue trend-line) for the first time since July 28 2025. This is an extension of the downtrend that started following the September 15 High, which took place right below the Resistance Zone that started back on the November 2021 Cycle Top.
This is a critical Resistance as it rejected the price another 2 times during this Bull Cycle, with the most recent causing the January - April correction to the 1W MA200 (orange trend-line).
Given the huge 1W RSI Bearish Divergence for almost 2 years now (Lower Highs), we expect last week's closing below the 1W MA50 to initiate the bearish extension towards the 1W MA200 (at least) again. Our Target is $105.00.
---
** Please LIKE 👍, FOLLOW ✅, SHARE 🙌 and COMMENT ✍ if you enjoy this idea! Also share your ideas and charts in the comments section below! This is best way to keep it relevant, support us, keep the content here free and allow the idea to reach as many people as possible. **
---
💸💸💸💸💸💸
👇 👇 👇 👇 👇 👇
Solana

SOLUSDT Breaks Out and Aims for $200!BINANCE:SOLUSDT is trading above the 50 EMA on the 4H chart. a strong sign for short-term momentum. If you look closely, it has also broken out of an ascending triangle pattern and is moving upward with solid volume.
We’re expecting a potential upmove from here, with a short-term target around $200.
Always remember to set your stop loss and manage your risk wisely.
BINANCE:SOLUSDT Currently trading at $167
Buy level : Above $165
Stop loss : Below $154
Target 1: 175
Target 2: 200
Max leverage 3x
Always keep stop loss
Follow Our Tradingview Account for More Technical Analysis Updates, | Like, Share and Comment Your thoughts

Important range: 161.79-163.73
Hello, traders!
Follow us to get the latest information quickly.
Have a great day!
-------------------------------------
(SOLUSDT 1D chart)
The HA-Low indicator, the DOM(-60) indicator, and the M-Signal indicator are forming around 161.79-163.73.
Therefore, the key is whether the price can break above the 161.79-163.73 level.
To continue the uptrend by breaking above this key point or level, the StochRSI, TC (Trend Check), and OBV indicators must show upward trends.
- The StochRSI indicator should not have entered the overbought zone.
- The TC (Trend Check) indicator should remain above zero.
- The OBV indicator should remain above the High Line.
Currently, the OBV indicator is near the Low Line, and is in a reversed state with OBV < EMA 2 and EMA 1.
Therefore, if the price breaks above the 161.79-163.73 level, we need to watch for a reversal where OBV > EMA2 and EMA1.
The StochRSI indicator appears to be rising from the oversold zone, and appears to have shifted to a K > D state.
The TC (Trend Check) indicator is trending upward, but since it's below the 0 level, we can see that selling pressure still dominates.
Therefore, if the TC indicator breaks above the 161.79-163.73 level, we should also check to see if it can rise above the 0 level.
If it fails to rise above the 161.79-163.73 level, we should check for support around 126.36.
Since the HA-Low indicator has been created, even if it shows a stepwise downward trend, it is expected to eventually turn upward.
Therefore, we should focus on finding the right time to buy.
-
Thank you for reading to the end.
I wish you successful trading.
--------------------------------------------------

SOL holds up wellCRYPTOCAP:SOL Price continues lower in the channel, a textbook ABC correction so far.
Wave 1 ended with a wedge throw-over. Price has found support above the Fibonacci golden pocket and High Volume Node at the channel's lower boundary. The probability is a continuation to the downside with a target of $140.
📈 Daily RSI tapped oversold with no divergence to suggest a bottom
👉 Continued downside brings up the $112 target, a great buy opportunity
Safe trading

SYRUP/USDT — The Make-or-Break Moment for Bulls?The SYRUP/USDT pair is now at a critical zone — after months of being trapped below the main descending trendline (yellow) since June, price is once again testing a key resistance area around 0.48–0.51 USDT.
Buyer momentum is starting to build, but the market has not yet given a confirmed breakout signal.
The latest candle shows a strong attempt to break above the trendline, but the big question remains:
➡️ Is this the start of a major trend reversal?
or
➡️ Just a classic rejection before another leg down?
---
🔼 Bullish Scenario — “The Breakout We’ve Been Waiting For!”
If price closes daily above 0.5095 and holds that level (successful retest), then the potential for a reversal becomes stronger.
Buyer strength could push the price toward:
🎯 Target 1: 0.5778
🎯 Target 2: 0.6265
🎯 Target 3: 0.6800 (previous swing high)
A confirmed breakout would mark the end of the lower-high structure and open the door to a mid-term uptrend rally.
Additional confirmation: rising volume & solid bullish candle bodies without long upper wicks.
---
🔽 Bearish Scenario — “False Breakout Trap?”
If price fails to break above 0.5095 or gets strongly rejected at the trendline (forming a bearish engulfing / rejection candle), the likelihood of a false breakout becomes high.
In this case, sellers may regain control and drive price lower toward:
⚠️ Support 1: 0.44
⚠️ Support 2: 0.36
⚠️ Support 3: 0.29
Failed breakouts are often followed by quick dumps, as trapped longs (bull traps) rush to exit positions. Beware of long wicks near resistance zones!
---
🧩 Structure & Pattern
The current setup forms a Descending Trendline Breakout Pattern, where the market is attempting to break through a long-term downward pressure line that has held for months.
This structure typically signals either:
Trend Reversal → if the breakout is confirmed.
Downtrend Continuation → if rejection occurs.
In short: A major momentum shift is building — direction awaits confirmation.
---
⚖️ Quick Summary
> “The market stands at a major crossroads. A confirmed breakout could trigger a trend reversal — but failure here might signal another bearish continuation. Stay disciplined, wait for confirmation, and manage risk wisely.”
#SYRUPUSDT #CryptoAnalysis #BreakoutAlert #TechnicalAnalysis #TrendReversal #CryptoTrading #PriceAction #ChartPattern #BullishScenario #BearishScenario #CryptoTrader #AltcoinWatch

SOL aint looking that goodYes, the market structure isn't really broken and it hasn't lost any major support
Yes, it can go higher, a lot higher,
and yes it's been one of the best performers of this cycle .
Which makes it rather risky to short it. But it doesn't change the fact that it:
- Failed to beat critical levels
- By being one of the best performers, retail is loving it.
- Everyone is too comfy in longs.
The level i had for SOL back in last year happened to be the exact bottom, so I'm being cautious here.

Long SolanaTrading Fam,
Received a buy signal from my indicator on Solana the other day. Inside a nice liquidity block, above the 200/350 SMA, and inside a bullish triangle. I'll easily take this trade all day. But with the crypto market continually disappointing, I am not going to risk more than an 8% loss here. Shooting for a target of around 32% profits brings my rrr to a 1:4. Best of luck!
✌️Stew

SOLANA’S SWING — BEARS TAKE WINGHey guys! How was your trading week? Hope you made some great profits!
Solana has completed only half the way to my target at 167 and then reversed — and now I don’t see any signs of continuation to the upside.
In my previous Solana post, I mentioned that my next downside targets are 144 and then 124.
I believe we’ve just finished the correction and are heading toward 144 — at least, that’s what all the signs on the chart are showing me right now.
However, first I expect a dip to 147, as there might be a short-term bounce before further decline.
🎯 Targets:
1️⃣ 147
2️⃣ 144
3️⃣ 124
❌ Invalidation: 158.53
📈 Follow me to stay updated on Solana’s next moves and other crypto setups — don’t miss my updates!
⚠️ Disclaimer:
This is not financial advice. I share my personal market view for educational purposes only. Always do your own research before making trading decisions.

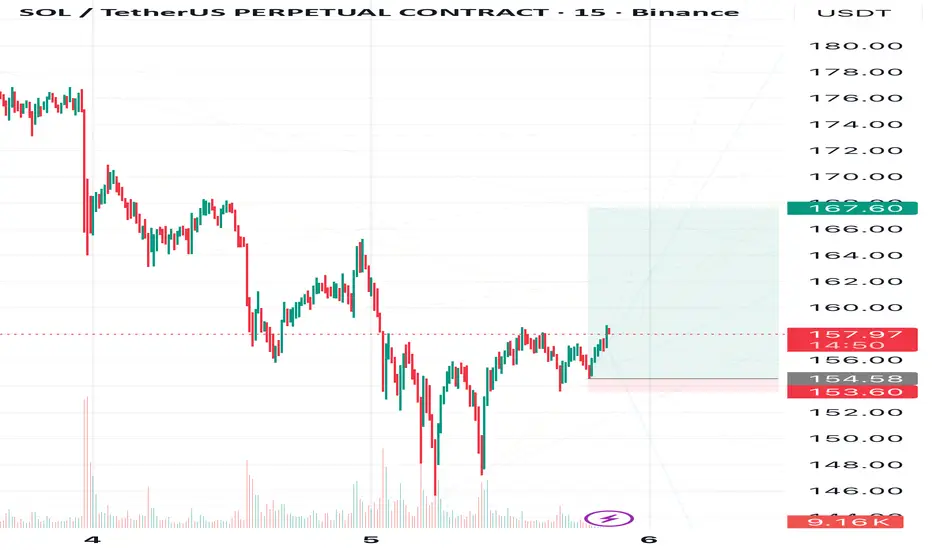
Solana’s pause after the causeHi friends!
How are you doing after the recent Bitcoin–Solana drop?
I hope you didn’t lose anything — and maybe even managed to make some profit instead! 💪
📉 My next targets on the downside are around $144 and $124, but at the moment, Solana seems to be taking a breather from the fall.
After a long and deep decline, even below my earlier expectations, Solana is finally showing some signs of a small correction to 167,60 📈
🎯Target - 167,60
❌Invalidation zone are marked on the chart - 153,60
💬 What do you think — is this the start of a reversal, or just a short pause before another move down? Share your thoughts in the comments. I always enjoy reading your views!
🔔 Follow me to stay updated on Solana and other crypto market analyses.
SPK/USDT – Final Pressure Before a Major Breakout?The market is watching SPK/USDT closely as it approaches a make-or-break zone.
After months of steady decline under a well-defined downtrend line, price is now testing the critical demand zone at 0.034–0.030 — the same level that previously triggered a massive rally earlier this year.
The current structure hints at a potential shift in momentum, but failure to hold this area could invite a deeper sell-off.
---
Pattern & Technical Structure
SPK is shaping a descending wedge / descending triangle pattern — a classic formation that often precedes a trend reversal when sellers lose steam and buyers begin to accumulate around a key support area.
The 0.034–0.030 zone acts as a strong defensive wall.
If this zone holds and price breaks above the yellow downtrend line, it could signal the start of a medium-term bullish reversal.
However, a clean break below this level would confirm bearish continuation, likely driving price down toward the 0.0225 support zone.
---
🟢 Bullish Scenario
A daily candle close above the downtrend line confirms a momentum shift.
Breakout must be supported by increasing volume for validation.
Upside targets:
0.0465 → first key resistance
0.0565 → confirmation of a trend reversal
0.0885 → extended bullish target if sentiment strengthens
Watch for the formation of a higher low post-breakout — a reliable sign of a structural reversal.
---
🔴 Bearish Scenario
A daily close below 0.030 confirms bearish dominance.
Potential for accelerated drop toward 0.0225 (previous major low).
If breakdown occurs on high volume, it may signal the final phase of capitulation before a deeper accumulation phase.
---
💡 Market Outlook & Sentiment
SPK is standing at a major inflection point.
The 0.034–0.030 zone is not just a support range — it’s a battlefield between accumulation and continuation.
A breakout above the trendline would ignite a new chapter in SPK’s price structure, while a breakdown could extend its bearish cycle into year-end.
Smart traders will wait for daily candle + volume confirmation, not emotional reactions.
The next decisive move here could define the market direction for months ahead.
---
🎯 Key Technical Levels
Main Support: 0.034 – 0.030
Next Support: 0.0225
Immediate Resistance: 0.0465
Major Resistances: 0.0565 / 0.0885 / 0.1250
---
🧭 Market Perspective
Although SPK remains within a downtrend, the slowing bearish momentum near this demand zone might indicate early accumulation by smart money.
If a breakout occurs, expect a possible short squeeze rally toward 0.05–0.06 as short positions unwind above the descending trendline.
---
#SPK #SPKUSDT #CryptoAnalysis #Breakout #Downtrend #TechnicalAnalysis #PriceAction #AltcoinSetup #CryptoTrading #ReversalZone #SupportResistance

SOL to $4500?Internet Capital Markets
I believe Solana is going to take over the entire financial system.

LTC/USDT | LTC Holding Steady Above $76 – Bulls Eye $136!By analyzing the #Litecoin chart on the weekly timeframe, we can see that after correcting to $79, the price has started to rise again and is now trading around $88.5.
If Litecoin manages to stay above $76, we can expect further upside momentum. The next potential targets are $97, $106, $118, and $136.
Please support me with your likes and comments to motivate me to share more analysis with you and share your opinion about the possible trend of this chart with me !
Best Regards , Arman Shaban

SOL/USDT | Solana Rebounds From $146 – Bulls Back in Control!By analyzing the #Solana chart on the daily timeframe, we can see that after correcting to $146, the price found strong demand and is now trading around $160.
If Solana manages to hold above the key demand zone of $137–$147, we can expect further upside movement. The medium-term targets are $168, $182, and $196. This analysis will be updated soon.
Please support me with your likes and comments to motivate me to share more analysis with you and share your opinion about the possible trend of this chart with me !
Best Regards , Arman Shaban
ETH/USDT | ETH Under Pressure – Watching Major Demand at $2,500!By analyzing the Ethereum chart on the weekly timeframe, we can see that Ethereum, similar to Bitcoin, has started a correction — dropping as low as $3,050 earlier today and now trading around $3,300.
Key demand zones to watch are at $2,900, $2,700, and especially $2,500, which is a major support area. If price dips into this zone, I expect a strong bullish reaction from buyers. This analysis will be updated once confirmation appears on the chart.
Please support me with your likes and comments to motivate me to share more analysis with you and share your opinion about the possible trend of this chart with me !
Best Regards , Arman Shaban

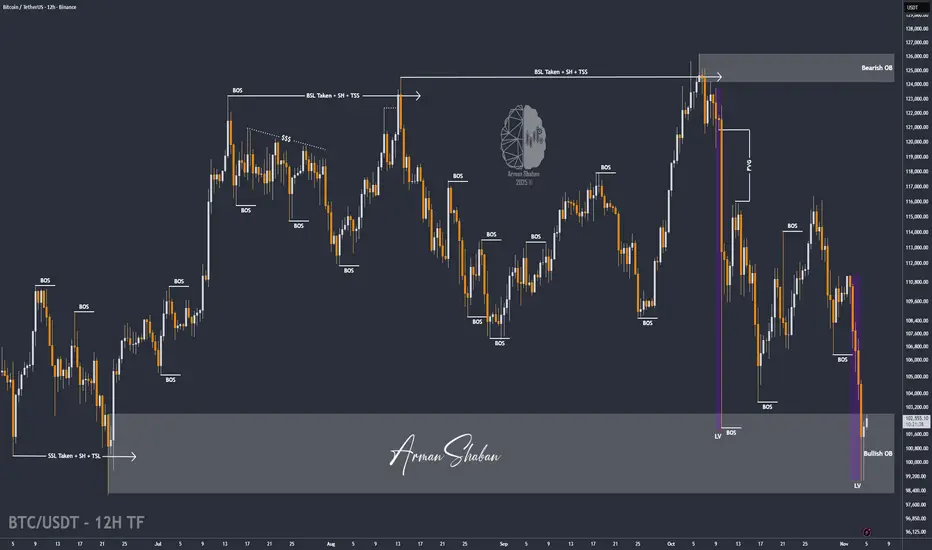
BTC/USDT | Bitcoin Drops 15% in 8 Days – Is Recovery Next?By analyzing the Bitcoin chart on the 12-hour timeframe, we can see that Bitcoin has faced a strong correction over the past few days — dropping nearly 15% from $116,400 to $98,940 in less than eight days.
After sweeping liquidity below $102,000, buying pressure returned, and BTC is now trading around $102,400.
If price manages to break and hold above $104,700, we could see a rebound toward $110K+. Otherwise, Bitcoin may continue its decline toward $95,000.
Please support me with your likes and comments to motivate me to share more analysis with you and share your opinion about the possible trend of this chart with me !
Best Regards , Arman Shaban
XAUUSD:H1:BUYHello traders,
Gold has formed a clear consolidation range. Price is currently reacting to the lower boundary of this range, where a bullish reversal is possible. As long as this zone holds, my bias remains bullish, expecting an upward continuation in line with the current market structure.
This is a personal market outlook.

Solana, more down side to see? SOLUSDT / 1D
Hello Traders, welcome back to another market breakdown.
SOLANA is currently trading within a down trend, maintaining a bearish structure. I'll be looking for a short pull-back higher to get a position.
If the pullback holds and sell mode confirms, the next leg higher could target new lows.
Stay disciplined, wait for the market to come to you, and trade with confidence!
Trade safely,
Trader Leo.

Solana (SOL/USD) – 288-Day Cycle ObservationCycle analysis suggests Solana continues to follow a 288-day dominant rhythm, with clear recurring phases marking key market turns.
Each full cycle has produced a well-defined crest and trough roughly every 9–10 months, maintaining consistent periodicity since late 2023. The most recent cycle low occurred around April 2025, placing the next expected time window for a cyclical low in early 2026.
This study focuses purely on time-based behaviour, independent of price levels. The objective is to identify when key inflection points are most likely to occur, based on the underlying rhythm visible in historical data.
If the 288-day pattern remains intact, Solana may continue in the declining phase of its ongoing cycle, progressing toward its next temporal turning point.
Note: This analysis is for educational and timing research purposes only and does not constitute financial advice.
Until next time!

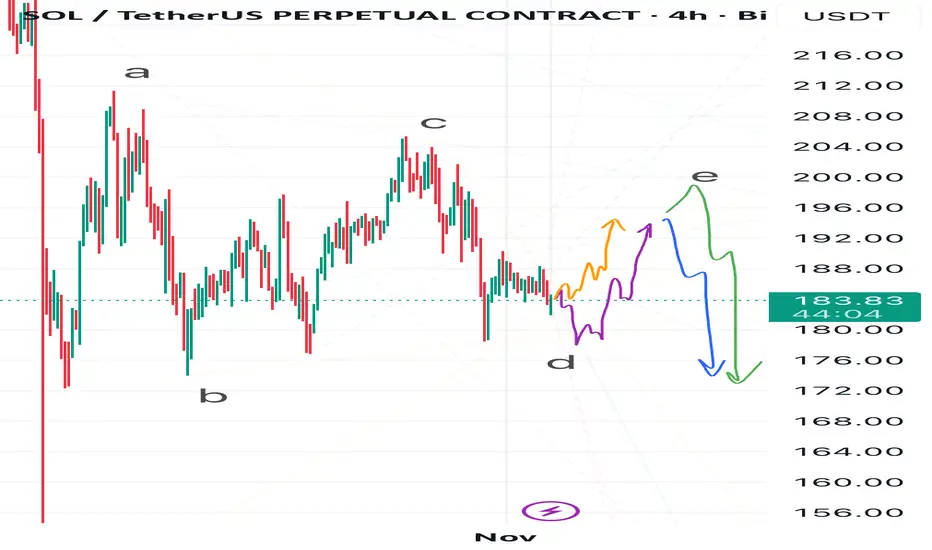
Solana Swing — D or E in the Ring?I see several possible scenarios for Solana at the moment.
In my view, either wave D of the corrective ABCDE triangle has already formed, and the price will follow the orange path, starting to build wave E —
or wave D isn’t complete yet, and Solana might still drop toward 178 or even lower, following the purple path, before beginning wave E.
As for wave E, I also see two possible outcomes:
• The green path, where wave E extends up to around 200,
• Or the blue path, where wave E ends near 194–196, followed by a downside breakout from the triangle, sending Solana toward ~170 or even lower.
💬 Which scenario do you find more likely? Share your thoughts in the comments!
HOME/USDT | $HOME Rebounds Strongly – Bulls Aiming for More GainBy analyzing the #HOME chart on the 1-hour timeframe, we can see that after a pullback to $0.02050, the price started to rise again and successfully hit all three targets — $0.02350, $0.02375, and $0.02410 — delivering over 18% profit.
Currently, #HOME is trading around $0.022, and as long as it holds above $0.0215, we can expect further bullish movement. Hope you made the most out of this setup!
Please support me with your likes and comments to motivate me to share more analysis with you and share your opinion about the possible trend of this chart with me !
Best Regards , Arman Shaban

Solana — Triangle Tale Before the Pale As you might remember from my previous publications, I’m expecting Solana to decline toward 164 and possibly even lower.
At the moment, I’d like to see it around 178, and depending on how the move toward this level develops, I’ll decide on my next steps — which you’ll see in my upcoming updates.
I have a thought that after reaching 178, Solana might move upward first, forming a corrective triangle, and only later drop to 164 or even below.
The invalidation zone for the current plan is marked in red on the chart.
📉 Follow me so you don’t miss my next analyses and scenario updates

SHELL/USDT — at the Critical Zone: Breakout or Deadly Rejection?The price of SHELL is currently walking on a tightrope — right at the confluence between the key support zone of 0.120–0.108 and the descending trendline that has been suppressing every bullish attempt for months.
The chart now enters a make-or-break phase where the next major direction will soon be decided.
---
Technical Structure Overview
The current setup forms a Descending Triangle Pattern, where:
The horizontal base (yellow zone) acts as the last line of defense for buyers,
While the descending trendline serves as the main wall for sellers.
In recent months, every breakout attempt has been rejected from this trendline — but this time, momentum looks stronger, and volume is starting to build up.
---
Bullish Scenario
If the price breaks and closes above 0.142 with strong volume confirmation:
The descending triangle could invalidate and turn into a bullish breakout reversal,
Upside targets will likely be at:
0.185 → 0.205 → 0.226 → 0.260 → 0.330,
Such a move may signal the start of a medium-term trend reversal, especially if the broader crypto market gains strength.
Main confirmation: a daily close above 0.142 followed by a successful retest of the breakout zone as new support.
---
Bearish Scenario
However, if momentum fails and the price gets rejected from the trendline and then breaks below 0.108,
The descending triangle will confirm as a bearish continuation pattern,
The next downside target sits around 0.085–0.075, the previous demand area.
Losing 0.108 support may trigger a panic sell and extend the bearish cycle significantly.
---
Key Takeaway
The 0.120–0.108 zone is the lifeline for buyers right now.
A breakout above it could reshape the entire medium-term structure,
while a breakdown below it could open the path for a deeper selloff.
Moments like this are often golden opportunities for technical traders — where the risk is tightly controlled, but the reward potential is substantial if confirmation appears.
---
Conclusion
SHELL stands at the final equilibrium between buyers and sellers.
The longer price stays under the descending trendline, the more pressure builds up for a decisive move.
Once the breakout or breakdown happens, a volatility expansion is inevitable.
The key is simple:
Watch the daily close, monitor the volume, and follow the confirmation.
#SHELLUSDT #CryptoAnalysis #BreakoutZone #TechnicalAnalysis #DescendingTriangle #CryptoSetup #PriceAction #SupportResistance #TrendReversal #CryptoTrader #ChartOfTheDay

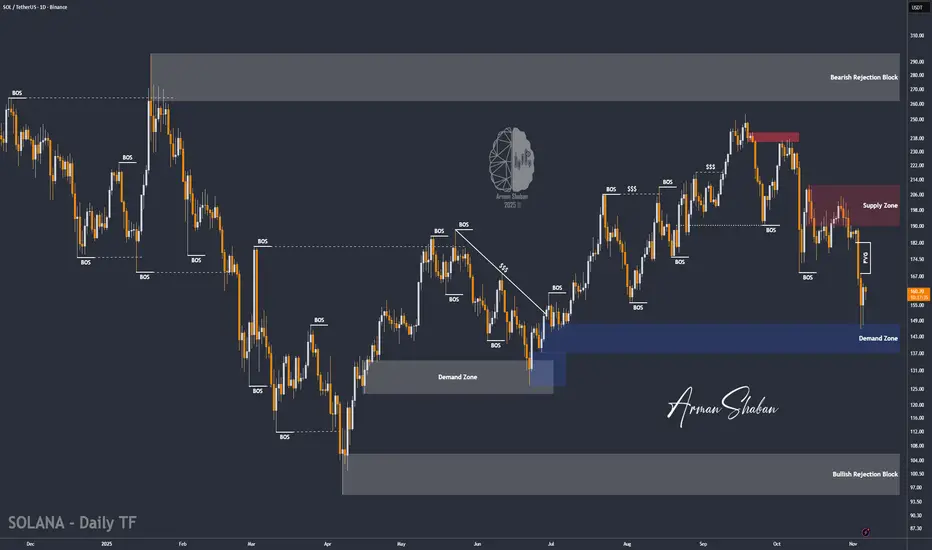
SOLANA Pullback - DailyThis crypto coin has been bearish on the past few days, but it seems as it is a slight pullback towards the demand zone at 160 and 130, before it shoots upwards.
Let us wait and see if we can have a selling opportunities, aiming towards those zones.
