Solana Price Action Turns BearishSolana’s market structure shows a gradual weakening of bullish momentum after an extended upward phase earlier in the month. The asset experienced a breakout that temporarily fueled optimism among traders, but recent sessions indicate a loss of strength as sellers began to dominate. The volume profile suggests that market participants are shifting focus from accumulation to potential distribution, reflecting caution ahead of broader market developments.
Price movements over the past few weeks show that Solana has transitioned from impulsive bullish waves into a corrective environment. This phase reflects uncertainty and potential repositioning by large holders. The consolidation seen mid-cycle indicates a period of balance before a directional move resumes. Current activity implies that short-term liquidity adjustments are occurring, and volatility may expand in the coming sessions.
Market sentiment remains sensitive, with investor confidence depending largely on macroeconomic flows and digital asset liquidity trends. Solana’s performance continues to mirror broader crypto risk appetite, where speculative behavior is being tempered by cautious profit-taking. If momentum continues to decline, extended corrective movement could unfold as participants await new catalysts.
Overall, the report indicates that Solana is entering a controlled phase of distribution where institutional participants may be preparing for another medium-term adjustment in valuation.
Solana

SOLANA HIGH PROBABILITY SETUPS SOON!!!🚨 SOL HIGH PROBABILITY SELL/BUY SETUP 🚨
* Here We Can See Clearly The Next Potential Moves For SOLUSD Coming Hours/Days.
* Keep Your Eyes Close On Your Trading Positions.
* Happy PIP Hunting Traders.
FXKILLA.

BTC/USDT | Bitcoin Bounces Back — Bulls Eyeing $112K Next!By analyzing the #BTC chart on the 12-hour timeframe, we can see that after a healthy correction down to $106,350, Bitcoin has regained its footing and is once again trading near the $110,000 zone. This recovery shows that buyers are still stepping in aggressively to defend key supports and maintain bullish momentum.
As long as BTC stays above $108,600, the bullish outlook remains valid. The next upside target sits around $112,000, where we might see some short-term reaction before another potential correction — likely a setup before the next major bullish wave.

ATH/USDT – at Golden Zone: Massive Rebound or Deep Breakdown?ATH has once again returned to the golden demand zone between 0.0275–0.025, a historically critical area that has triggered multiple price reversals in the past.
This is not just another support level — it’s the last stronghold of buyers on the daily timeframe.
Each time price revisited this region, we saw strong reactions, suggesting institutional accumulation and heavy buying pressure. However, this time the bearish momentum remains dominant, and sellers are still in control on the higher structure.
Interestingly, there’s a long lower wick indicating a liquidity sweep — meaning stop losses were taken below the zone before price quickly recovered. This often signals the beginning of a potential reversal phase.
---
Technical Structure & Key Observations
Overall trend: Still bearish (series of lower highs and lower lows).
Critical zone: 0.0275–0.025 (highlighted yellow box) — major demand area.
Candle structure: Multiple long lower wicks suggesting demand absorption.
Current formation: Sideways consolidation between 0.025–0.031 — breakout on either side will define the next major move.
Key levels to watch:
Immediate resistance: 0.031 – 0.033
Mid resistance: 0.0355 – 0.041
Strong resistance: 0.051 – 0.0645
Next support: 0.0223
---
Bullish Scenario – “Rebound From the Abyss”
A bullish setup will form if price successfully holds above 0.0275–0.025 and prints a strong bullish engulfing candle on the daily close.
That would confirm renewed buyer strength within the major demand area.
🎯 Upside targets:
Target 1: 0.031 (minor breakout confirmation)
Target 2: 0.0355
Target 3: 0.041 — potential trend reversal zone
📉 Invalidation: Daily close below 0.025.
👉 Note: If volume rises along with a solid green candle above 0.031, expect a swift move toward 0.041.
---
Bearish Scenario – “Breakdown Into the Abyss”
If buyers fail to defend the golden zone, a confirmed daily close below 0.025 with strong volume would signal a continuation of the downtrend.
This could trigger another wave of distribution and deeper correction.
🎯 Downside targets:
Target 1: 0.0223 (major local low)
Target 2: Below 0.020 — potential capitulation zone
📈 Invalidation: Strong rebound and daily close back above 0.031.
---
Technical Conclusion
ATH is standing at a make-or-break level that will define its next trend direction.
If the golden demand zone holds, we could see a powerful technical rebound and possible short squeeze.
But if this level gives way, expect a deeper move toward the 0.022 range.
This is the “do or die” moment for ATH bulls.
---
#ATH #ATHUSDT #CryptoAnalysis #TechnicalAnalysis #PriceAction #SupportZone #BreakoutOrBreakdown #CryptoTrading #SmartMoney #LiquiditySweep #SwingTrading

Solana – Saucer Pattern & Key Resistance in FocusSolana is starting to stand out with notable relative strength versus both Bitcoin and Ethereum, and it's catching my attention this week.
✅ Key Support Holding:
Price recently held firm at the $185–$190 support zone, bouncing with strength and attempting to establish a higher low. If this level holds, it would further confirm the uptrend in place since April.
📉 Corrective Phase Since September:
Despite the pullback, the larger trend structure remains bullish. A break above the September high is still needed to confirm trend continuation.
🔵 Multi-Month Saucer Formation:
A rounded base is developing on the daily chart—a classic saucer bottom. If confirmed, this pattern points to major upside potential, with a projected move possibly targeting $500 over time.
⚠️ Watch This Zone Closely:
The $250–$260 resistance area is the key overhead level to clear. A decisive breakout here could trigger a strong rally and confirm the saucer breakout.
📌 Summary:
Solana is showing resilience, building a bullish structure, and forming a significant base. If momentum builds above $260, bulls may take control in a big way.

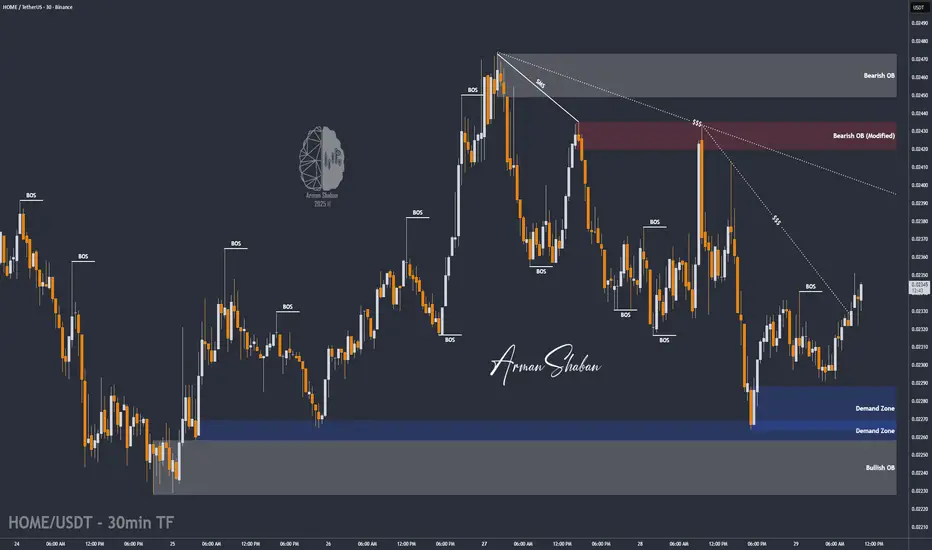
HOME/USDT | $HOME Ready to Pump – Watch $0.0232 Breakout!By analyzing the BME:HOME chart on the 30-minute timeframe, we can see that after a correction down to $0.02265, the price found strong buying interest and is now trading around $0.02338.
If the price manages to hold above $0.02320, we can expect a strong bullish move from this token.
The key demand zone lies between $0.02265–$0.02288, and the next targets for this potential rally are $0.02350, $0.02375, $0.02410, $0.02435, and $0.02450.
Please support me with your likes and comments to motivate me to share more analysis with you and share your opinion about the possible trend of this chart with me !
Best Regards , Arman Shaban
$SOL Solana is sandwiched between the nearly 4-year resistance level of 2021's ATH and the approaching 3-year uptrend.
A squeeze lasting this long typically ends not with a minor breakout but with a major blowout.

SOL: chart on the background of the news!Greetings, colleagues 😊💻
It's time to🔎 look and disassemble the charts coins SOL
A lot of positive news has been 📅 coming out recently , and thus may attract more and more buyers of this asset .
💡 For those who are not engaged in investing, but in extracting medium and short-term profits, I recommend that you always rely on graphical data, rather than on the news background (which is often misleading and forces you to make decisions based on emotions)
🚩 A few technical characteristics of this coin, for those who just came to the market
Ticker: SOL (Solana)
Current price (at the time of publication): 194.53$
Market capitalization: $106.93B (ranked 9th)
⭐ Solana - is a high-performance blockchain built for scalable decentralized applications (dApps), DeFi, NFT and Web3
Average commission: <$0.00025
Consensus: A combination of Proof of History (PoH) + Proof of Stake (PoS)
Network launch: March 2020
Founder: Anatoly Yakovenko (former Qualcomm engineer)
PoH is a unique time—binding mechanism that allows validators to process transactions without constant synchronization. This is Solana's "secret weapon" against Ethereum and other L1s.
↗️ From the latest news:
▶ The first American spot ETF on Solana — Bitwise Solana Staking ETF (BSOL) — on the first day of trading, the fund raised $69.45 million, and its net assets reached $289 million.
The fund's share in Solana's market capitalization was 0.27%.
▶ Fidelity has added support for CRYPTOCAP:SOL for American clients.
▶ VanEck has submitted an updated version of the S-1 application for the spot CRYPTOCAP:SOL ETF.
▶ Grayscale has registered a CRYPTOCAP:SOL ETF in Delaware. This is the first formal step that companies usually take before filing a formal application with the SEC.
📊Technical picture:
🗓 Let's start the analysis with the quarterly chart (3M):
one of the significant advantages is that the price is trading above the annual opening mark ($189.31)
📎 Also, before the last increase, the price removed liquidity from the $ 110 mark and, according to the Fibonacci grid, the correction was in the OTE zone (0.62 - 0.705), which is quite a "healthy" correction for continued growth.
There is a liquidity zone on top - this is ATH - $295.83, which may become the first target for an upward movement.
📎 If we take into account more global goals, then we are guided by the extended Fibonacci grid ... 373$ … 474$
🗓 Weekly chart: the structure is ascending, but the open liquidity points of $155 and $126 are "confusing" from below
🗓 On the daily time frame: the trend is in a downward movement, now we are seeing a correction to the wave of decline, liquidity is forming on both sides
one of the options is to allow the price to go down and collect orders with a shadow, remaining in the range of the trend line (if the price is not held = $ 133)
🤔 I'm still waiting, I need to see the withdrawal of liquidity in order to understand which way the asset is going first
↗️ With growing institutional interest and technological improvements ahead, SOL remains one of the top candidates for the 2025-2026 altseason.
SOL is a mature ecosystem with real demand, infrastructure, and vision. It's wise to keep it in a briefcase. Trade cautiously, but actively 😊
Always calculate the risks and make informed decisions
Good luck to all! 🍀

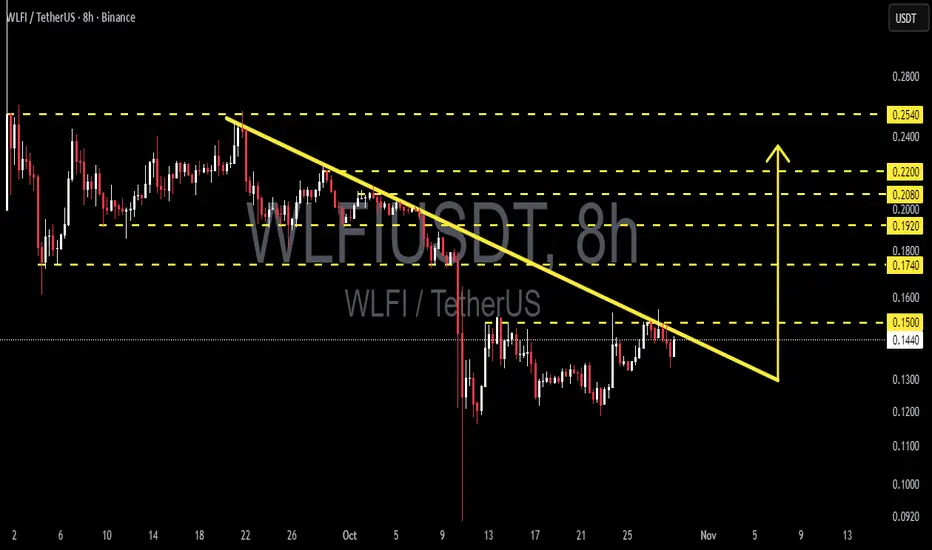
WLFI/USDT — Ready to Explode from Final Consolidation Zone?After weeks of staying under heavy selling pressure within a descending trendline, WLFI is finally showing early signs of life around the 0.13–0.14 demand zone.
The current structure indicates a phase of capitulation followed by silent accumulation, where sellers are losing strength while smart money gradually steps in.
A clear series of lower highs has formed since early October, pressing the price down under a strong descending resistance line (yellow) — and now, price is testing that barrier once again.
A confirmed breakout from this line could mark the beginning of a mid-term trend reversal.
---
Pattern Structure
The chart reveals a descending triangle pattern that’s losing momentum, combined with a potential double-bottom formation near 0.13.
If WLFI manages to break and close above the yellow trendline with solid 8H candle confirmation, the market could shift decisively to bullish territory.
---
Bullish Scenario
If price successfully breaks and closes above 0.1500, momentum will flip in favor of the bulls.
A confirmed breakout could unlock the next targets:
0.1740 – 0.1800 → first breakout zone,
0.1920 – 0.2000 → medium-term expansion area,
0.2200 – 0.2540 → final swing target zone.
Additional confirmation signals:
Rising breakout volume,
8H or daily candle closing firmly above trendline,
RSI & MACD showing early bullish crossover from neutral zone.
This scenario could signal the end of accumulation and the start of a new impulsive wave.
---
Bearish Scenario
If price fails to break the descending line and gets rejected again, the 0.13–0.12 zone becomes the last defense for bulls.
A breakdown below 0.1200 would re-confirm bearish control, targeting:
0.10 as the next liquidity pool,
and possibly 0.0920 if another liquidation spike occurs.
Rejection at the trendline would reinforce seller dominance and continue the broader downtrend until a new higher low forms.
---
Technical Conclusion
WLFI is standing at a make-or-break level, where just one decisive candle can flip the entire structure from bearish to bullish.
This setup is ideal for position traders seeking early accumulation before full breakout confirmation.
However — caution is key.
A breakout without volume is a trap, and a breakdown without confirmation could be a fakeout.
Watch the price reaction closely around the descending trendline, as this is where the next major move will be defined.
---
#WLFI #WLFIUSDT #CryptoBreakout #TrendlineResistance #CryptoAnalysis #ChartPattern #TechnicalAnalysis #CryptoTrading #AltcoinSetup #SwingTrade #SupportResistance #MarketStructure
Solana is still within range... SOL just got some bullish news with a Western Union relationship. Could this be a catalyst that will allow the PA to exit the range? The current upward channel has been respected on the D1, although the trend has been our friend; trendline liquidity has been building. Regardless, the SOL price is at an important POI.

SOLUSDTI think have this chart of BINANCE:SOLUSDT buy because breakout trendline and i see order-block in 194$. Target is end measured move (2-Leg) from low latest swing in 208$.
Please control your risk in any position.

(b) Wave Retracement Almost CompleteEarlier, I had some concern that this (b) wave might be concluding too quickly relative to the preceding (a) wave.
While time symmetry isn’t a strict requirement in Elliott Wave analysis, there are moments when a pattern’s timing simply doesn’t pass the “smell test.”
Now, however, we’re seeing price retrace higher in a manner that better aligns with the duration of wave (a). With price currently sitting just below the (b) wave target box, I’m expecting it to enter that zone imminently to complete this (b) wave retracement.
A subsequent move to a new local low will serve to confirm my analysis.

SOLANA (SOLUSD): High Chance for a Rise
There is a high probability that Solana will continue rising
after a confirmed breakout of a key daily resistance.
The next key structure is 208.8 level.
I think it will be reached soon.
❤️Please, support my work with like, thank you!❤️

AIXB/USDT — Decision Zone: Reversal or Major Breakdown Ahead?
Main Summary:
AIXBT is currently standing at a critical juncture. After a strong rejection from the descending trendline, price has pulled back to retest the key demand zone at 0.0793–0.0690, which also aligns perfectly with the Fibonacci retracement 0.5–0.618 area — a golden pocket where buyers often reappear.
This is the balance point between buyers and sellers, where the next move will define the mid-term direction of this market.
---
Structure & Technical Pattern
Price continues to print lower highs since May, forming a clear descending structure.
The yellow zone 0.0793–0.0690 has acted as a major accumulation base, providing strong reactions in previous cycles.
The pattern resembles a Descending Triangle, where an upside breakout could trigger a reversal, while a downside break could accelerate the bearish continuation.
---
Bullish Scenario — Golden Zone Reversal Setup
Confirmation Required: Daily close above the descending trendline and a breakout above 0.102.
Once confirmed, it would mark the first higher high after a prolonged downtrend — signaling a potential trend reversal.
Upside targets:
1. 0.128 → first psychological resistance & supply zone
2. 0.181 → mid-term target if momentum sustains
3. 0.234 → full measured move from triangle breakout
A strong bullish reaction here could ignite the start of a major reversal phase, especially if supported by increasing volume.
---
Bearish Scenario — Breakdown Confirmation
Confirmation Required: Daily close below 0.0690 with strong selling volume.
This would confirm a descending triangle breakdown, signaling the continuation of the broader downtrend.
Downside target: around 0.046, the previous swing low and last major demand zone.
Losing the yellow block means buyers lose full control, pushing price into an extended distribution phase.
---
Momentum Key Points
Zone 0.0793–0.0690 = Decision Area.
This is where the real battle happens — either as a launchpad for a strong reversal or a trap zone before deeper decline.
Volume and candle reaction in this area will be crucial to confirm direction.
Watch for bullish engulfing, hammer candles, or RSI divergences to confirm potential reversal setups.
---
Conclusion
AIXBT is now entering a “do or die” phase, where the yellow block will determine the next major market structure.
A sustained hold above and breakout through the trendline could spark a strong recovery rally toward 0.128–0.181.
A confirmed breakdown below 0.069 could drag the market back down to 0.046.
This is not just another support — it’s the final accumulation zone before a possible structural shift.
---
#AIXBT #CryptoAnalysis #PriceAction #BreakoutSetup #DescendingTriangle #CryptoTrading #AltcoinWatch #SupportAndResistance #FibRetracement #MarketStructure

Solana Still ChillsSolana continues its correction phase. I am expecting a move toward 190 now
The invalidation zone for this scenario is marked on the chart

SOLANA - SHORT - THE WICK AND THE WHISPERTraders,
This is how I see SOL.
1. The level I care about
For me the key area is 205 to 207. Call it VAH, call it range high, call it supply. It is the place where price got stuffed before and where a lot of trapped memory lives.
What I expect is simple.
Wick it. Slip it. Fade it.
In other words I am looking for SOL to run into that 205 to 207 pocket, spike through it, clean the liquidity resting above those highs, and then fail to hold. That failure after the wick is the trigger for me. That is where I want to be heavy.
If SOL trades above that range high and then instantly falls back inside, that is a swing fail pattern at the high of the range. That is the same story I am hunting on BTC at 117.5k. Liquidity first, conviction second.
2. The downside path
If the wick and slip happens, my downside path is not small. My next meaningful target sits all the way down at 150 to 155. That zone is not just a guess.
It is where the last real demand block sat before we impulsed higher.
It is also where liquidity was never fully re balanced after the violent breakout.
Call it unfinished business. Call it imbalance that still needs to close.
The market eventually comes back to drink from the well it skipped.
3. Now we look under the hood
Price has pushed up into 200 again, yes. But the flow behind the move tells a different story than the candles.
Spot CVD
Spot CVD is bleeding down hard. Real buyers paying cash are not supporting this move. Spot is distributing into strength, not accumulating under it.
Stablecoin margined CVD
Stablecoin perp flow is also down. That means most of the USDT perp side is either taking profit into this move or outright selling into it. They are not chasing it. They are leaning against it.
Coin margined CVD
This is the biggest one. Coin margined CVD is aggressively down. That tells me coin collateral traders are smashing into the bid, basically leaning short into this push.
So ask yourself. If spot is selling, and perp flow is selling, and coin margined flow is selling, then why is SOL still pressing up
4. Open Interest is the answer
Stablecoin OI is grinding up.
Coin margined OI is going vertical.
That means positions are being added at the top, not closed. New size is entering into this level.
When coin margined OI spikes like that while coin margined CVD is negative, the usual read is this. People are opening fresh short exposure using SOL itself as collateral, hitting the bid all the way up, and still not getting the breakdown.
They are trying to fade the move. The move refuses to die. That is short fuel.
This is why SOL can still squeeze into 205 to 207. Shorts are stepping in early, and if you squeeze them one more time you get the wick.
But here is the catch. After the wick and slip, once that last round of shorts is blown and once fresh late longs FOMO in above VAH, there is nothing under price.
Spot buyers did not build a floor.
Perps did not build a floor.
The whole thing is hollow.
That is how you get air pockets.
5. How I am trading this
I am not here to wave a bull flag or scream bear. I am not interested in labels.
I am here to execute around the level.
My plan is to stalk shorts on a failed breakout of that 205 to 207 key. I do not need to nail the exact top tick. I want to see the wick into VAH, and then the rejection back inside the range. That is my trigger to build size.
Will I hold it all the way to 150 No blind loyalty. But that is where I believe the next true re balance sits, and that is the map I am working with.
If SOL breaks through 207, accepts above, and starts building structure above VAH, then this idea is invalid. I step aside. No ego. Survival first.
6. Summary
SOL is approaching a thin ceiling where liquidity sits. I believe we get a final run of that high near 205 to 207, a wick and slip, and then rotation lower. The flow supports that view.
Spot is not bidding.
Perps are selling into the move.
Open Interest is exploding at the highs.
That is the recipe for a squeeze candle into resistance, followed by a rug.
My destination if this plays out is 150 to 155, the next pool of imbalance where the market still owes a visit.
The chart is loud, but the flow is louder.
The candles brag.
The data whispers.
I listen to the whisper.

$SOL - LONG - ABOUT TO POP?Analysis:
Following up on my Oct 14th BTC note — “Wait for arbitrage to balance spot markets” — we’re now nearing that blue box. As BTC approaches equilibrium, I’m eyeing CRYPTOCAP:SOL for a clean long setup.
Here’s why 👇
AVWAP Confluence Zone:
We’ve got the lower band of a HTF auction colliding with the VWAP line from another HTF auction — strong mean reversion and liquidity overlap. (Didn’t draw them out to keep the chart clean.)
Fibonacci Confluence:
A completed AB=CD right at 175.0, perfectly inside the HTF golden pocket (0.618). That’s a key structural retrace aligning with measured move completion.
Bullish Harmonic (4H):
A textbook bull harmonic forming — early signs of reversal pressure building.
No position yet. Waiting for SOL (CME) to close the gap at ~174.7 — that’s my trigger to go long.
🎯 Target: 223 — with a possible sweep of the 229–230 zone where shorts are stacked. Expecting a short squeeze flush through that region.
Seeing solid order flow confluence across the board.
Will update this post as things unfold.

SOL at resistance, has work to doCRYPTOCAP:SOL is at major resistance High Volume Node just below the daily pivot.
The local trend has flipped bullish but a strong move may not be on the cards until we climb the wall of worry through resistance. Price is riding the daily 200EMA.
Daily RSI did not print bullish divergence or reach oversold.
Safe trading

$SOL Bullish Engulfing Weekly CloseSolana is looking good here 👍🏽
Reclaimed the 50WMA and closed above the 50% Gann Level.
Note the Bullish Engulfing candle for the Weekly Close.
However CRYPTOCAP:SOL Still trading within the DANGER ZONE ⚠️
Need these next couple weeks to close outside of this POI.
You can see the Liberation Day lower trendline still remains intact for support and we had the Bullish Cross a few weeks ago on the 20 / 50 WMA 🤓

Solana - We have to see new all time highs!🚀Solana ( CRYPTO:SOLUSD ) has to break out:
🔎Analysis summary:
Over the course of the past couple of months, Solana has been rallying another +100%. This rally ultimately resulted in another, third retested of the previous all time high. And if Solana now creates bullish confirmation, we can all expect new all time highs very soon.
📝Levels to watch:
$250
SwingTraderPhil
SwingTrading.Simplified. | Investing.Simplified. | #LONGTERMVISION

SOLANA (SOL): Wave 5 awaits – upward momentum or bear trap?SOLANA (SOL): Wave 5 awaits – upward momentum or bear trap?
Weekly Scenarios
Bullish scenario: Price holds the ~$185-190 zone, breaks resistance at ~$260 → wave 5 starts up, target is approximately ~$300+.
Consolidation: Price moves in the ~$185-260 range without a significant breakout; energy is accumulating, waiting for a signal.
Bearish scenario: Break of support at ~$185 with volume → confirmation of the start of wave C correction → possible decline to ~$150-160.
✅ Conclusion
On the weekly timeframe, SOL is at a crossroads:
If it holds above ~$185 and manages to break ~$260, the chance of a strong rally increases.
If support fails to hold, the risk of a correction remains. Traders should watch for price reaction on levels, volume, and confirmation of wave structure before taking a position.

$SOL / Solana to $300+?All things suggest a strong launch opportunity for Solana.
If $200 holds, it's a good accumulation level. RSI is at 50, in the Fibonacci Golden Zone, with a weekly demand level, and the $250 weekly resistance/supply level has been tested 3+ times.
Solana bulls have a solid chance to reach $300+ short-term, especially with potential ETF filings.

Is A Bullish Crossover Next For Solana Price?Solana’s price stands at $187 at the time of writing, holding firm above the $183 support level. The altcoin remains range-bound, struggling to break through the key $192 resistance. However, price stability above support suggests growing resilience in the face of selling pressure.
If Solana’s bullish indicators gain traction, the price could climb past $192 and target $200 or higher. Strengthening support levels combined with improving investor sentiment could help SOL establish a sustainable uptrend.
Conversely, if momentum fails to build, Solana may drop below $183 to test $175. A further decline could extend losses toward $163. This would effectively invalidating the bullish outlook and signaling continued market weakness.
