#SOL/USDT may continue its trend after correction#SOL
The price is moving in a descending channel on the 1-hour timeframe. It has reached the upper limit and is heading towards breaking it. A retest of the upper limit is expected.
We have an upward trend on the RSI indicator, which has reached near the upper limit. A downward reversal is expected.
There is a key support zone in green at 139.70. The price has bounced from this zone multiple times and is expected to bounce again.
We have a trend of consolidation above the 100-period moving average, as we are moving close to it. This supports a downward move towards touching this level.
Entry price: 137.70
First target: 136.15
Second target: 135.09
Third target: 133.66
Stop loss above the resistance zone in green.
Don't forget a simple thing: money management.
For inquiries, please leave a comment.
Thank you.
SOLUSD

$SOL 1D update: Things are looking up SOL is still in the process of breaking out of the broader downtrend, even though the move hasn’t been clean or impulsive yet.
After spending months respecting the descending channel, price has now pushed out of the lower boundary and is holding above the $125 area, which was previously acting as key support inside the downtrend. That’s an important structural shift. Instead of making fresh lower lows, SOL is now forming higher lows and building above former demand.
The recent push toward the $135–140 area shows buyers are willing to step in earlier, rather than waiting for a full return to the lower channel. While price is still below major resistance near $160–180, the character has changed from trend continuation to basing and early breakout behavior.
This doesn’t mean SOL is in a confirmed uptrend yet. Breakouts from long downtrends are often messy, with overlap, pullbacks, and false starts. What matters is that downside follow-through has stalled and price is no longer accelerating lower.
As long as SOL continues to hold above the $125 level and avoids slipping back into the channel, the bias remains that this is an early trend transition rather than just another dead cat bounce. The next key test will be whether this breakout can hold on retests and eventually reclaim higher resistance, but structurally, SOL is still breaking out of the downtrend.

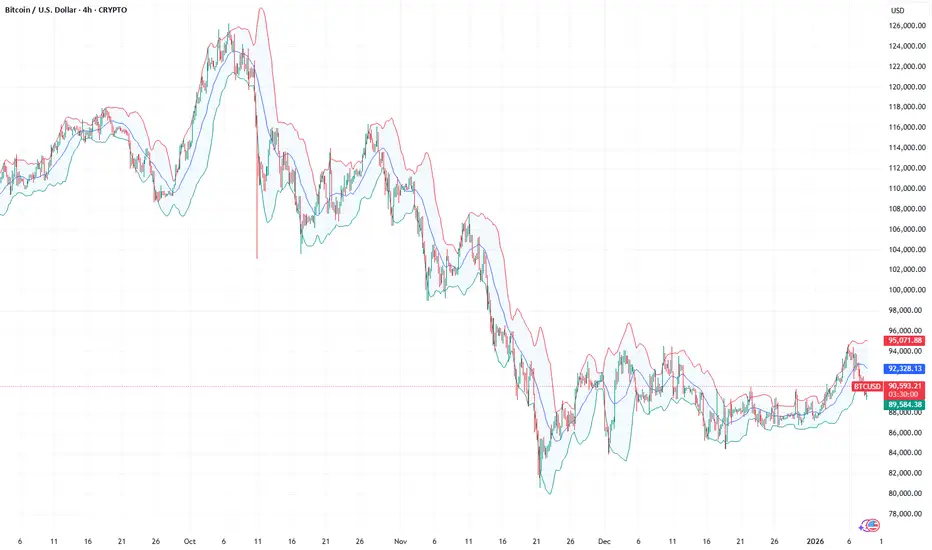
Crypto is charging higher again: BTCUSD and the pack are ready In December, our clients most actively traded cryptocurrencies such as BTCUSD, ETHUSD, BNBUSD, SOLUSD, and XRPUSD —and these instruments delivered the highest share of profitable trades. Today’s review focuses on the crypto market: demand from major investors, news from large corporations, and the ongoing development of leading blockchain platforms are setting the tone for early 2026.
Growth outlook for cryptocurrencies in Q1 2026:
BTCUSD — strong interest from institutional investors and the expansion of exchange-traded crypto products support demand even during pullbacks.
ETHUSD — increasing network usage and progress toward faster, cheaper transfers create room for strengthening in a calm external environment.
SOLUSD — active project development and rising attention from major market participants point to further upside potential if news remains positive.
BNBUSD — ecosystem service growth and infrastructure upgrades provide support, though price moves may be sharp.
TONUSD — expansion of Telegram-related services and user tools may drive additional demand if adoption momentum continues.
FreshForex analysts believe that in the coming months the market will be shaped by three key factors: overall global market sentiment, inflows and outflows into public crypto instruments, and news around the development of major networks. Even under a positive scenario, prudent risk limits should be set in advance.
TOP Altcoins for 2026 ~ ALTSHappy New Year 🥂
Here's a quick glance at my TOP 5 alts of choice for 2026, and why.
💭Injective (INJ)
Fast, interoperable DeFi infrastructure. Active development and a clear use-case in scaling decentralized trading.
💭Illuvium (ILV)
Prioritizes high-quality gameplay and steady development, backed by a solid revenue model.
💭Solana
ETH competitor, SOL is approaching some great buy zones that can have big bounces:
💭Origin Protocol (OGN)
Focuses on tokenized commerce and NFT marketplaces, making it easy for creators and brands to build decentralized storefronts.
💭Audius (AUDIO)
Decentralized music-streaming platform giving artists more control and growing consistently in real-world adoption.
Which alts are you watching for this year?

SOLANA OBAMA - pamp itSOLANA OBAMA - pamp it
levels to watch for in case we are just being bull trapped
basically ; if the price action ledges out here and then pukes ,, well ya know whats up and wait for red fractal tripple bottom to try to buy again with tight stop. but those two negative options suck pretty bad, would be a multi year bear again. just accumulate btc if thats the case as we've seen the obvious change in the ALT market.
or
valhalla awaits us. and the whole 'alt season is dead' trap was sprung very well.
this cycle has been hard. gl

SOLUSD: Deciphering the Neutral Zone with Intrabar⚠️ ANALYTICAL METHODOLOGY: READ FIRST ⚠️
This analysis utilizes a 100% VOLUME-BASED ALGORITHM powered by Lower Timeframe (LTF) intrabar data . unlike standard Price Action, we are scanning the internal structure of every candle to pinpoint liquidity.
📊 DATA PRECISION USED:
For this specific SOL/USD reading, the system is running on 1S (1-Second) data resolution. This ensures that the Support/Resistance zones shown below are derived from real-time volume distribution, not just visual highs and lows.
💡 WHY THIS MATTERS:
Standard charts hide the battle between buyers and sellers. By using intrabar volume geometry, we filter out the noise and only focus on where the "Smart Money" is actually defending positions.
SOLUSD: Trapped in the "Dead Center" Liquidity Void 📉
Most traders guess where the breakout will happen. The math suggests we are currently in a "No-Trade Zone."
Using the DSRTL-ML engine, we have identified a "Neutral / Choppy" regime (S3-D3 State).The price is literally sitting in the dead center of the structure, sandwiched between dynamic buying and selling pressure.
1. The Structural Squeeze
The market is compressing. We are seeing a classic "Energy Build-up."
The algorithm flags this area as Low Probability for trend setups. Why? Because we are far from the "Iron Floor" (Value) and equally far from the "Iron Fortress" .
📐 CRITICAL LIQUIDITY LEVELS:
Static Resistance (Supply Wall):
Dynamic Control Zone (Immediate Cap):
Static Support (Demand Floor):
2. Order Flow & Delta Divergence
Total Volume: 43.24K
Net Delta: -10.45K (Sellers Dominant)
The Trap: Although price is trading ABOVE the Point of Control (POC at 133.08), the negative Delta indicates that every small rally is being sold into. The buyers are not aggressive here; they are merely absorbing. This divergence often precedes a liquidity flush or a fake-out.
🧠 The Smart Play (Scenario Logic)
We do not predict; we react to confirmed structure breaches.
🐂 Bull Confirmation: Price must reclaim 142.69 with positive Delta to prove buyers have absorbed the supply.
🐻 Bear Confirmation: A loss of the dynamic floor at 135.95 validates the negative delta and likely targets the 131.00 demand zone.
Current Verdict: Patience. Let the liquidity reveal its hand before committing capital.
⚠️ DISCLAIMER:
This reading is generated entirely by the algorithmic calculations and outputs of DSRTL-ML; it is absolutely NOT financial advice . Always Do Your Own Research (DYOR).
⏱️ REAL-TIME DATA SNAPSHOT:
Please note that the Volume, Delta, and Level figures presented below are captured at the exact moment of analysis . Since the DSRTL-ML algorithm processes live intrabar ticks in real-time, these numbers will naturally evolve and update on your chart as new market activity occurs from the time of writing to publication.

#SOL/USDT Final Liquidity Zone Before Expansion ?#SOL
The price is moving in a descending channel on the 1-hour timeframe. It has reached the lower boundary and is heading towards a breakout, with a retest of the upper boundary expected.
We are seeing a bearish bias in the Relative Strength Index (RSI), which has reached near the lower boundary, and an upward bounce is expected.
There is a key support zone in green at 128, and the price has bounced from this level several times. Another bounce is expected.
We are seeing a trend towards stabilizing above the 100-period moving average, which we are approaching, supporting the upward trend.
Entry Price: 133
First Target: 134
Second Target: 137
Third Target: 140
Remember a simple principle: Money Management.
Place your stop-loss order below the green support zone.
For any questions, please leave a comment.
Thank you.

SOLANA: This Gigantic Formation is Going to Blast Through Roof.Hello There,
welcome to my new analysis about SOLANA on the weekly timeframe perspective. As a believer in the cryptocurrency revolution, I am sure the adoption of large-scale crypto networks is going to spread continuously throughout this year. We can already see more and more financial intermediaries adopting cryptocurrencies like SOLANA. This is also reflected by the SOLUSD price and crucial adoption factors such as Western Union also adopting this network. In my analysis I focus on the underlying factors that drive these changes in the financial ecosystem.
Especially at the beginning of 2026, there was a record high of whales accumulating more and more SOLANA to prepare for the major market disruptions that are likely to happen. Such actions are always made before the big public gets aware of it. Therefore, it is highly important, as a trader in the market, to appropriately prepare for any such significant and influential developments. Currently, SOLANA is already within the top 10 of cryptocurrency market cap coins. This can quickly change when more and more whales move into this market to push the bullish buttons before the large public gets aware of it.
The whitepaper already states that SOLANA is a high-performance blockchain that was designed to process up to 710,000 transactions per second, though real-world throughput typically ranges from 2,000 to 3,000 TPS. It is not unlikely that under such conditions more and more adoptions from smart money will happen in the next times. These factors are crucial for examining the actual real price action outcomes setting up for SOLANA at this moment. If this adoption goes forward in the upcoming times, we will see other whales also moving into the coin.
From a technical perspective, SOLANA is trading within this gigantic uptrend situation in which it is forming several crucial technical formations. The most important one currently is this massive bull flag formation. This formation is already in the middle to later stages of completion. The wave count within the formation is already forming the final wave C. This completion of the wave count will reach strong supports within the bullish confluence zone marked in my chart, supported by the lower boundary supports as well as the 200-MA.
Once SOLANA bounces in this area, it will be a highly determining move and crucial for the whole upcoming prospect, which should be expected. Especially when there are a lot of bullish acquisitions and the large wallets moving into the market, we can be sure that a bounce from this zone will likely confirm the whole bull flag formation. Such a confirmation will drive the price action into spheres never seen before. When considering an altcoin-focused approach in the market, this will definitely be an important underlying setup to consider.
With this being said, it is great to consider the important trades upcoming.
We will watch out for the main market evolutions.
Thank you very much for watching!

SOL 1D Update: Looking good here I was initially leaning toward SOL pushing lower within the broader descending channel, especially with price continuing to respect the downtrend structure and failing to reclaim prior resistance. The expectation was for another sweep toward lower channel support before any meaningful bounce.
However, price action is starting to shift. Instead of continuation lower, SOL is showing responsive buying around the $125 area and is now pushing higher, breaking the short-term pattern of lower highs. This move looks more impulsive than the prior bounces, which suggests demand is stepping in earlier than expected.
The $125–130 zone is acting as an important pivot. Holding above this area keeps the door open for a larger relief move. If this push sustains, the next area to watch is the mid-channel and then the $160–180 region, which lines up with prior consolidation and resistance.
While the higher timeframe downtrend has not been fully invalidated yet, this pump shifts the short-term bias from expecting downside continuation to respecting the possibility of a deeper corrective rally. I’m adjusting with price and watching to see if this move can build acceptance above support rather than fade immediately.
This is a good reminder that strong trends can end with a whimper, not a final flush, and price strength should be respected when it shows up.

Solana: Edging HigherSOL has edged slightly higher, but remains well within our green Target Zone ($155.80 – $113.20). If it hasn’t already, the altcoin is expected to establish the low for wave ii in orange within this range before turning higher. The subsequent wave iii in orange should then drive price above the resistance levels at $249.68 and $295.31.

#SOL/USDT Final Liquidity Zone Before Expansion ?#SOL
The price is moving in a descending channel on the 1-hour timeframe. It has reached the lower boundary and is heading towards breaking above it, with a retest of the upper boundary expected.
We have a downtrend on the RSI indicator, which has reached near the lower boundary, and an upward rebound is expected.
There is a key support zone in green at 122.00. The price has bounced from this level multiple times and is expected to bounce again.
We have a trend towards stability above the 100-period moving average, as we are moving close to it, which supports the upward movement.
Entry price: 124.00
First target: 125.48
Second target: 127.15
Third target: 129.63
Stop loss: Below the support zone in green.
Don't forget a simple thing: capital management.
For inquiries, please leave a comment.
Thank you.

The process itself remains the most valuable guideOne of the aspects of this form of analysis that I genuinely enjoy, but which I know can be frustrating for others, is that there are moments when the pattern appears to be communicating something very clearly…yet price refuses to cooperate with that viewpoint. When that happens, my focus immediately shifts to why. What am I missing? That process doesn’t disillusion me, it fascinates me. Because sooner rather than later, the market provides the answer, and every time it does, there is something to be learned.
In the case of Solana, the pattern appears to be saying exactly what the arrows on the chart are suggesting. And yet, I currently have no price-based evidence to support that interpretation. Price has not advanced in any meaningful way, has not challenged important resistance areas, and has not begun to break apart the broader downside structure. There’s a disconnect that cannot be ignored.
A misinterpretation of the pattern in my analysis?
A lack of patience on my part? My process is to become self-inquisitive.
Structurally, I can identify all the constituent waves necessary to consider the decline complete, and price has reached the Fibonacci extensions that would typically signal the end of such a pattern. Under normal circumstances, that would already have produced a response to the upside.
So, for now, patience is required. In the days ahead, the market will either reveal why this pattern is not cooperating with my current perspective, or it will begin to deliver the subdivisions that should accompany a completed decline. Either outcome provides clarity. Until then, the process itself remains the most valuable guide.

SOL/USDT | What is Solana doing? (READ THE CAPTION)By analysing the daily chart of SOL CRYPTOCAP:SOL , we can see that it is still struggling to make a move back up, currently being traded at 123.50. If this continues, a drop to 105 doesn't seem that far off.

#SOL/USDT Final Liquidity Zone Before Expansion ?#SOL
The price is moving in a descending channel on the 1-hour timeframe. It has reached the lower boundary and is heading towards breaking above it, with a retest of the upper boundary expected.
We have a downtrend on the RSI indicator, which has reached near the lower boundary, and an upward rebound is expected.
There is a key support zone in green at 123.66. The price has bounced from this zone multiple times and is expected to bounce again.
We have a trend towards stability above the 100-period moving average, as we are moving close to it, which supports the upward movement.
Entry price: 126.20
First target: 127.76
Second target: 129.00
Third target: 130.74
Don't forget a simple thing: money management.
Place your stop-loss below the support zone in green.
For any questions, please leave a comment.
Thank you.

SOLUSDT – Double Top Rejection Signals Short-Term WeaknessHi!
SOLUSDT is showing clear signs of short-term exhaustion on the chart. Price was rejected twice from the same resistance zone around 125, forming a classic double top structure. After the second rejection, the ascending trendline that supported the recent move was broken, confirming a loss of bullish momentum. This breakdown increases the probability of a corrective move toward the horizontal support near 122.3–122.0, which aligns with prior structure. As long as the price remains below the broken trendline and resistance zone, downside pressure is favored. A reclaim of the trendline would invalidate this bearish scenario.

SOL: The Equilibrium StandoffSOL sits at $124.66 in pure equilibrium, not discount, not premium, just stuck. The market structure isn't signaling a breakout; it's signaling a standoff. With volume 41% below average and momentum indicators in conflict, this is a wait-for-resolution setup, not a chase-the-move trade.
1. THE TECHNICAL REALITY 📉
• Price trapped between discount zone ($124.25) and premium ($139.33)
• Bearish swing trend with weak conviction (ADX only 18.1)
• Wick analysis shows war zone: 46.7% lower wick (support) vs 42.7% upper wick (rejection)
• Volume at $1.47M vs $2.51M average, smart money isn't showing up
2. THE INDICATORS ⚖️
Bearish Signals:
• Stochastic screaming overbought at 90.3
• Bearish order block overhead at $128.74 (key supply zone)
• Volume 41% below normal, no institutional confirmation
Bullish Signals:
• MACD just flipped bullish (0.2262 vs -0.0791)
• RSI neutral at 60.8
• MFI neutral at 48.8
The Conflict:
Stochastic overbought while MFI stays neutral, that's momentum divergence. When indicators can't agree, the current move is running on fumes, not fuel.
3. THE TRADE SETUP 🎯
🔴 Scenario A: Rejection & Retest (Higher Probability)
• Trigger: Rejection at $128.74 bearish OB
• Entry: Breakdown below $123.42 (FVG fill)
• Target: $119.15 swing low support
• Stop: 4H close above $128.74
🟢 Scenario B: Structure Flip (Lower Probability)
• Trigger: Reclaim of $139.33 premium zone
• Entry: 4H close above $128.74
• Target: Change of Character (CHoCH) bullish
• Invalidation: Rejection back below $128.74
MY VERDICT
62% confidence bearish lean. Setup favors rejection at resistance into support retest, but weak trend strength (ADX 18.1) means this could chop sideways before resolving. I'm not forcing trades in low-conviction environments, risk management is the difference between chess and checkers.

SOL at a Critical Decision Zone – Double Bottom vs ResistanceHi!
Market Context
Solana is trading near a key decision zone after a corrective move from recent highs. Price action suggests short-term bullish attempts, but the broader structure remains mixed.
Technical Structure
Broken Trendline: The descending trendline from the recent high has been broken, indicating a short-term momentum shift.
Double Bottom Formation: A clear double bottom has formed near the $121–$122 area, showing strong buyer reaction and short-term demand.
Support Zone: The horizontal support around $120 remains critical. This level has been tested multiple times and is still holding.
Resistance & Scenarios
Bullish Scenario: If price holds above $120 and continues higher, a move toward the $125–$126 supply zone is likely. This area previously acted as resistance and may trigger selling pressure.
Bearish Scenario: Failure to sustain above current levels, followed by a breakdown below $120, would invalidate the double bottom and open the door for a deeper correction.
Conclusion
While short-term bullish signs are present, confirmation requires continuation above resistance. Until then, SOL remains in a sensitive zone where both scenarios are possible. Risk management is essential around these levels.

SOL - BEARISH ACCUMULATION ?? #SOL - Bearish accumulation daily? 🚨
NYSE:PUMP faces intensified legal troubles with a class-action lawsuit alleging insider trading and market manipulation.
CRYPTOCAP:SOL - FUD is still ongoing following the bad news for the ecosystem. 📉
Current price of #SOL remains pretty bearish on a daily basis & stuck under key previous support!🚨📉
Another bearish break under 120 could lead to a sharp dump & exit liquidity toward the 102 - $ 100 monthly demand zone!
Bulls must push above the main daily downtrend & at least the $ 132 resistance to gain traction!
Are you bull or bear? 🟩🟥
🐸More data in my chart fam!
⚠️ Not financial advice - DYOR.

Solanas first real runThink outside the box, think about how early you are to this game. Black and white t.v, slavery, wifi, ethernet, was all pretty recent if you really think about it. 2026 is a step in the future, with all pillars build and foundations laid since the 2000's, we are geared to see historical moments this next couple years... are you ready?

SOL/USDT – Major Support Zone the Key to Bullish Continuation?SOL/USDT on the weekly timeframe (1W) remains in a long-term bullish market structure, despite the current corrective phase. The rejection from the major resistance area around 240 – 250 USDT has triggered a healthy pullback. As long as the key support zone holds, the broader uptrend structure remains valid.
This correction is best interpreted as a reset phase, not a trend reversal.
---
Market Structure & Price Action
From a structural perspective, SOL continues to print:
Higher Highs and Higher Lows (macro bullish structure)
Signs of distribution near major resistance
A controlled pullback toward a high-probability demand zone
Identified Price Pattern
Range Distribution → Minor Breakdown → Deep Retracement
Bullish continuation setup while holding demand
The yellow zone 94 – 78 USDT represents:
Previous weekly resistance turned support
Strong institutional demand zone
A key reaction area from the last major impulsive move
---
Key Technical Levels
Major Resistance:
240 – 250 USDT
Intermediate Support / Reaction Zone:
120 – 130 USDT
Key Support (Yellow Zone):
94 – 78 USDT
Bullish Invalidation Level:
A strong weekly close below 78 USDT
---
Bullish Scenario
If price:
Holds the 94 – 78 USDT zone
Forms bullish weekly confirmation (long lower wick, bullish engulfing, strong close above support)
Potential upside path:
1. Bounce toward 125 – 140 USDT
2. Continuation to 180 – 200 USDT
3. Retest of 240 – 250 USDT
4. A confirmed breakout opens the door for new all-time highs
Bullish Conclusion:
The yellow zone acts as a high-confidence buy-the-dip area on the weekly structure, as long as it remains intact.
---
Bearish Scenario
If price:
Closes decisively below 78 USDT on the weekly timeframe
Fails to reclaim the key support zone
Then the risk shifts to:
1. Breakdown of the macro bullish structure
2. Decline toward 60 – 55 USDT
3. Extension toward 40 – 30 USDT (historical support region)
Bearish Conclusion:
A confirmed weekly breakdown below 78 USDT signals a long-term trend reversal, not just a correction.
---
Final Conclusion
SOL remains structurally bullish on the higher timeframe, and the current pullback is still considered healthy and technical.
The 94 – 78 USDT zone is the decisive level that will determine the next major move:
Hold → bullish continuation
Break → macro trend shift
Patience and weekly candle confirmation are crucial.
---
#SOLUSDT #Solana #CryptoAnalysis #WeeklyChart #KeySupport #DemandZone #BullishStructure #AltcoinMarket #PriceAction #MarketStructure

SOLUSD at long-term linear-regression supportSOLUSD has had a rough year in 2025 with major drawdowns and new highs as well. Neither bulls nor bears have had a painless path.
Will 2026 be different? A lot depends on the Fed, liquidity, inflation prints, and more.
But SOL found a bottom today at the -2 standard deviation line on a log-scale linear regression going back to the all-time low in December 2022. This is a convenient tool developed by @Forza that is an open-source script that "slightly modifies TradingView's built-in linear regression script" which allows it to be plotted on log-scale charts. I've thought recently that it may be worth taking a shot at SOL long, with risk limited to the -2 standard deviation line on a log scale chart.
The AVWAP from the inception of the chart (shown weekly above and dates back to June 2021 for this particular exchange's chart), lies around $96-$97.
No certainties exist in trading or investing, and a flush in 1Q would bring further pain to bullish SOL traders and long-term SOL investors. But if SOL continues its bullish path since late 2022, it could reach new all-time highs in 2026-2027. Maybe it's an investment worth considering. As always, do your own research!

SOLUSD - December Distribution Structure
Executive Summary
COINBASE:SOLUSD has declined approximately 52 percent from its November 2024 all-time high of 264 USD to current levels around 126 USD. This analysis examines the technical structure, on-chain metrics, and fundamental catalysts to determine high-probability trade zones. The evidence suggests further downside toward the 100-115 USD accumulation zone before a sustainable recovery can begin.
Technical Structure Analysis
Price Action Overview
Solana is currently trading within a descending channel that formed after the November 2024 peak. The structure shows:
Lower highs at 264, 220, 180, and 145 USD forming clear descending resistance
Lower lows indicating sustained selling pressure
Current price testing the 125-130 USD zone which previously acted as resistance in October 2024
Volume declining on bounces and increasing on selloffs - classic distribution signature
Key Support and Resistance Levels
Resistance Zones:
140-145 USD - Recent swing high rejection zone
160-165 USD - Previous support turned resistance
180-185 USD - Major structural resistance
Support Zones:
115-120 USD - Minor support, likely to break
100-105 USD - Major support, November 2024 breakout origin
85-90 USD - Secondary support if macro deteriorates
Moving Average Analysis
Price is trading below the 20, 50, and 200 period moving averages on the daily timeframe
The 20 MA has crossed below the 50 MA, confirming short-term bearish momentum
The 200 MA is flattening and beginning to slope downward
Moving averages are fanning out in bearish alignment
RSI and Momentum
Daily RSI is currently in the 35-40 range, approaching oversold but not yet at extreme levels
RSI has been making lower highs alongside price, confirming the downtrend
No bullish divergence present yet - divergence at the 100-115 zone would be a strong buy signal
Weekly RSI has room to decline further before reaching oversold extremes seen at previous bottoms
Volume Profile
High volume node exists at the 100-115 USD zone from the November 2024 accumulation period
Current price zone shows relatively low volume, suggesting lack of strong buyer interest
Volume has been declining during recent bounce attempts - weak demand
A volume spike at the 100-115 zone would confirm institutional accumulation
Fibonacci Retracement
Measuring from the September 2024 low of 120 USD to the November 2024 high of 264 USD:
0.382 retracement: 209 USD - Already broken
0.5 retracement: 192 USD - Already broken
0.618 retracement: 175 USD - Already broken
0.786 retracement: 151 USD - Already broken
Full retracement: 120 USD - Currently testing
The breakdown through the 0.786 level suggests the move is corrective in nature and a full retracement to the 100-120 USD origin zone is probable.
On-Chain and Fundamental Analysis
Network Activity Metrics
Solana network statistics show mixed signals:
Daily active addresses have declined from peak levels during the meme coin mania
Transaction counts remain elevated compared to other Layer 1 networks
Total Value Locked in Solana DeFi protocols has decreased from highs
NFT trading volume on Solana marketplaces has cooled significantly
Supply Distribution
Large holder concentration remains high with significant whale wallet activity
Exchange inflows have increased in recent weeks, indicating selling pressure
Staking participation remains strong, reducing liquid supply
FTX bankruptcy estate continues systematic liquidation of SOL holdings
Macro Factors Affecting Solana
Bearish Catalysts:
Federal Reserve December 2025 meeting maintained hawkish stance with fewer rate cuts projected for 2026
Risk-off sentiment affecting high-beta assets disproportionately
BITSTAMP:BTCUSD dominance rising, indicating capital rotation from altcoins to Bitcoin
Regulatory uncertainty regarding Solana ETF approval timeline
FTX estate selling pressure creating persistent supply overhang
Meme coin speculation that drove the 2024 rally has cooled substantially
Bullish Catalysts:
Solana network upgrades improving transaction throughput and reliability
Growing institutional interest in Solana ecosystem projects
Potential Solana ETF approval could drive significant inflows
Strong developer activity and ecosystem growth metrics
Firedancer client development progressing, promising improved network performance
Solana remains the preferred chain for new DeFi and consumer applications
Competitive Positioning
Solana maintains advantages over competing Layer 1 networks:
Transaction costs remain significantly lower than BITSTAMP:ETHUSD mainnet
Transaction speed and finality superior to most competitors
Developer ecosystem continues expanding despite price decline
Institutional partnerships and integrations increasing
However, challenges persist:
Network outages and congestion issues have damaged reputation
Centralization concerns regarding validator distribution
Competition from Ethereum Layer 2 solutions intensifying
Regulatory classification uncertainty in United States
Whale and Institutional Activity
Recent on-chain data indicates:
Large wallets have been net sellers over the past 30 days
Exchange deposits from whale addresses have increased
Institutional funds have reduced Solana allocation according to fund flow data
However, accumulation signals are appearing at lower price levels
The pattern suggests distribution at current levels with potential accumulation beginning at the 100-115 USD zone.
Trade Framework
Primary Scenario - Bearish Continuation (Higher Probability)
The weight of evidence supports further downside before a sustainable bottom forms:
Technical structure remains bearish with lower highs and lower lows
Price below all major moving averages
Macro environment unfavorable for risk assets
On-chain metrics showing distribution
No bullish divergence on momentum indicators yet
Short Setup:
Entry Zone: 130-140 USD on relief bounces
Stop Loss: Above 148 USD
Target 1: 115-118 USD
Target 2: 105-108 USD
Target 3: 95-100 USD
Secondary Scenario - Accumulation at Support
The 100-115 USD zone represents a high-conviction long opportunity if confirmation signals appear:
This zone was the origin of the November 2024 rally
High volume node from previous accumulation period
Full Fibonacci retracement level
Psychological round number support at 100 USD
Long Setup:
Entry Zone: 100-115 USD
Stop Loss: Below 92 USD
Target 1: 130-135 USD
Target 2: 150-160 USD
Target 3: 180-200 USD
Confirmation Signals Required for Long Entry:
Bullish RSI divergence on daily timeframe
Volume spike on bullish candle at support
Price reclaiming the 20 period moving average
Higher low formation on 4-hour timeframe
Decrease in exchange inflows from whale wallets
Risk Management
Position sizing should not exceed 2-3 percent of portfolio for short setups
Long setups at the 100-115 zone warrant 3-5 percent allocation due to higher conviction
Scale into positions using 3 tranches rather than single entry
Move stop loss to breakeven after first target achieved
Avoid trading the 120-130 USD range without clear directional confirmation
Monitor BITSTAMP:BTCUSD price action as correlation remains high
Invalidation Levels
Bearish thesis invalidated if:
Daily close above 150 USD with increasing volume
Price reclaims 50 and 200 moving averages
RSI breaks above 60 with momentum
Bullish thesis invalidated if:
Daily close below 92 USD
Volume spike on breakdown below 100 USD
Bitcoin breaks below 75000 USD triggering broader market selloff
Timeline Expectations
Short-term (1-4 weeks): Expect continued weakness toward 100-115 USD support zone
Medium-term (1-3 months): Potential basing pattern formation if support holds
Long-term (3-6 months): Recovery rally possible if macro conditions improve and Solana-specific catalysts materialize
Conclusion
COINBASE:SOLUSD is in a clear distribution phase following the November 2024 peak. The technical structure, on-chain metrics, and macro environment all point to further downside before a sustainable bottom forms.
The 100-115 USD zone represents the highest probability accumulation area based on:
Historical significance as the November 2024 breakout origin
Fibonacci full retracement level
High volume node from previous accumulation
Psychological support at 100 USD round number
The recommended approach is patience. Avoid buying at current levels where distribution is occurring. Wait for price to reach the 100-115 USD zone and confirm with bullish divergence and volume signals before establishing long positions.
For traders seeking short exposure, relief bounces to the 130-140 USD zone offer favorable risk-reward entries with defined stops above 148 USD.
This is not financial advice. Always conduct independent research and manage risk appropriately.

Pour me a cup of SOLANA plzOn the weekly chart, I see a really nice cup and handle pattern.
This pattern is historically a bullish sign of good things to come.
