SOL Update: Downtrend confirmed, hold on to your horses SOL Update: Solana remains in a clear downtrend, with price continuing to respect the descending channel that’s been in place since the breakdown from the highs. The broader structure is defined by lower highs and lower lows, and each bounce so far has been corrective rather than impulsive. The recent move back toward the ~$125 area looks more like a relief reaction than a genuine attempt at trend reversal.
The ~$125 zone is a key inflection point, but at this stage it’s acting more like resistance than support. Price has struggled to reclaim and hold above that level, and without a strong impulsive push and follow-through, it’s hard to make a case for acceptance back above it. As long as SOL remains below this level and inside the descending channel, the path of least resistance remains lower.
Zooming out, this aligns with the broader crypto market working through a corrective and risk-off phase, where strength tends to fade and rallies get sold. In that environment, higher timeframe downtrends typically persist until a clear base forms or a major level is reclaimed. For SOL, that means continued downside risk and consolidation until structure improves.
For now, I’m treating any moves into resistance as corrective and staying cautious. Until SOL can break the downtrend and reclaim key levels with conviction, this remains a downtrend-first market rather than a buy-the-dip environment.
Looking for more down, and then eventually hopefully some relief.
SOLUSD

SOLANA to 185$!🟩 SOLANA LONG SETUP – Elliott Wave + PA
After a successful short as posted a couple of days ago, SOL is nearing the end of a W–X–Y corrective structure, with the final (Y)–C wave looking mature. RSI is printing a clear bullish divergence ⚠️, signaling fading bearish momentum.
The key trigger now:
➡️ A clean break above the blue channel-top trendline.
That’s the level where an impulsive reversal can launch 🚀.
Quick Highlights:
• 🌀 Corrective pattern nearly complete
• 📉 RSI bullish divergence forming
• 📈 Break above blue line = long confirmation
• 🎯 Impulsive upside likely once breakout holds
Watching for that breakout to flip bias from defensive to aggressively bullish.

SHORT IDEA SOL is showing weak momentum after a failed push higher.
Price got rejected from resistance, and sellers are stepping in.
RSI is rolling over, showing bearish divergence and loss of strength.
As long as SOL stays below resistance, I’m expecting a move lower toward support.
Bias remains bearish until we see a strong reclaim.
Not financial advice. Trade with confirmation.

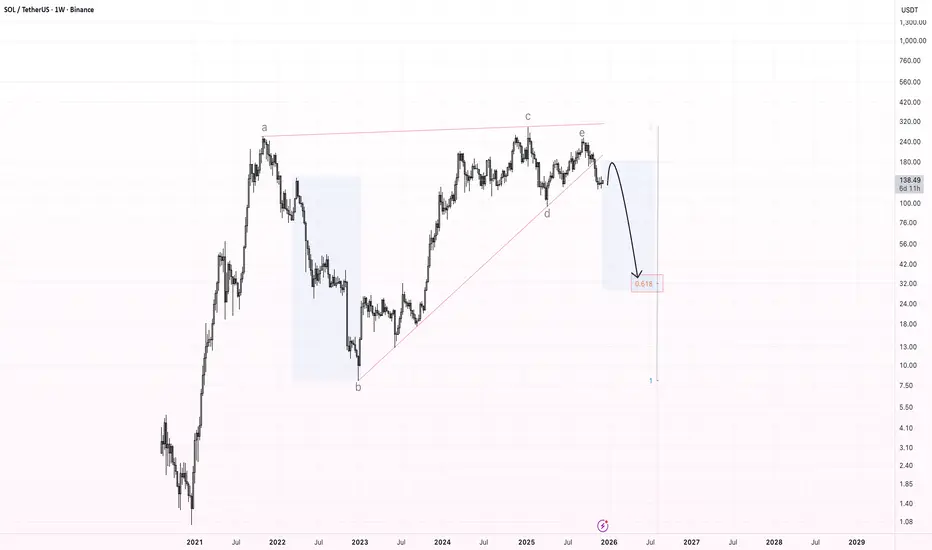
SOL – Bearish Rising Wedge Breakdown (Weekly Chart)The chart shows a large multi-year bearish rising wedge , which has now been broken to the downside. This wedge has been forming since the 2022 bottom and consists of clear wave structure (a–b–c–d–e), with the final wave e rejecting at the upper boundary and triggering the breakdown.
After this kind of pattern, the market often provides a relief bounce back into the broken support , which should now act as resistance . For SOL, the expected retest zone is located around $170–$190.
If price confirms resistance there, I expect the beginning of a larger downward wave , targeting the main Fibonacci zone near the 0.618 retracement, which aligns with a long-term target around $30–$40.
This zone marks the primary downside target for a full wedge breakdown.
Key Points:
Multi-year bearish rising wedge has broken.
Expected retest: $170–$190.
Major downside target: $30–$40 (0.618 zone).
Potential start of a macro corrective wave.
SOL/USDT : LIVE TRADEHello friends
considering the downtrend we have and the power of the sellers, we know that we should trade with the trend and be on the side of the one who has the market power.
So, at this stage, when we understand that our trend is down, we are now looking for the entry point that we have identified for you. This area that we have identified is the source of the price drop, which is full of sell orders. If the price pulls back to this area, when the sell orders are activated, they will cause the price to fall again.
This analysis is purely technically reviewed and is not a buy or sell offer, so do not be emotional and follow capital management.
*Trade safely with us*

SOLANA Buy Signal With 60% Profit (3D)Considering that Solana is approaching a strong demand zone and if this corrective wave reaches the entry area it will result in more than a 55% price drop we will be looking for long buy positions at the two specified entry points.
The origin we are approaching is a strong one that has previously swept liquidity pools therefore there is significant money flow in that area.
We have two targets at the first target you should take profit and then move to break even this is a higher time frame setup and this signal may take several weeks to play out.
Do not enter the position without capital management and stop setting
Comment if you have any questions
thank you

$SOL/USDT ANALYSISOn the 2-hour SOL/USDT chart, price action is clearly moving inside a descending channel, showing sustained bearish control. The last strong impulse leg pushed price lower and that move has not been meaningfully recovered, which keeps the directional lean to the downside. Structurally, the market has already shifted bearish with lower highs and lower lows, and every bounce has been capped below prior supply. The Ichimoku Cloud is above price and acting as resistance, reinforcing weak flow tone. Recent candles show price reacting near the lower boundary of the channel, which marks a short-term reaction area, but there is no confirmed bullish shift yet. From a price-action perspective, prior bullish order blocks have been invalidated, while bearish order blocks overhead remain respected. Liquidity has been swept on the downside recently, followed by only a shallow reaction, which suggests absorption rather than reversal. There is also visible inefficiency from the last drop that has not been filled, keeping downside pressure active. Overall, the local market structure remains bearish, momentum is weak, and flow is still aligned with continuation rather than reversal until a clear structure change occurs on this timeframe.

SOLUSDT – Long Trade Setup and Analysis | 4H)SOLUSDT – Long Trade Setup and Analysis | 4H)
SOL is currently trading within a high-probability demand zone (123–121) that has been tested multiple times. Price compression at this base suggests that sellers are exhausted, and an upward reaction is likely.
Trade Plan
Entry Zone: 123 – 121
Stop-Loss: Below 121 (Daily close preferred)
Targets:
T1: 132 – 135
T2: 140 – 145 (Major resistance and range high)
Technical Analysis
Strong Horizontal Support: Multiple reactions confirm that buyers are active.
RSI ~35: Near oversold territory → increases the probability of a bounce.
Liquidity Sweep: Wick reversal below support indicates a stop-hunt before the reversal.
Structure: Downside momentum is slowing; base formation is visible.
DYOR | NFA.

DeGRAM | SOLUSD is below $130📊 Technical Analysis
● SOL/USD remains locked in a broader descending channel after a sharp breakdown from the prior consolidation range. Price continues to respect the dynamic resistance line, while each rebound forms lower highs, confirming bearish market structure.
● The recent flag and consolidation patterns developed below resistance suggest continuation rather than reversal. A loss of the current consolidation floor exposes the major support zone near 115–110 as the next downside objective.
💡 Fundamental Analysis
● The broader crypto market remains pressured by risk-off sentiment and reduced liquidity, limiting upside momentum for high-beta assets like Solana.
✨ Summary
● Bearish trend intact below descending resistance. Key resistance: 135–140. Targets: 115–110. Invalidation above channel resistance.
-------------------
Share your opinion in the comments and support the idea with a like. Thanks for your support!

Solana (SOL): towards $117?Hi!
SOL remains in a clear descending channel, indicating sustained bearish momentum. After a period of consolidation within the rectangular range, the price recently rejected the upper boundary, forming a potential continuation pattern. The RSI sits near 40, signaling slight oversold conditions but no strong reversal yet. Price action suggests a likely retest of the channel’s lower boundary near $117.48, aligning with the support zone highlighted. Traders should watch for confirmation of a bounce at this level or continuation lower. Short-term pullbacks may occur, but the dominant trend remains bearish.
Conclusion: Trend-following strategy favored; bearish continuation likely, $117 support key.

SOL Scalp Sell/Short Signal (1H)Given the formation of lower LHs and the bearish internal structure of Solana based on a bearish ICH, we can look for short sell positions below the previous highs.
At the first target, move to break-even and shift the stop loss to the entry.
Do not enter the position without capital management and stop setting
Comment if you have any questions
thank you

SOL 4H – Golden Pocket Rejection, Trend Pressure Still DownSOL continues to trade within a clearly defined bearish structure, with both the daily and 4H trendlines acting as dynamic resistance. The recent push into the 0.618–0.65 Fibonacci golden pocket was rejected cleanly, aligning with prior horizontal resistance near the 144 level — reinforcing this zone as a high-probability supply area.
Price remains capped below the 50 and 100 EMAs, which are now compressing and sloping downward, suggesting downside continuation unless structure is reclaimed. As long as SOL holds below the descending trendlines, rallies are best viewed as corrective rather than impulsive.
On the downside, range support near 123–124 remains the key level to watch. A clean break below this zone would open the door for expansion lower, while any bullish scenario requires a reclaim and hold above the golden pocket and trend resistance — something price has failed to achieve so far.
Momentum shows short-term relief attempts, but trend control remains firmly bearish until proven otherwise.

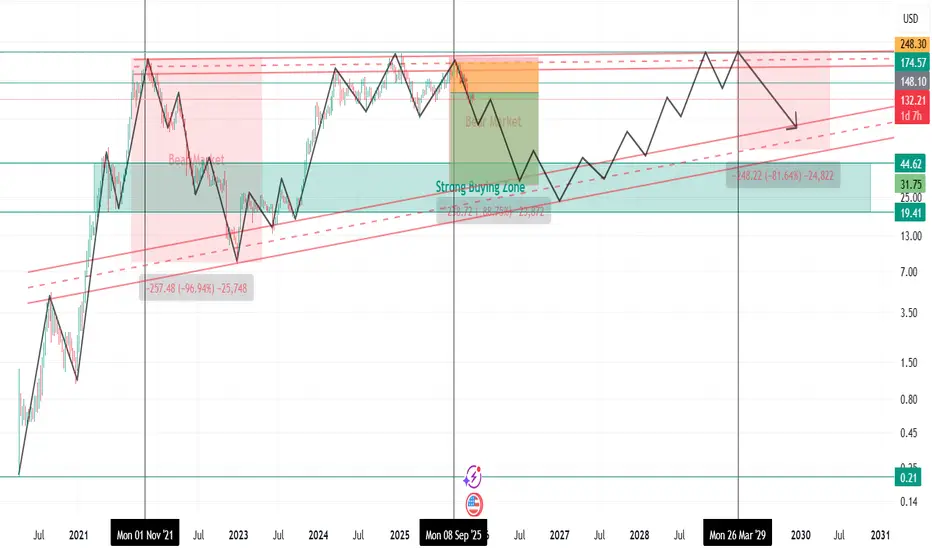
SOLUSD Long-Term Market Cycle Analysis |Bear Market Phase ActiveSolana (SOL) was listed on 10 April 2020 at around $0.21 .
During the 2020–2021 bull market (Altseason Phase-4) , SOL showed an exceptionally strong rally after listing and formed its all-time high near $260 on 6 November 2021 .
From that point, a major bear market started.
Between 7 April 2021 and 29 December 2022 , Solana remained in a clear downtrend , printing continuous lower highs and lower lows.
Price dropped from $260 to nearly $8 , resulting in a −96.9% correction , which is typical for high-beta altcoins during bear cycles.
A new bull market phase began on 30 December 2022 , but according to current market structure and cycle analysis , this bull phase has now ended around 13 September 2025 .
The overall structure has shifted bearish , and Solana is currently trading in a confirmed bear market phase starting from 14 September 2025 .
Key Resistance Zones (Strong Reversal Areas):
$148
$174
$210
These levels are expected to act as major supply zones , where strong selling pressure and reversals are likely.
Bear Market Outlook & Risk Projection
Bear market may extend until October 2026
A further downside move of up to −88% is possible within this cycle
If such a correction occurs, there is an 80% probability that SOL could trade in the $45 – $30 range during September–October 2026
Key Support Zones (Accumulation Areas):
$80
$45
$30
Trading Bias
* Avoid long positions during this phase
* Focus on short setups near resistance zones
* Trade with strict risk management and confirmation
Disclaimer:
This analysis is based on historical market cycles, structure, and technical behavior .
Not financial advice. Always manage risk.
SOL/USDT : SIGNALHello friends
Given the decline we had and the strength of the sellers, the price has reached the support areas we identified and has been well supported by the buyers in this area and has managed to hit higher lows.
The price is now in an important support area, and if buyers show support from this area, the price could grow and move to the specified targets.
Please note that this analysis is purely technical and does not constitute a buy or sell offer, so do not act emotionally and observe capital management.
*Trade safely with us*

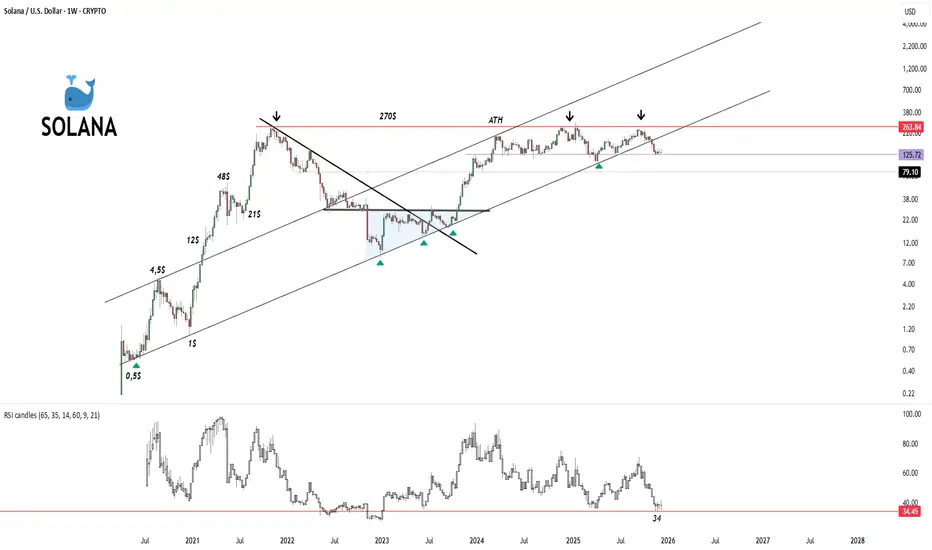
SOLANA MACRO VIEW !
1. Macro Trend: Ascending Channel
The most dominant feature of this chart is the massive ascending parallel channel (the two long black lines sloping upwards).
Long-Term Bullish: Despite volatility, the price has generally trended upward over the last several years, respecting the boundaries of this channel.
Current Status: The price is currently in the lower half of this channel. After being rejected near the top of the channel (around the ATH region), it is retracing downward.
2. Key Support & Resistance Levels
Resistance (The Ceiling):
~$263 - $270 (Red Zone): This is the major historical resistance area, aligned with the All-Time High (ATH). The chart shows three distinct rejections (marked by black downward arrows) in this area over the last year, indicating strong selling pressure whenever SOL approaches this price.
Upper Channel Line: The diagonal upper line acts as dynamic resistance.
Support (The Floor):
~$125.72 (Purple Line): The price is currently trading at $131.50, just above this crucial horizontal support level. This level previously acted as resistance during the recovery phase; holding this line is critical for bulls.
~$79.10 (Dotted Line): If the $125 level fails, the next major historical support is around $79.
Lower Channel Line: The diagonal bottom line is the "trend defender." Every time the price has touched this line (marked by green triangles), it has bounced significantly.
3. Indicator Analysis: RSI (Relative Strength Index)
The bottom panel shows the RSI, which measures momentum.
Approaching Oversold: The RSI is currently at 34.45.
Historical Bounce Zone: The red horizontal line at 34.45 on the RSI panel suggests this is a historical "floor" for momentum. In previous instances (like late 2020 and mid-2022), when the RSI hit this low, the price eventually found a bottom and reversed upward.
Divergence: The RSI is making lower lows, confirming the strength of the current downtrend, but it is reaching a point where sellers often become exhausted.
4. Chart Patterns & Behavior
Rejection at ATH: The "Double Top" or "Triple Top" formation near the $260-$270 level is a bearish reversal pattern, which explains the significant correction SOL is currently experiencing.
Correction Phase: Since hitting the top of the channel, the price has been in a consistent downtrend (lower highs and lower lows on the weekly timeframe).
Summary
The chart depicts a critical decision point for Solana.
The Bearish Case: If the price breaks below the $125 support, it could flush down to the $80 region or the bottom of the channel to find liquidity.
The Bullish Case: The RSI hitting historical support (34) combined with the horizontal price support at $125 suggests a potential bounce area. If buyers step in here, the trend remains intact
-------------------
1. Historical "Bottom" Zone (Momentum Support)
Looking at the bottom RSI panel, whenever the RSI line touches or approaches the 34 level (the red horizontal line), we see that selling pressure tends to exhaust and buyers step in.
Past Examples: Looking at the left side of the chart (late 2020 - early 2021), when the RSI dropped to these low levels, the Solana price found a bottom (around $1) and subsequently launched a massive bullish trend.
Meaning: This level acts as a psychological floor where "bear" (seller) strength runs out and "bulls" (buyers) prepare to take over momentum.
2. Approaching Oversold Signal
RSI typically considers anything below 30 as "oversold." The 34 level is very close to this zone.
The fact that the RSI is currently at 34.45 indicates that the price has dropped sharply and quickly, and this decline is approaching an unsustainable point.
Technically, this is interpreted as a zone where it is "too late to sell, but time to look for buying opportunities."
3. Confluence of Price and RSI
The price is trading at $131.50, trying to hold the $125 support.
The fact that the RSI has hit the 34 support at this exact same moment creates a condition of "Double Support" (support in both price and momentum).
This alignment increases the probability of a reaction bounce from this area.
4. Risk Warning
While the RSI 34 level is strong support, if this level is broken to the downside (meaning RSI slides below 30 into the 20s), it indicates that the downtrend is extremely strong and panic is continuing. In this scenario, there is a risk of the price retracing to the next major support zone around $79.
In Summary: The 34 RSI level is currently a "Make or Break" decision point for Solana. Historical data suggests that this level usually marks a reversal point.
+
SOL/BTC 1w
SOL Dominance
#SOL/USDT Final Liquidity Zone Before Expansion?#SOL
The price is moving in a descending channel on the 1-hour timeframe. It has reached the lower boundary and is heading towards a breakout, with a retest of the upper boundary expected.
We are seeing a bearish bias in the Relative Strength Index (RSI), which has reached near the lower boundary, and an upward bounce is expected.
There is a key support zone in green at 130, and the price has bounced from this level several times. Another bounce is expected.
We are seeing a trend towards stabilizing above the 100-period moving average, which we are approaching, supporting the upward trend.
Entry Price: 132
First Target: 134
Second Target: 137
Third Target: 140
Remember a simple principle: Money Management.
Place your stop-loss order below the green support zone.
For any questions, please leave a comment.
Thank you.

$SOL Solana is currently in a clear accumulation phase following a strong reaction from the major demand zone.
The horizontal accumulation in this zone indicates both a re-intensification of liquidity and the market gathering energy for the next directional breakout.
As long as the region holds, the structure is positive, and this accumulation will be the key to the next expansion phase.

Solana (SOL/USDT) – 4H Technical AnalysisSolana is currently consolidating within a tight range after failing to sustain momentum above the short-term moving averages. Price continues to trade below the 200-EMA, which keeps the broader 4H trend tilted to the bearish side.
Key Levels
Immediate Resistance:
$135–136 zone where price recently faced multiple rejections.
Short-term EMAs are also flattening near this region, creating additional overhead pressure.
Major Supply Zone:
$168–175 (highlighted red area).
This remains a strong higher-timeframe resistance where sellers previously dominated.
Immediate Support:
$128–130 (blue demand zone).
Price rebounded from here several times, showing active buyers.
Market Structure
Price attempted a short-lived recovery but failed to break above the 200-EMA. The market is forming lower highs, indicating weakening bullish attempts. Unless SOL makes a decisive close above the $135–136 region, upside continuation remains limited.
A sweep of liquidity into the $128–130 support zone is still possible, especially if momentum weakens further.
RSI Momentum
The RSI is hovering around the mid-zone (~45–47), reflecting indecision and lack of strong directional momentum.
No major bullish or bearish divergence is present on the current 4H structure.
As long as RSI remains below 50, bulls are not in clear control.
Possible Scenarios
Bullish Case
A clean breakout and 4H close above $136 could open room for a move toward $142–145, followed by a potential retest of the $155–160 region.
However, the 200-EMA overhead means buyers need strong volume to shift structure.
Bearish Case
If price breaks below the $128–130 demand zone, SOL may revisit $122–124, where the next support cluster is visible.
Failure to hold these levels could extend the corrective structure.
Neutral Summary
SOL is currently range-bound between $130–136, with neither side showing strong conviction. Traders may prefer waiting for a breakout from this range or a clearer reaction at the major support zone before taking directional positions.
This analysis is for educational purposes only and reflects general market observations, not financial advice.

SOL : LIVE TRADEHello friends
as you can see, after the resistance we set was broken, the price has grown well, and now with this red shadow, there is a sign of sellers entering, and there is a possibility of price correction, and the price can grow again from these areas and move to our targets, of course, if buyers support the support area again...
This analysis is purely from a technical perspective and is not a buy or sell recommendation, so please follow risk and capital management.
*Trade safely with us*

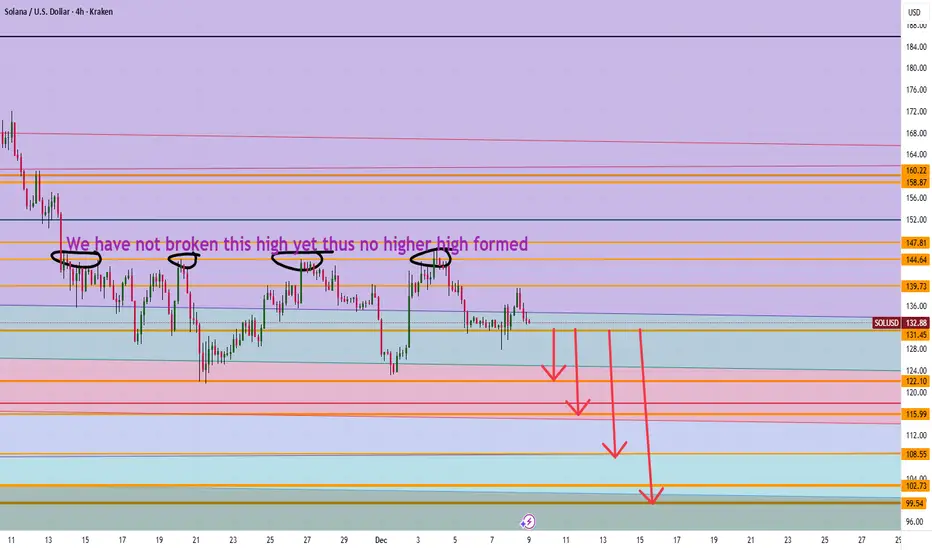
Is Solana heading to $100 It appears we have not made new higher highs in price action on the 4 hour and thus a possible movement down to $108 then 100 levels make sense. However if we can break 139 level then 147 can make sense going up.
Trade Smarter Live Better
Kris
Solana Rebounds Weakly with No Clear Trend SignalsSolana on the 4H timeframe is only showing a mild pullback, as neither technicals nor news indicate fresh inflows strong enough to shift momentum. Price remains capped below the 138–142 FVG resistance cluster, and although small rebounds occur, their narrow range highlights the lack of aggressive buying. The Ichimoku cloud and multiple overhead FVGs form a thick supply layer, causing every upward attempt to be sold off — making a breakout relatively unlikely.
Volume behaviour also supports the idea of a technical retracement: it picks up slightly at the lows but fades as price climbs, signalling reactive buying rather than committed inflows. If SOL fails to break above 142, a move back down to fill the lower FVG at 128–123 remains a reasonable scenario.

No Clear Path yet...but I Still Favor Higher in Orange or BlackOrange represents a FLAT retracement, whereas Black represents a standard retracement. However, since we have not even traded above the 23.6%, I am still carrying a purple OML count.
Therefore, SOL is about as clear as mud.
Chris

SOLANA – Key Support Retest, Watching HTF Structure CloselySOL is interacting with one of the most important HTF zones on the chart — the multi-year support level that has repeatedly defined trend transitions. This zone has served as structural support during expansion phases, a breakout base during the run toward all-time highs, and later as a liquidity pool during corrective cycles. Every major deviation from this line has led to a significant move in the opposite direction, making this retest highly meaningful.
Earlier in the chart, support broke and produced a full liquidity sweep, clearing long-position stop clusters before price reclaimed the level and initiated a multi-month advance. The presence of an order block just above this zone adds additional structure: it acted as a redistribution area during the breakdown, and later as the origin of re-accumulation. The recent taps into this region suggest the market is again probing for resting liquidity and responsive buy orders.
Price is now compressing between HTF support and declining 50/100 EMAs, creating a classic higher-timeframe squeeze. EMAs continue to slope downward, signaling a bearish macro trend, but candles remain supported at the long-term horizontal level. This type of compression typically resolves with a decisive expansion once liquidity is absorbed from one side.
The FVG Reaction Zone earlier in the trend shows how SOL tends to return to inefficiencies before choosing direction. The current circled region may represent the same behavior on a larger scale — an attempt to rebalance price before either reclaiming the EMAs or continuing displacement lower.
Momentum indicators add another layer: Stoch RSI is turning upward from deeply oversold territory, suggesting momentum exhaustion on the downside but not yet confirming a trend reversal. Historically on this timeframe, these rotations have preceded multi-week expansions when aligned with structural reclaim, but have also failed when EMAs continued to reject price.
Overall, SOL is positioned at a pivotal HTF decision point:
Hold support → potential base formation and EMA reclaim attempts
Lose support → opens the door to a fresh liquidity sweep into prior structural lows
Until a break in structure or EMA reclaim occurs, this remains a compression zone with elevated importance for trend continuation or reversal.
